The UAH-CI algorithm displayed two areas with high strength of signal values (64 and 92) across southern Cumberland and western Sampson counties on the 1702z image. These cells intensified quickly into two thunderstorms and a report of penny sized hail was received from the eastern storm at 1823z, more than an hour after the algorithm first detected these thunderstorms.
Tag: GOESR-Satcast
CI sucess over Walker County, TX
BIS: Another UAH CI Victory
A severe thunderstorm developed over northeast MT and straddled the Canada/ND border. The cirrus had finally cleared south/southeast of the storm, so we were waiting for one or both of the GOES CI products to kick in. Sure enough by 22z, the UAH-CI product indicated about 50% strength of signal along developing cumulus to the south of the severe storm. By 2224z, KMBX radar indicated convection certainly did “zipper down” the cold front/dryline as the UAH-CI product indictated at 22z, giving us a 24 minute lead time for the developing convection.
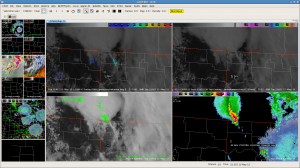
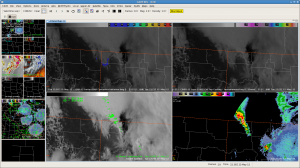
ABQ: UAH CI and UW CTC Victory, 5/22
1745z image indicates developing cumulus over extreme northeast NM. In the 1830z image, UAH-CI product indicates a cluster of cumulus with a high confidence of convectively initiating. UW-CTC product also indicates rapid cloud-top cooling with the eastern-most convective element. Given the deeply mixed airmass with minimal cap, this would lend confidence to convective initiation soon. Sure enough, by 1915z the 15-minute lightning plot indicates some CG strikes with the eastern-most convective element, with a lead time to convective initiation of over one hour.
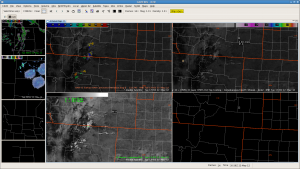
- 1830 UTC
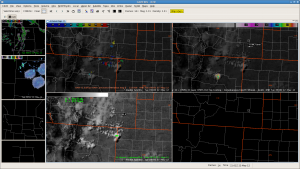
CI & CTC May Provide Lead Time on JAX-area Storm
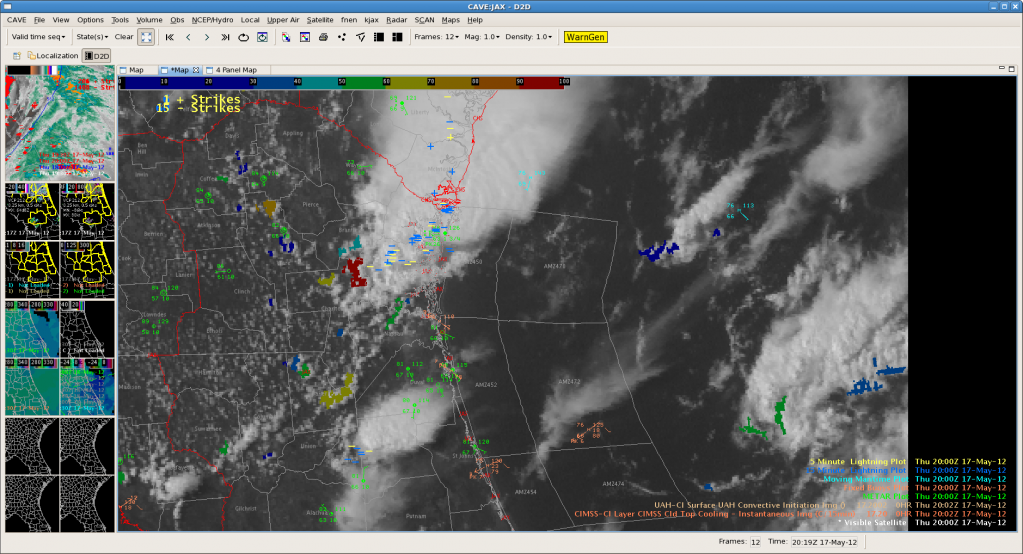
Another severe thunderstorm warning was recently issued (2148 UTC) for a portion of southeastern Georgia (Appling and Jeff Davis Counties), west of Vidalia. It’s worth noting that both the UAH CI and the UW CTC products flagged this storm quite some time ago.
The first indication on this cell occurred with a 59 strength-of-signal indication from the UAH CI product.

The SOS increased to 68 on the next satellite scan, then 71 on the subsequent scan (2015 UTC). The UW CTC flagged the storm for the first time at 2045 UTC with CTC rates of -13 to -14 C/15min, and that decreased to -16 C/15 min on the next image.
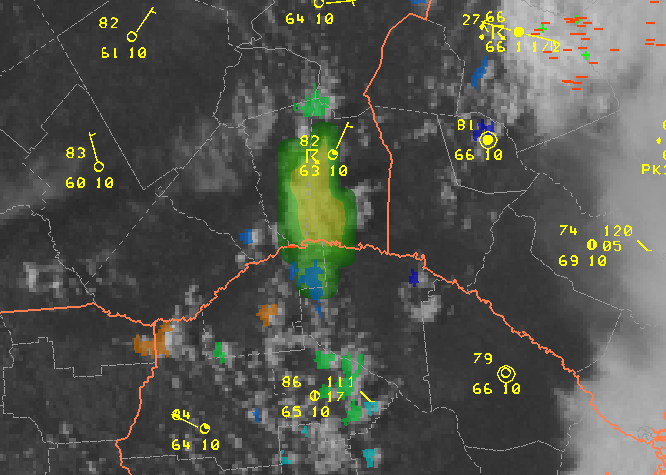
The visible imagery becomes quite impressive with overshooting tops by 2130 UTC. The SVR was issued at 2148 UTC, based mostly on distant radars. The 3DVAR analysis domain was just recently expanded to include this area, and MRMS POSH and MEHS were not particularly impressive.
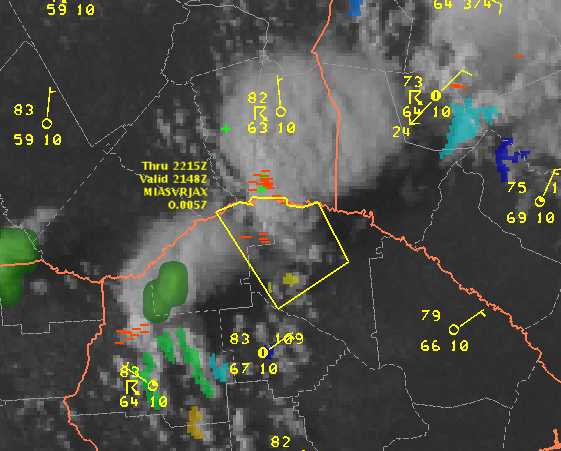
JAX – 3D Var vs Dual Pol
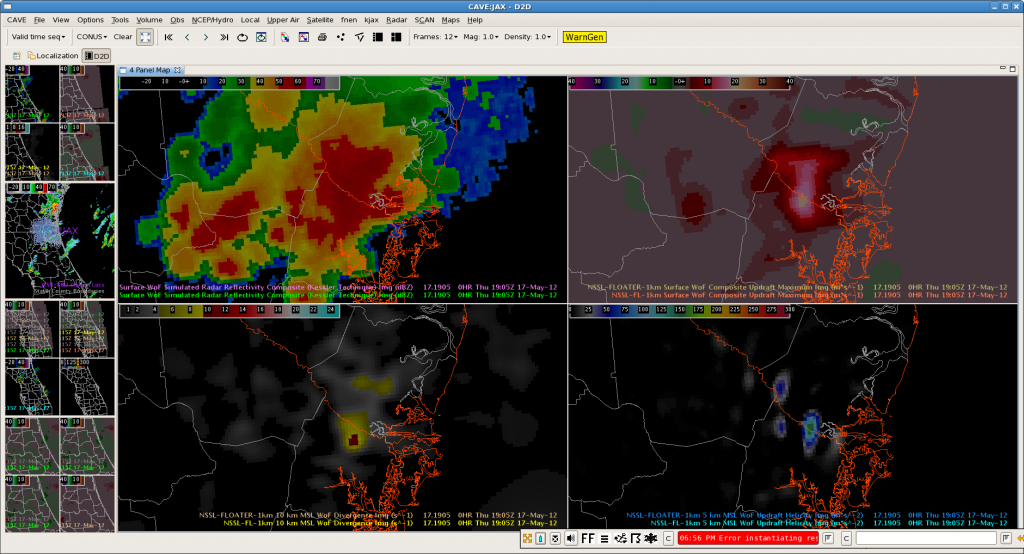
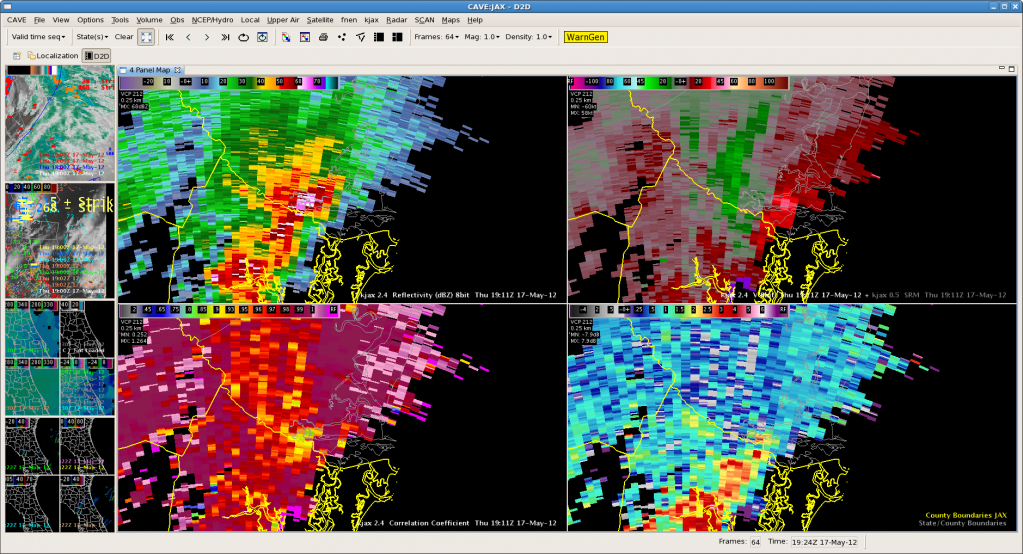
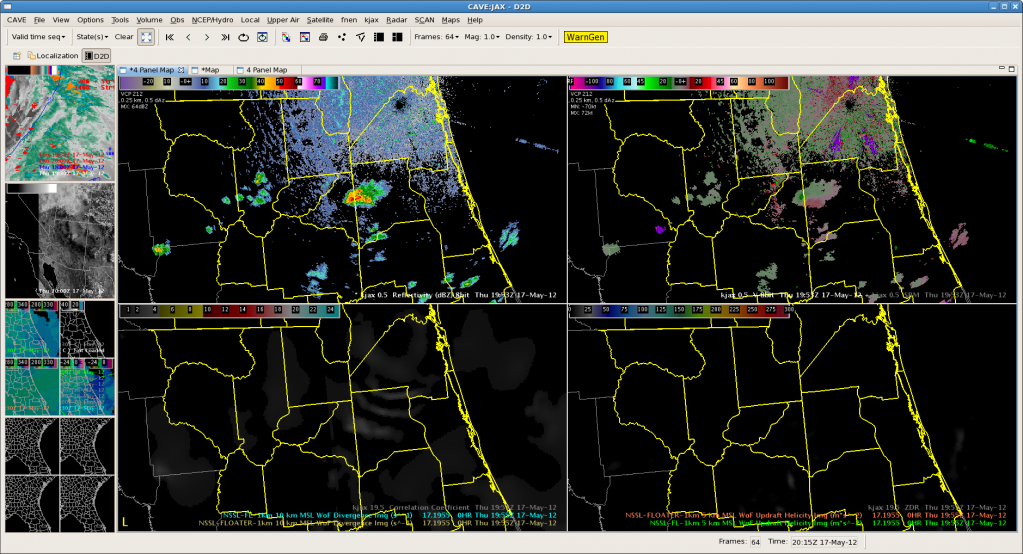
Here is an good example of 3d Var picking up on a strengthening storm and some mid level rotation. The top 4 panel 3 d var from 1905 and the second is radar from 6 minutes later. The updraft strength, updraft helicity and updraft velocity products show a strong signal while the mid level storm relative velocity images (3 and 4 degree scans especially) have good rotation developing. Not much at low levels (images not shown) but nice example of 3-d Var pick up and highlighting mid level rotation. One additional feature that would be very good to have in the 3d var data is something that shows the height of max updraft helicity. Built a 4 panel to compare all tilts radar (top two panels) to 3-d var updraft helicity and storm top (10 km) divergence as they seem to be good parameters to for finding rapidly intensifying/severe storms and will have to see how it works for the next storm. Below is an example of the procedure with interesting gravity wave like features from the previously dissipating storm but nothing much firing yet to see how it works.
Interestingly there is a red (94%) and a few other CI detections in the vicinity of the ‘gravity wave’ looking things. Curious to see how they build…
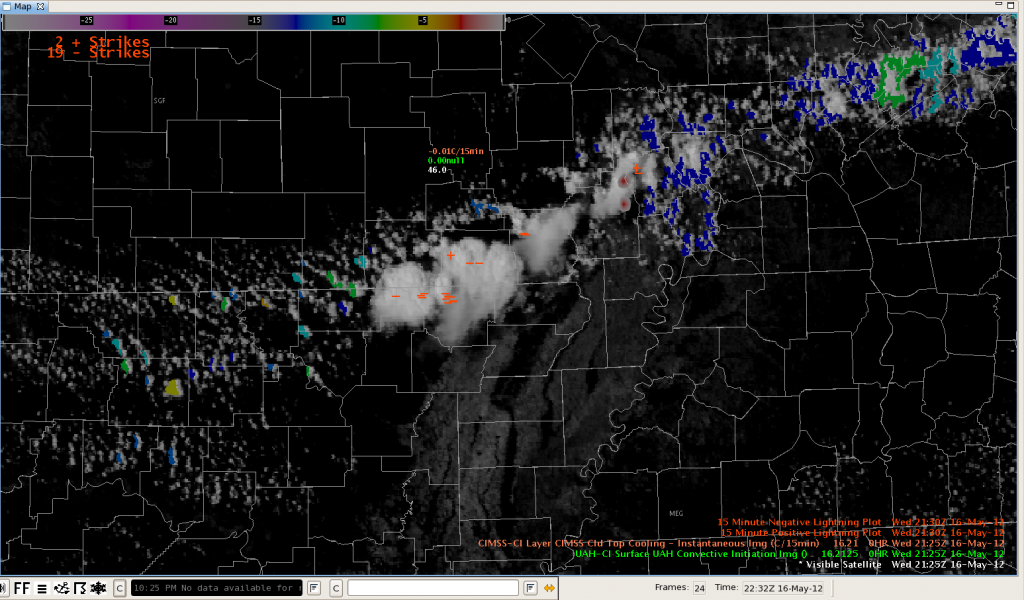
Convective Initiation – Verified!
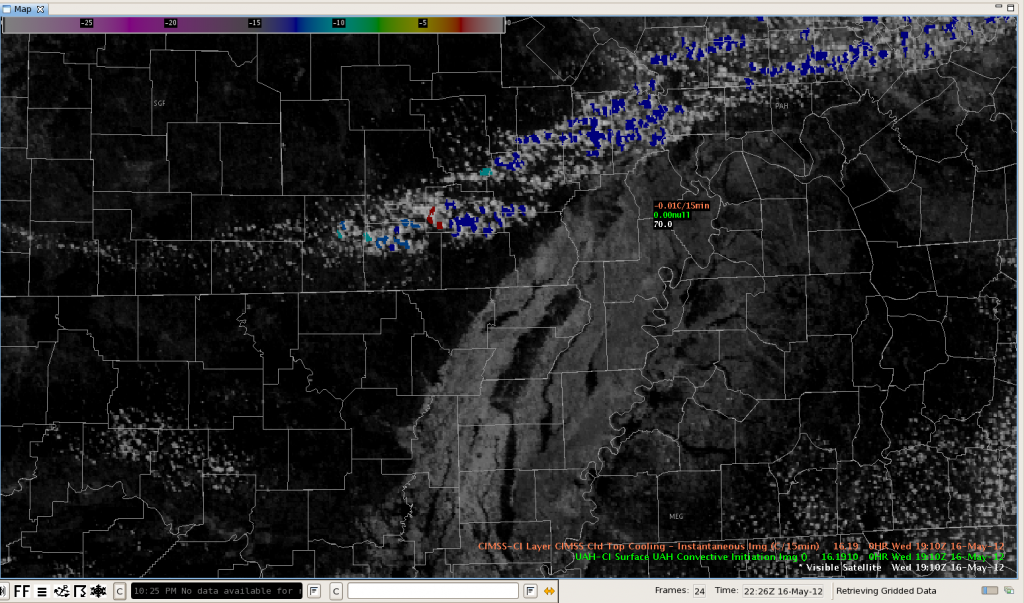
This series of images shows an ideal case of the CI product detecting a rapid development of storms along a cold front in northeast Arkansas. The first image shows a strong CI signal (red) at 19:10.
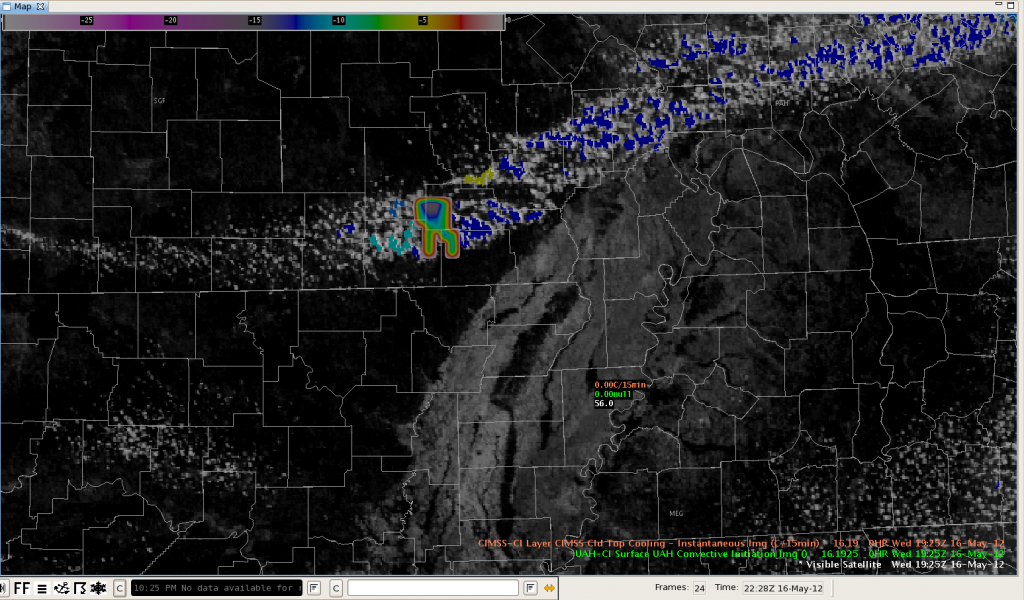
The second image shows the same area about 10 minutes later at 19:25. The weird tooth-shaped object is the Cloud Top Cooling rate and this indicated -16 deg/15 min.
Finally, at 21:25, about two hours later, the visible imagery showed a developing storm with an overshooting top.
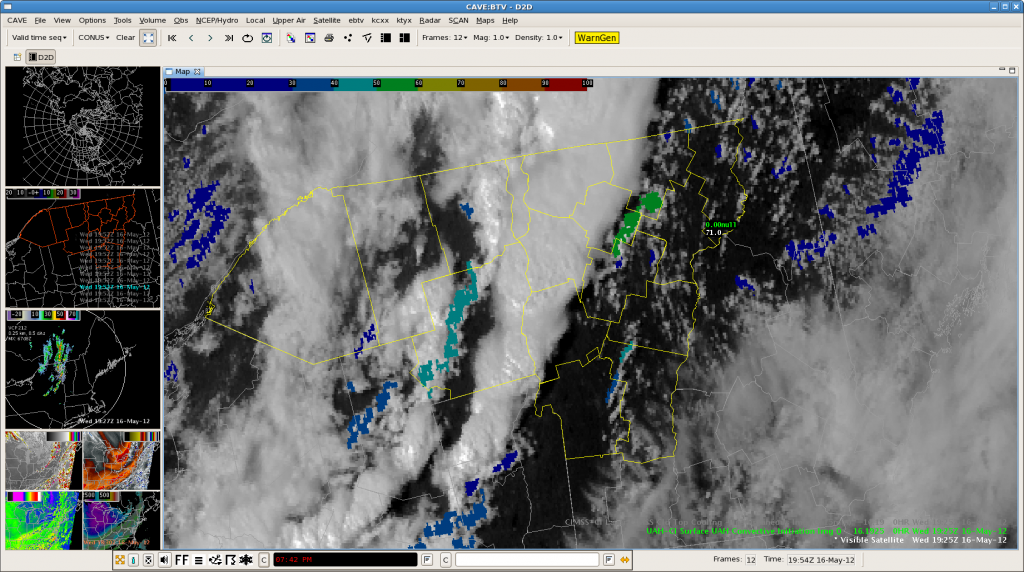
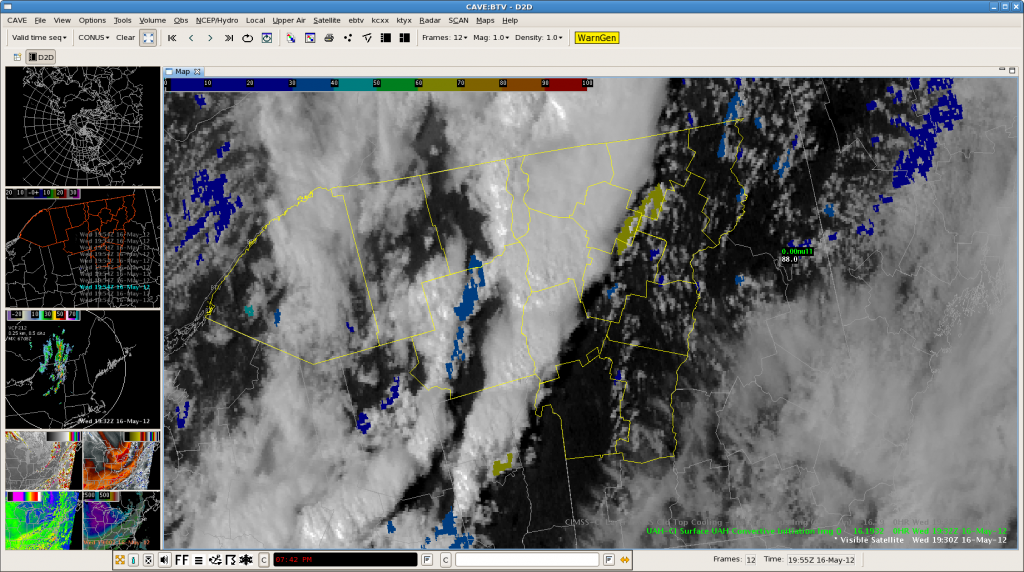
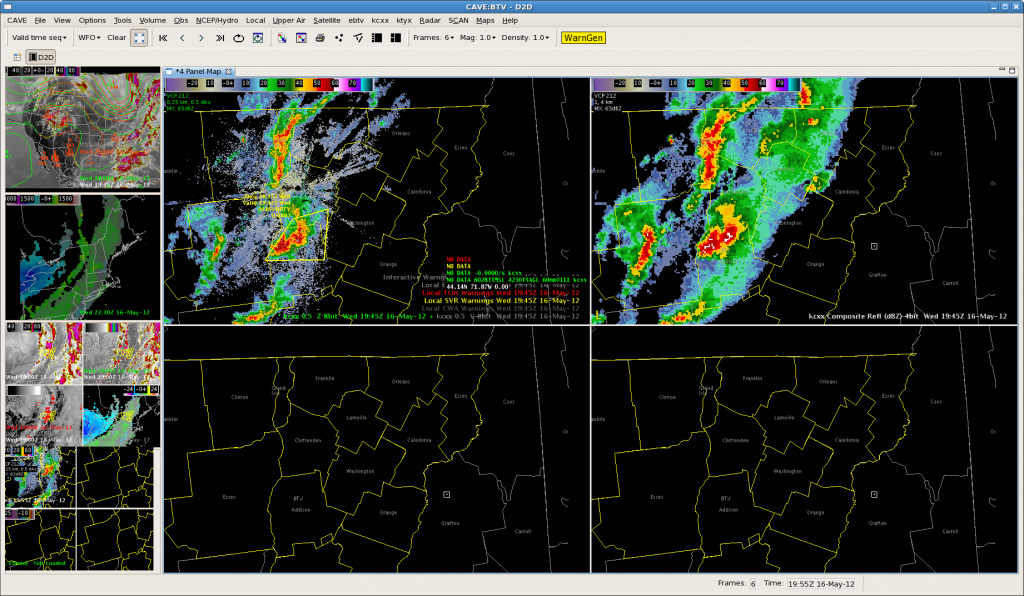
BTV: CI products still useful
After the convection developed rapidly, the CI and CTC products became masked due to the TS plumes. However, the convection at the north end of the CWA may have kicked out an outflow bndry to cause more development in clear air. This was picked up by the CI product with an increasing signal in subsequent frames.
A stronger (yellow) signal was evident on the next frame.
The resulting composite reflectivity (upper right image), showing development to 45dbz 15 minutes later. Comp reflectivity was used here due to beam blockage at 0.5 degrees.
Monitoring More ALY-area Storms
Two more storms in extreme northern Saratoga County, NY are being monitored for warnings (update: an SVR was just issued for the northern storm). 3DVAR has shown the same signals as the Herkimer County storm with strong storm-top divergence:
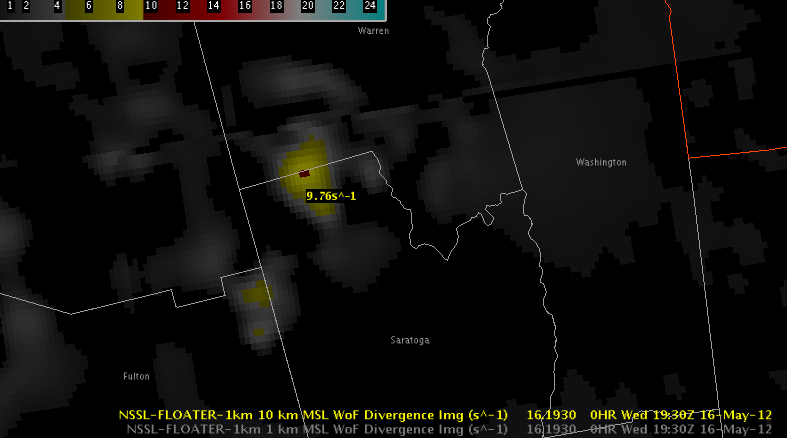
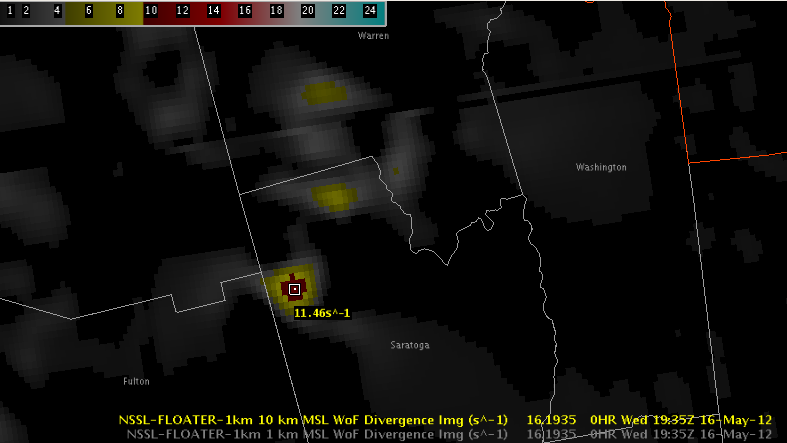
MESH was peaking just under 1″ with near-50% POSH. (Update: it has increased above 1″ and POSH is above 50% now, prompting the warning.)
The UW CTC was also strongly negative in eastern Hamilton County at 1925 UTC, indicating a CTC of less than -30 C/15 min, so northern Warren County will need to be monitored.
CI Algorithms over Iowa
While thunderstorms have not been as impressive over Iowa, Illinois, and Wisconsin, the UAH convective initiation and UW cloud-top cooling algorithms have been increasingly active over the last hour. To track their effectiveness compared to radar, I overlaid the MRMS merged reflectivity at lowest altitude product with the UAH CI and UW CTC all on the same image (something that wasn’t available with AWIPS 1). There was an interesting evolution with the UAH CI starting with the 2132 UTC satellite image, when it flagged an area of CI near West Amana, IA (south of Blairstown) with a 28 on the new Strength of Signal scale.
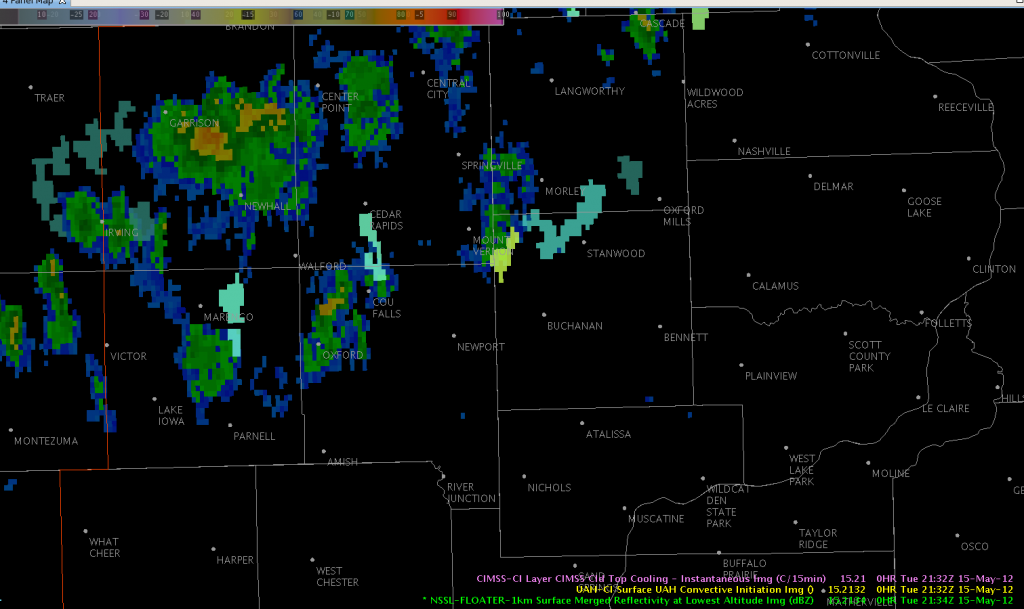
By 2144 UTC, a 20 dBZ shower had developed with that CI object. By 2200 UTC, CI was up to 44, and the radar reflectivity was up to 48 dBZ.
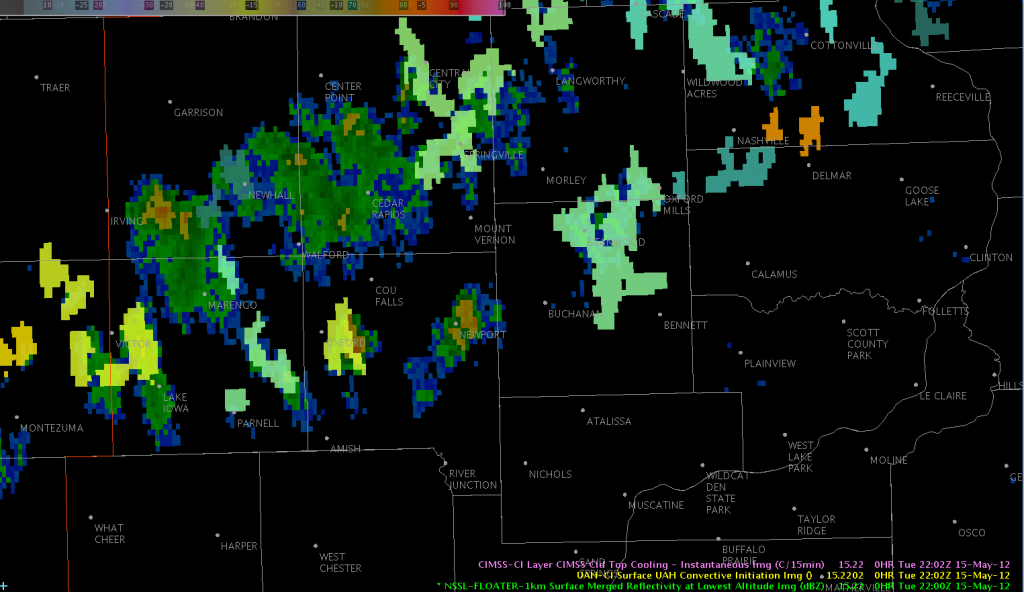
Shortly thereafter it maxed out at 63 CI SOS; the cell’s reflectivity maxed out between 2226-2234 UTC at 52 dBZ.
A neighboring storm near Lake Iowa triggered both the UAH (74) and UW (-13 C/15 min) algorithms; it too maxed out around 50 dBZ but was shorter-lived.
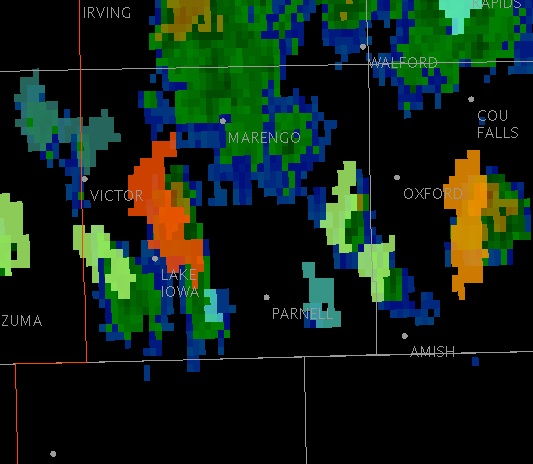
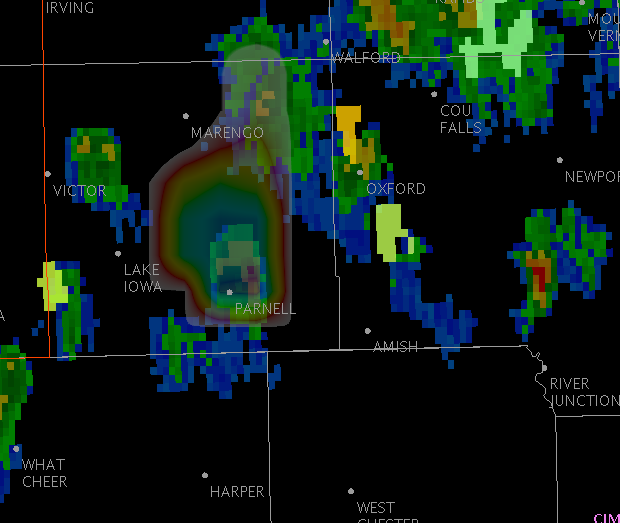
Viewing the CI and CTC data simultaneously with radar imagery allows forecasters to make direct comparisons to their most frequently-used warning tool.


