MCS over far SW Texas: synthetic vs real IR

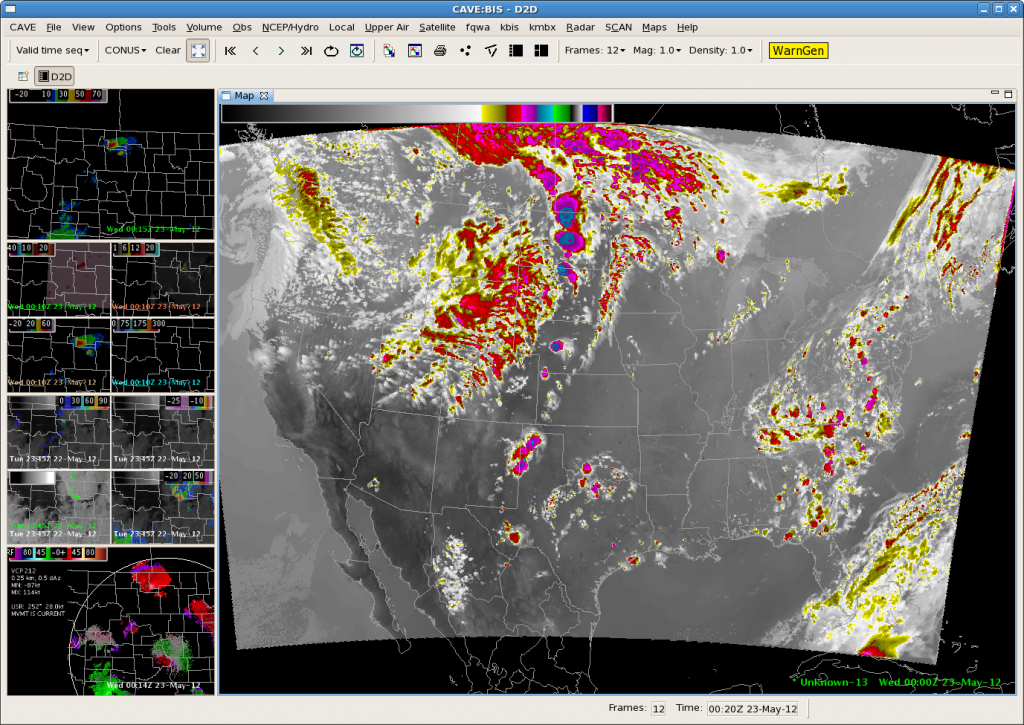
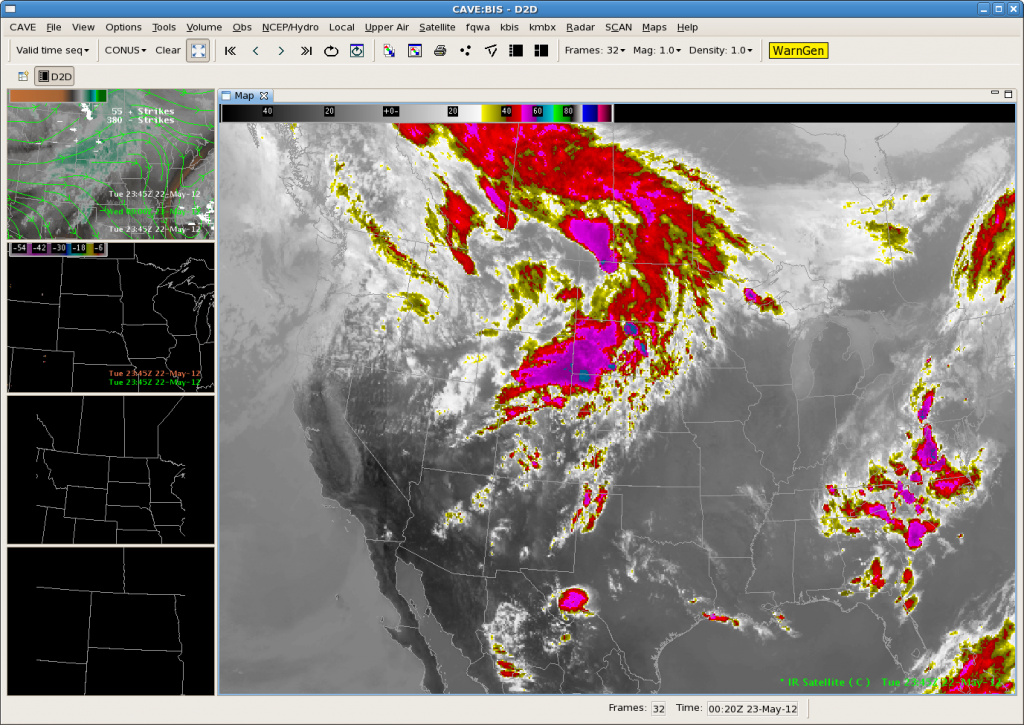
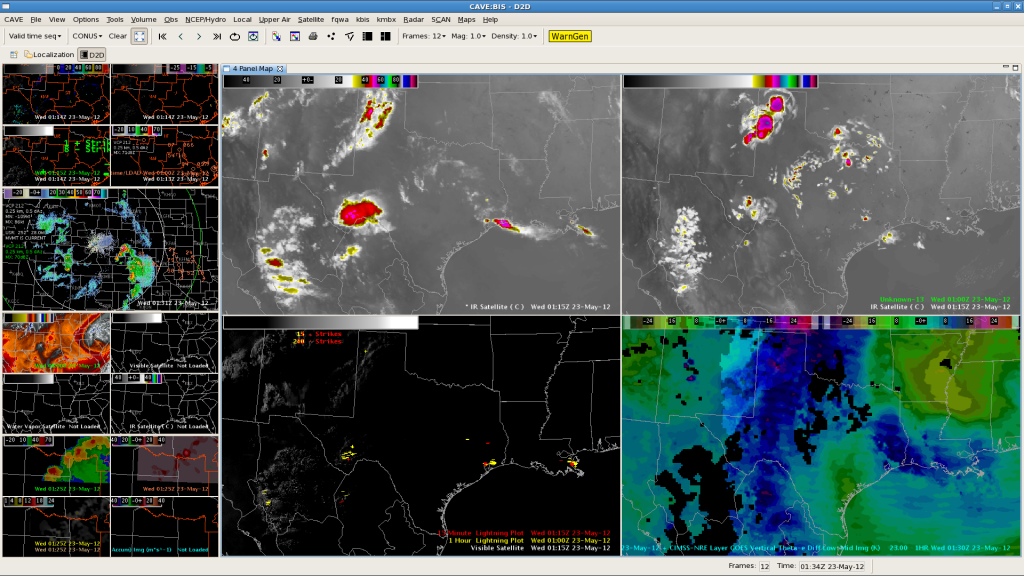
As described in this blog a few hours ago, storms developed S of Pecos due to ongoing diabatic heating in an environment modestly supportive for strong/isolated severe pulsating storms. Thunderstorms rapidly grouped in a loosley organized convective cluster, which gradually approached the NM boarder during the following hours. At 2300 Z, both IR showed the peak of activity/organization of that cluster with a constant weakening trend thereafter. However, the synthetic one caused a rapid decay of that cluster until 0100Z, whereas real time IR data still indicated a large cluster with cloud top temperatures of below -50 degree celsius at that time. Also, lightning activity was still present at 0100Z with that cluster although a rapid decline was also noticed until 0130 Z. So peak strength was captured well with a too fast decline of the cluster’s strength thereafter.

The synthetic IR did also an outstanding job in highlighting the area of initiation (both timing and the region…not shown).

Helge

The beat GOES on

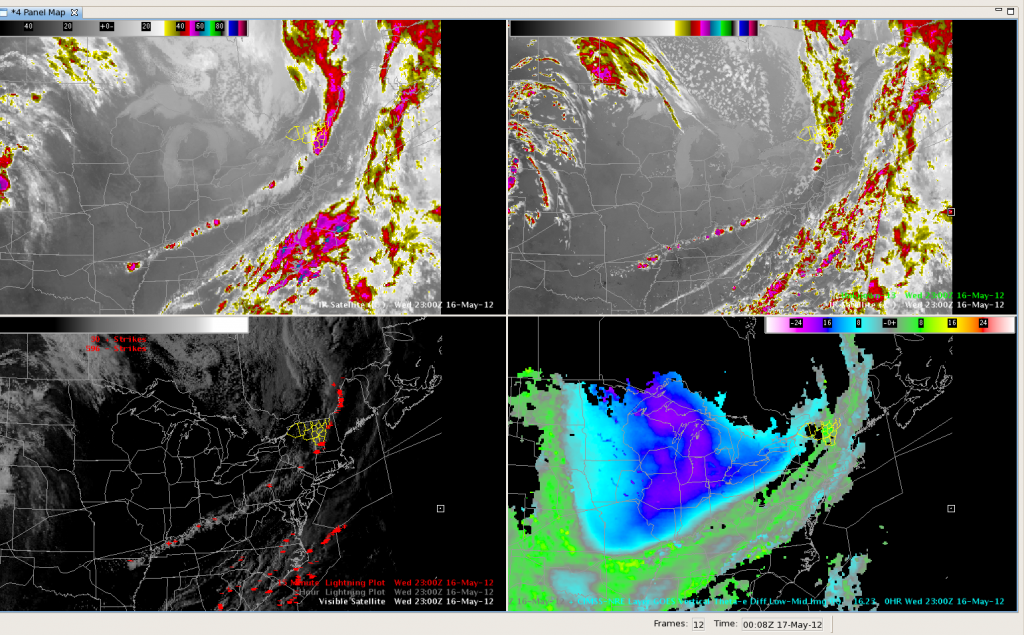
The synthetic imagery did a nice job of placing convection southward along the cold front through the Ohio and Lower Mississippi Valleys.  Here’s a screen capture from 2300UTC, with the actual IR on the upper left and the model forecast on the upper right.  Visible imagery with lightning is shown in the lower left pane, with the theta-e Nearcast product on the lower right.  All in all, the GOES products did well today depicting where convection would be in relation to the cold front.  This would be an excellent application to the CWSU environment for air traffic planning purposes.

Quick Glance at SimuSat for Today’s Convection

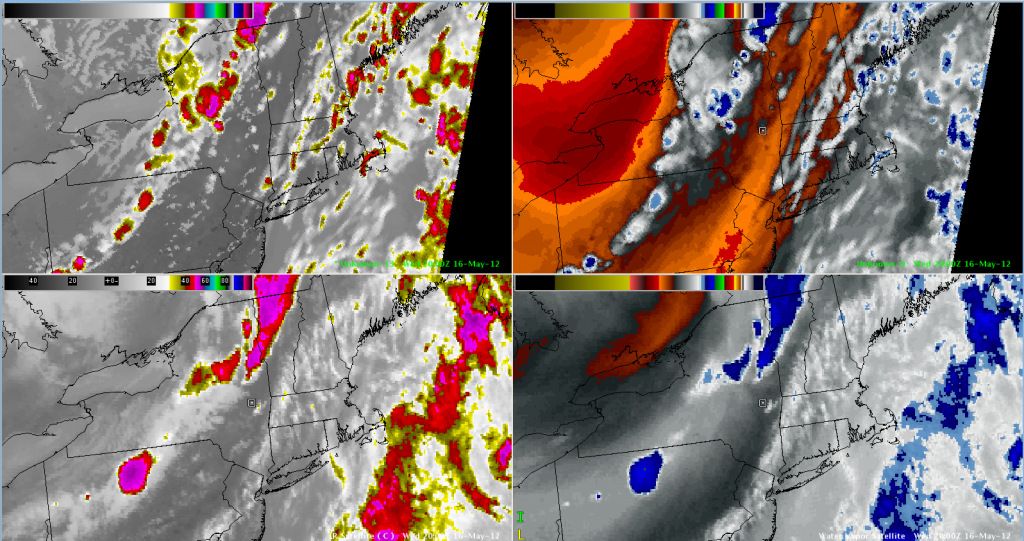
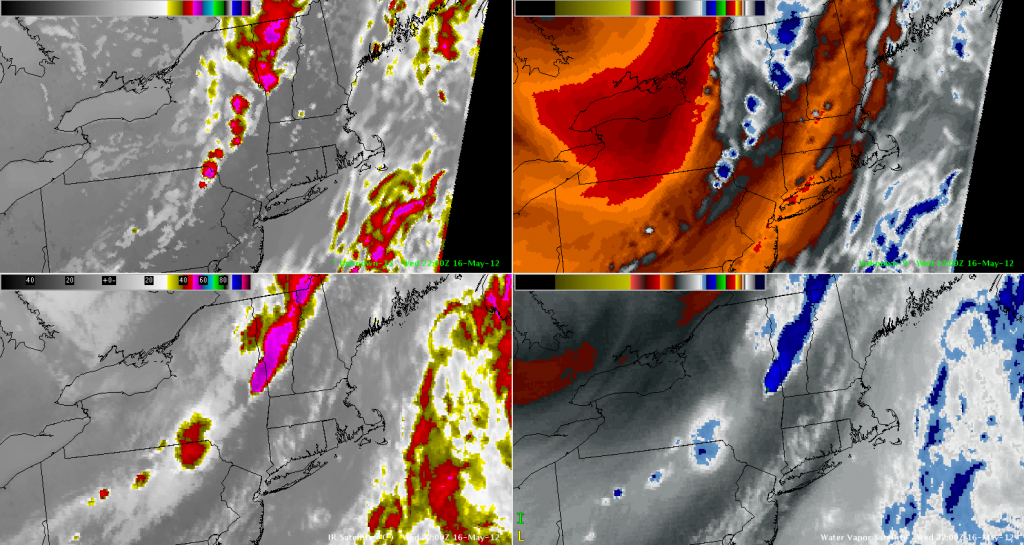
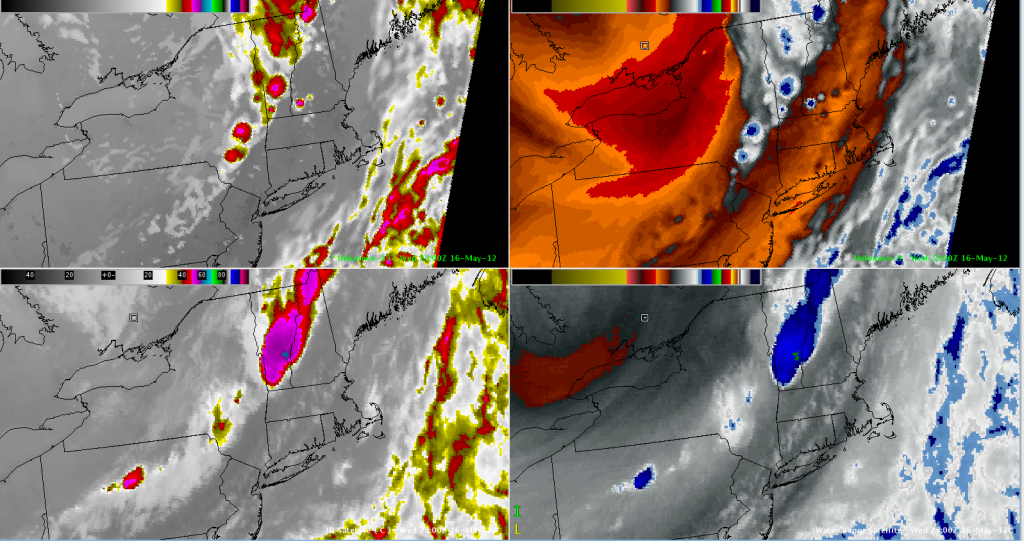
Severe thunderstorms kept the WFO ALY team busy today!  With storms in our area diminishing (and moving out), I wanted to check out the CIRA/CIMSS Simulated Satellite Imagery from the NSSL-WRF to see how it compared to the last few hours.  Overall, I’d say quite well, aside from some placement issues, and the extent of the coldest cloud tops (which was to be anticipated).

CIRA/CIMSS Simulated WRF Satellite Imagery (IR Left/WV Right) - Valid 2012-05-16 2000 UTC
CIRA/CIMSS Simulated WRF Satellite Imagery (IR Left/WV Right) - Valid 2012-05-16 2200 UTC
CIRA/CIMSS Simulated WRF Satellite Imagery (IR Left/WV Right) - Valid 2012-05-16 2300 UTC

Monitoring & Forecasting DVN Convection

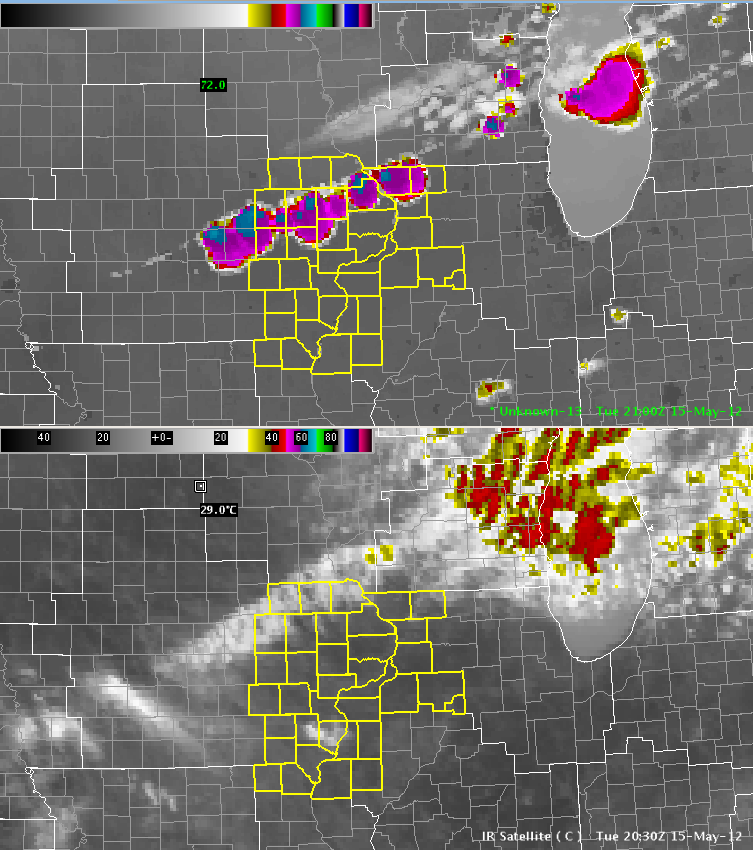
Despite strong indications from the NSSL-WRF SimuSat imagery, convection in the DVN CWA has stayed rather benign.  The NSSL-WRF appears to have overestimated the low-level prefrontal moisture.

SimuSat Imagery at Top, IR Imagery at Bottom, valid 2100 UTC 2012-05-15

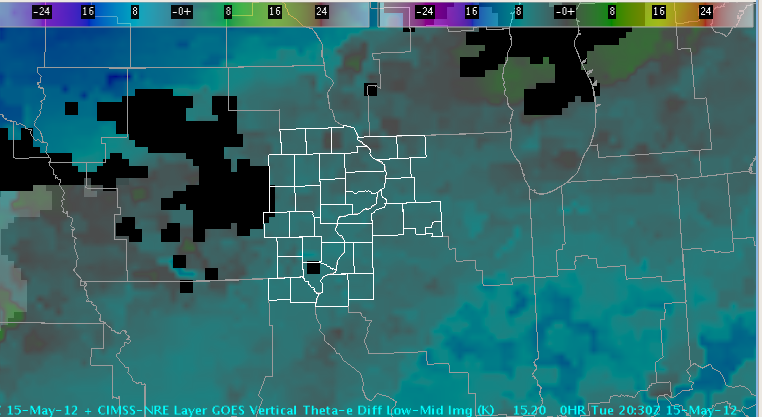
The GOES-R NearCast Theta-E Low vs. Mid-Level Theta-E image indicates very little destabilization ahead of the front (in fact, it actually indicates increased stability).  This is consistent with surface dewpoints in the 30s and 40s reported ahead of the front.

GOES-R NearCast valid 2030 UTC 2012-05-15
GOES-R NearCast Theta-E Difference valid 2030 UTC 2012-05-15

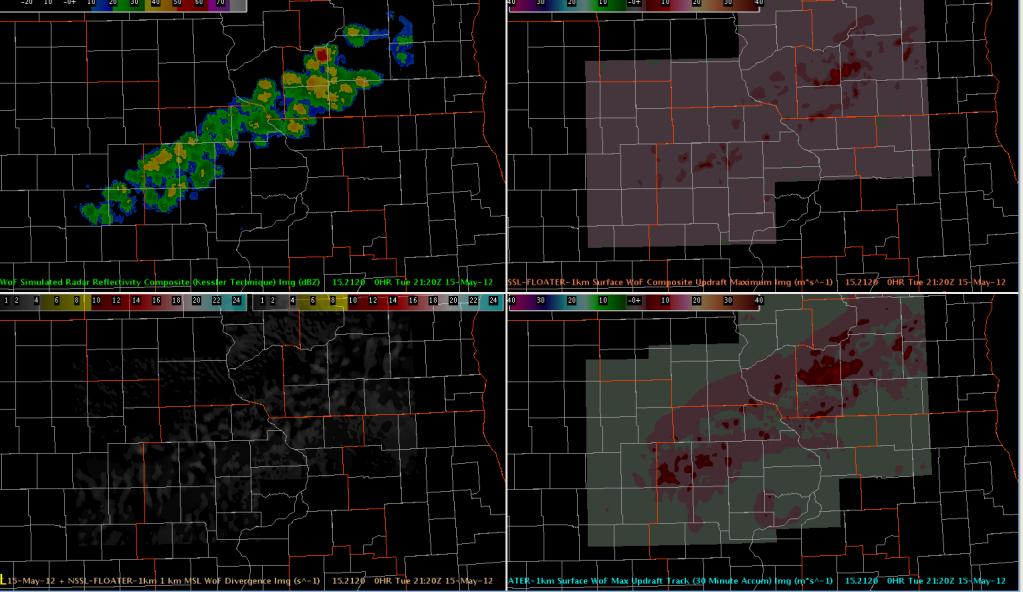
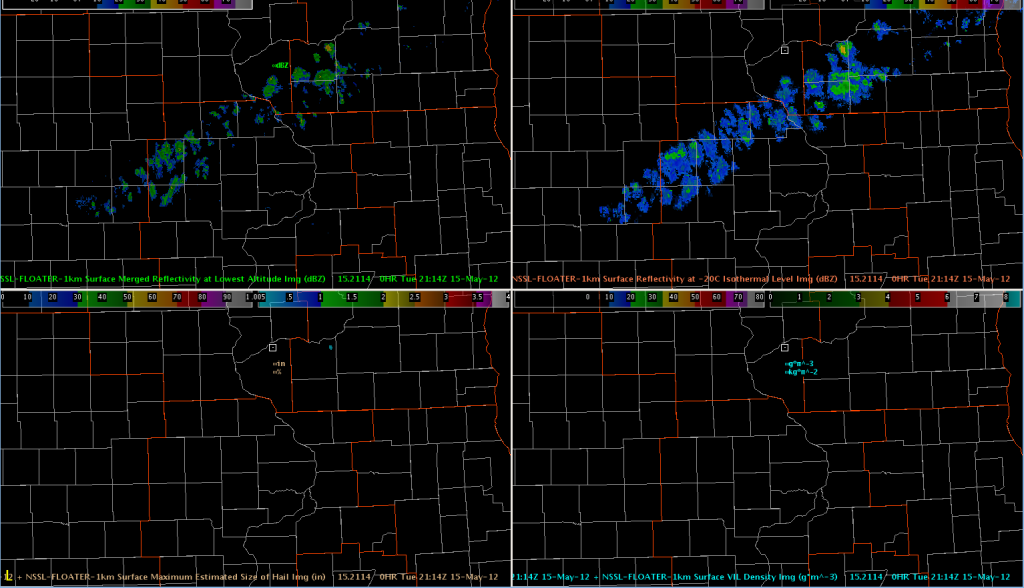
There have been a few cloud-to-ground lightning strikes just to the northeast, and the 3DVAR and MRMS data have helped to monitor the convection across multiple CWAs and on the edges of multiple radars.

3DVAR Analysis valid 2120 UTC 2012-05-15
3DVAR Analysis of Reflectivity, Updraft composite, 30 Minute Updraft Accumulation, and 1km/10km Divergence, valid 2120 UTC 2012-05-15
MRMS Surface Merged Reflectivity, -20C Reflectivity, VIL, and MESH valid 2114 UTC 2012-0515

LWX 20Z

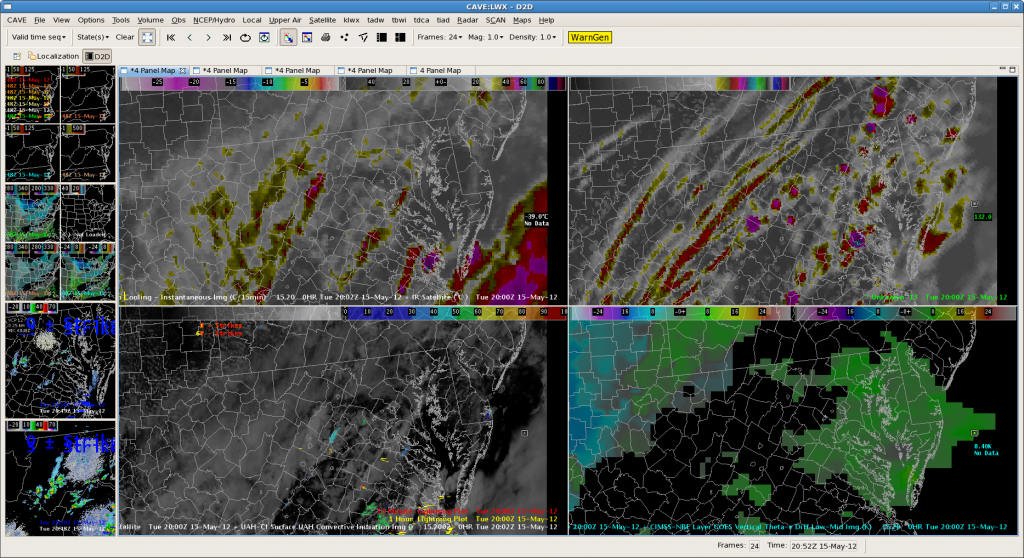
Being LWX today for another rather quiet day. Nearcast products and simulated satellite (and HRRR and 3dVAR) both showed marginal instability and a few air mass sort of thunderstorms and that is what has been happening.  It has let us see a few flashes on the pGLM products but not really enough to evaluate usefulness in warning situation. Image below shows nearcast theta e product in lower right (showing not much) and simulated IR in upper right showing spotty but unimpressive convection.  Left two panels are real IR & Vis sat showing that the simulated stuff not bad.  The CI products seem to be hitting areas that do end up as the small thunderstorms but not sure they are showing more than can be diagnosed by looking at the satellite imagery so not sure if I would warn on this product any more often than the satellite and radar alone but good quick check to make sure I am not missing anywhere I should be watching.

NSSL-WRF SimuSat Prompts Move to DVN

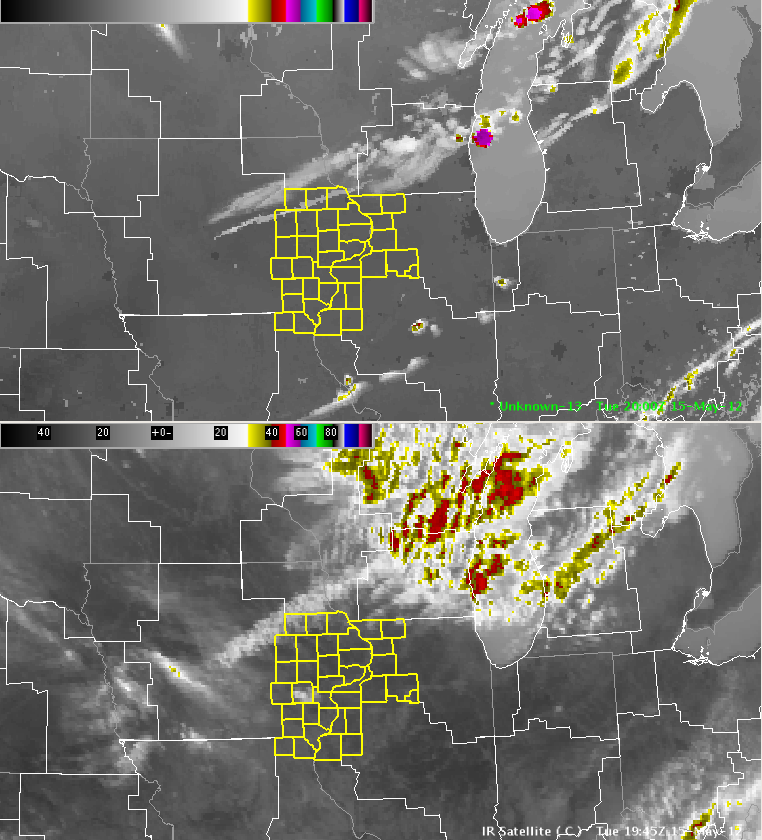
The simulated satellite imagery based off the NSSL WRF is handling a cold frontal passage in the Midwest quite well this afternoon.  The 2000 UTC comparison between the WRF “SimuSat” and observed IR image:

NSSL-WRF Simulated GOES-R IR Satellite (top) vs. Observed IR Satellite (bottom) at 2000 UTC 2012-05-15

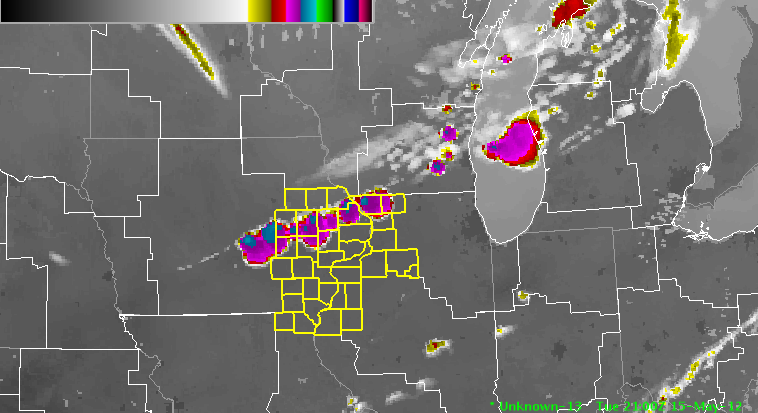
The NSSL-WRF simulated satellite imagery suggests that storms will erupt over the next hour:

NSSL-WRF Simulated GOES-R IR Satellite (top) vs. Observed IR Satellite (bottom) at 2100 UTC 2012-05-15

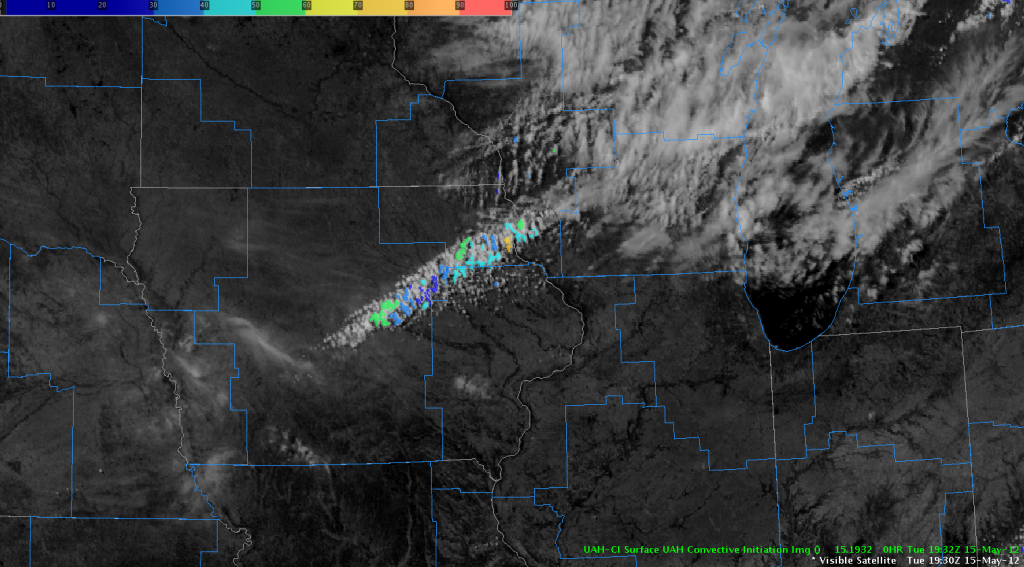
This model output, combined with hits from the UAH Convective Initiation product in the Cu field along the front, has prompted the RNK group to shift domains to DVN for the rest of the afternoon.

Visible Satellite and UAH CI Product, 1932/1930 UTC 2012-05-15

EWX: 2047UTC

Currently watching the IR(actual) vs IR(synthetic).  The synthetic image did a good job indicating where the convection would initiate, but the thunderstorm canopies are underdone.

The CI product indicated it well with a strong red signal.  As of this frame, radar detected a 65dBZ core in this storm (not shown here).  The theta-e diff product earlier indicated high potential for severe storms in this area.

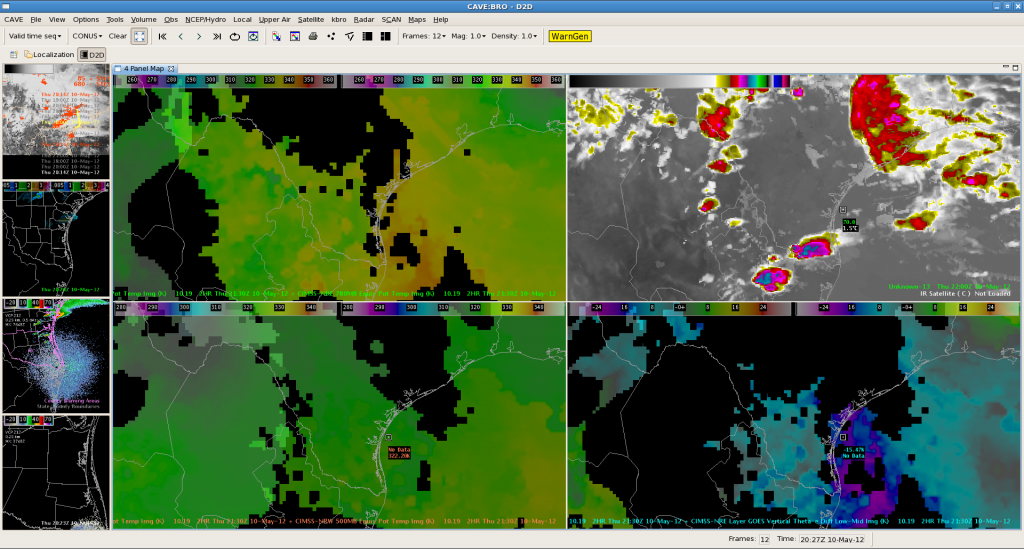
BRO Meso Analysis with Nearcast/Sythetic WRF at 2030Z

The below image at 22Z depicts nearcast theta-e at 780 mb in the upper left pane, synthetic WRF IR in the upper right, nearcast theta-e at 500 mb in the lower left, and nearcast vertical theta-e difference low-mid in the bottom right.

Looking at the 780 mb theta-e, it shows areas in yellow of best moisture/instability predicted for this afternoon which matches up with storms predict in synthetic IR imagery.  Because the 2 products derived off of different model projections are in decent agreement, this lends more confidence to this convective scenario for this afternoon.

AMS/Nunez