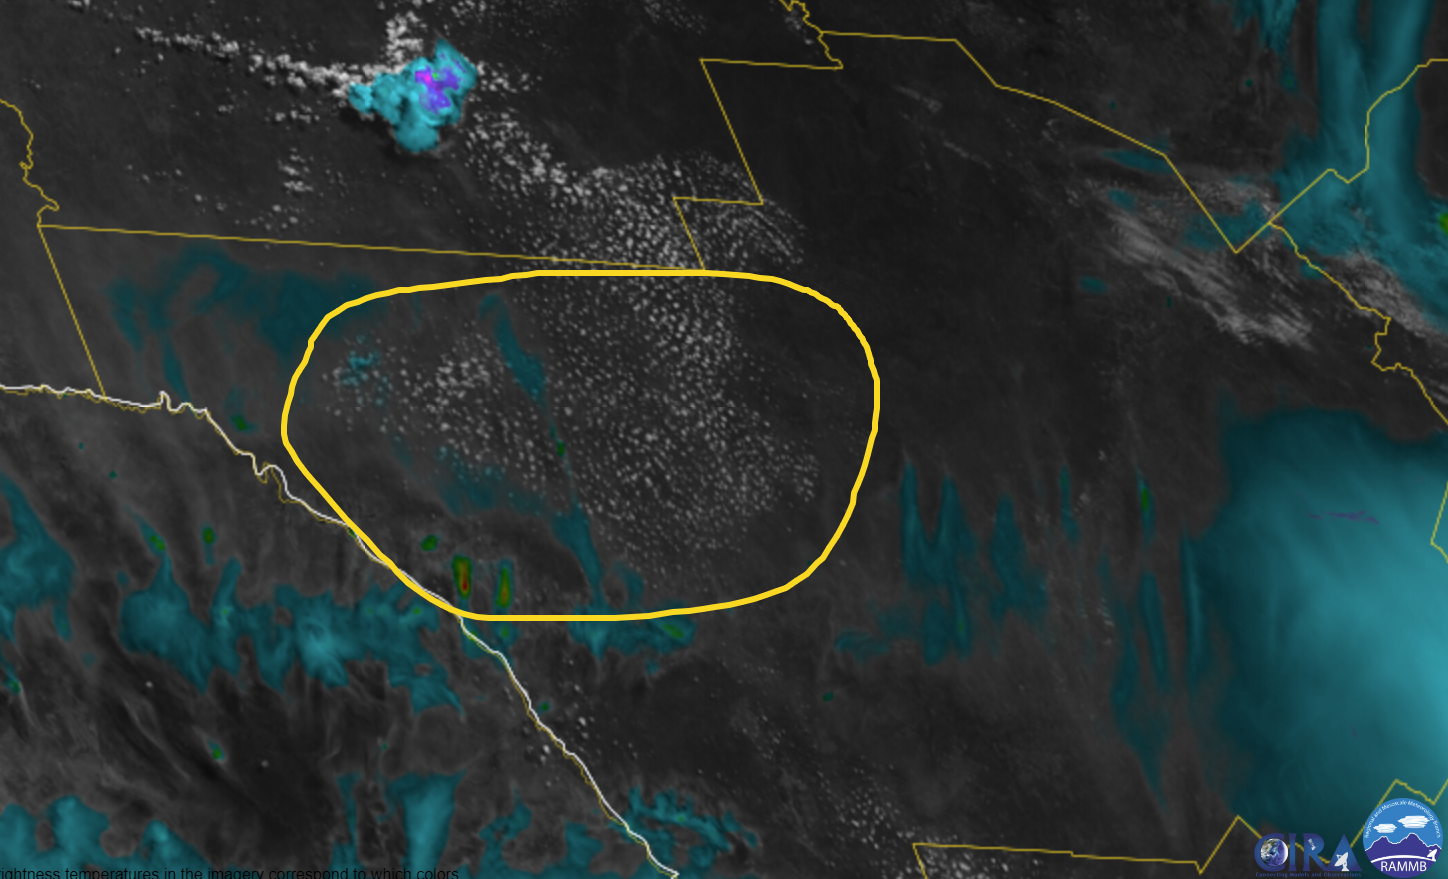
This case at WFO OUN brought forth a challenging situation monitoring developing severe weather with no available radar data, and only relying on satellite products for storm interrogation and convective warning decisions. This analysis will primarily focus on the evolution of early convective development and how satellite products/PSH data helped gain a better understanding of the environment.
My role in the team monitoring/analyzing the environment was focused on issuing warnings and having the Mesoanalyst(s) relay satellite, PSH and GREMLIN information to support warning decisions. To prepare and gather a greater situational awareness of the environment and what satellite was observing, I loaded in RAP13 Right/Left Bunkers vectors which would aid me in effective polygon design. Given the orientation of the hodograph per observed soundings earlier, storms would support the potential for left/right splitters meaning proper storm motion/polygon flare is very important.
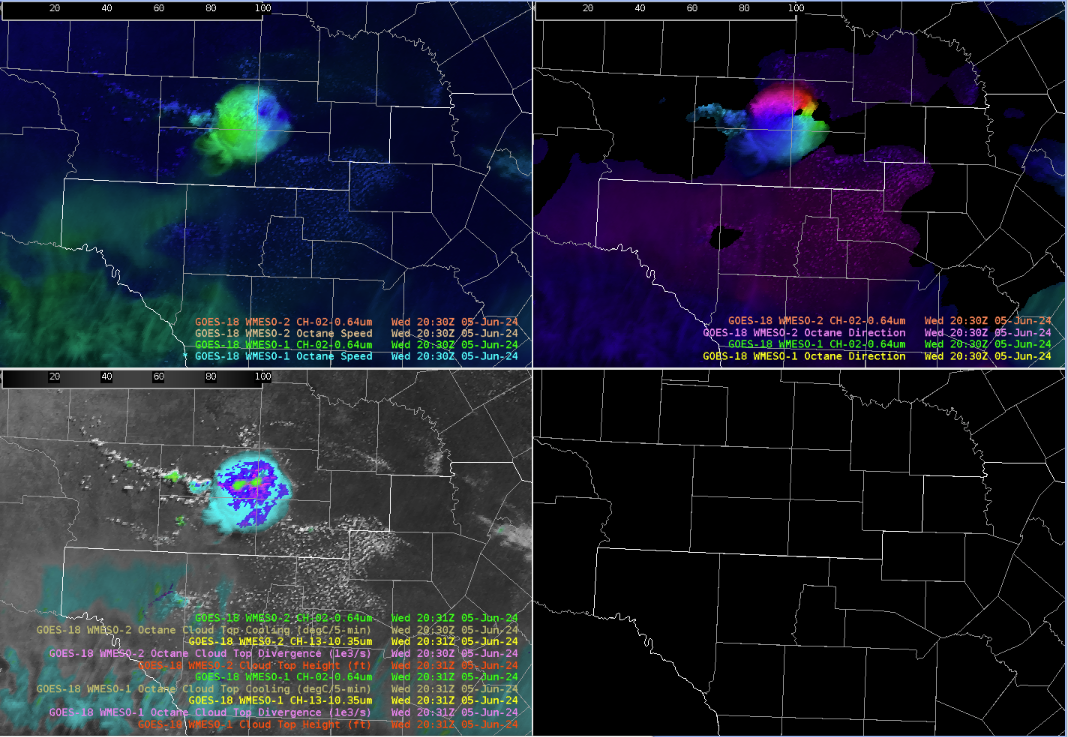
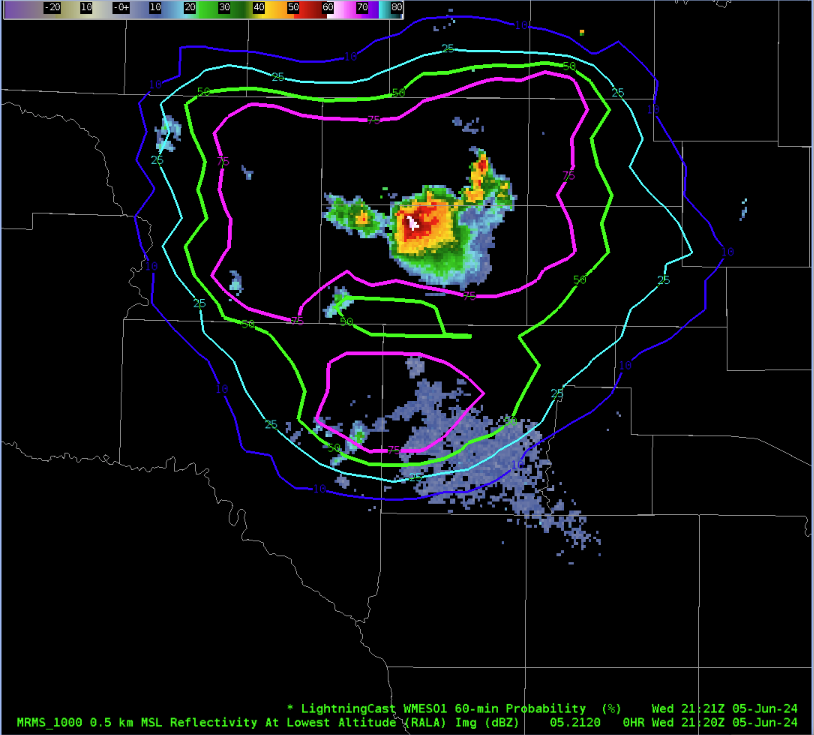
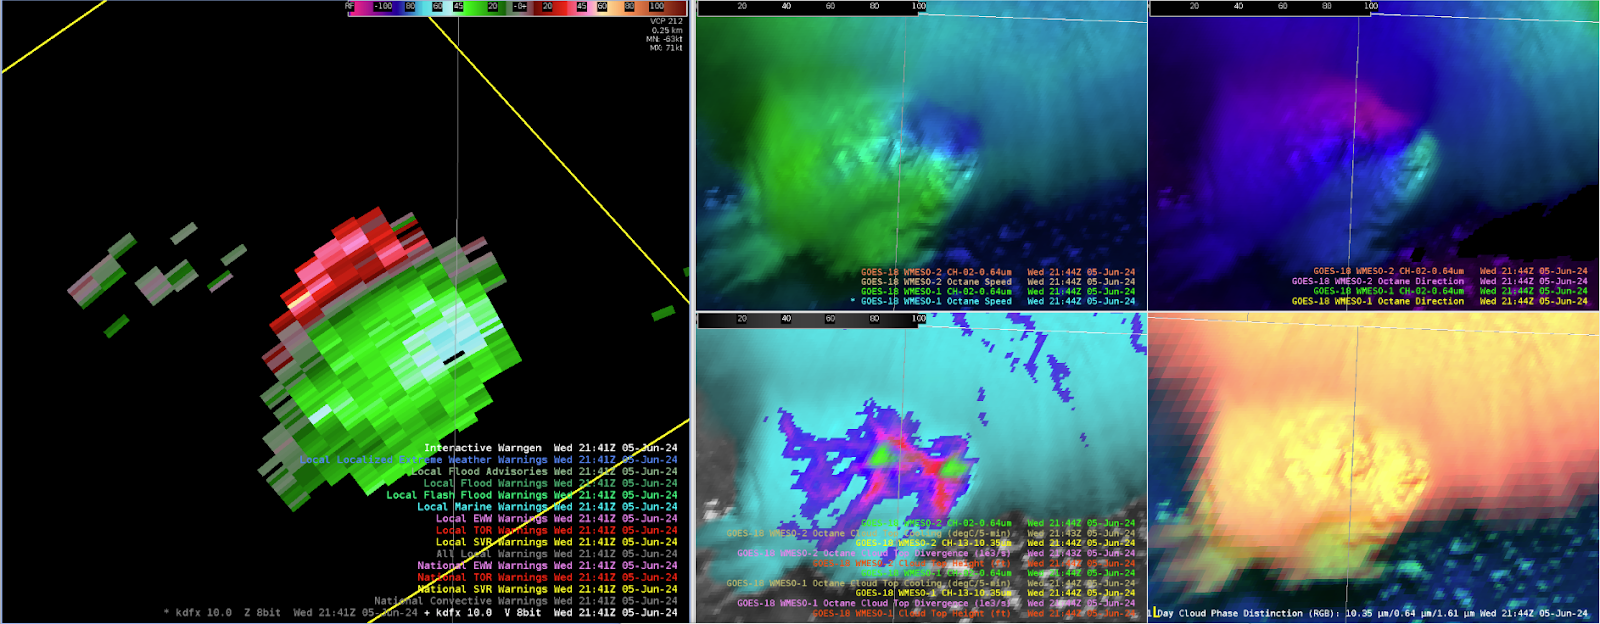
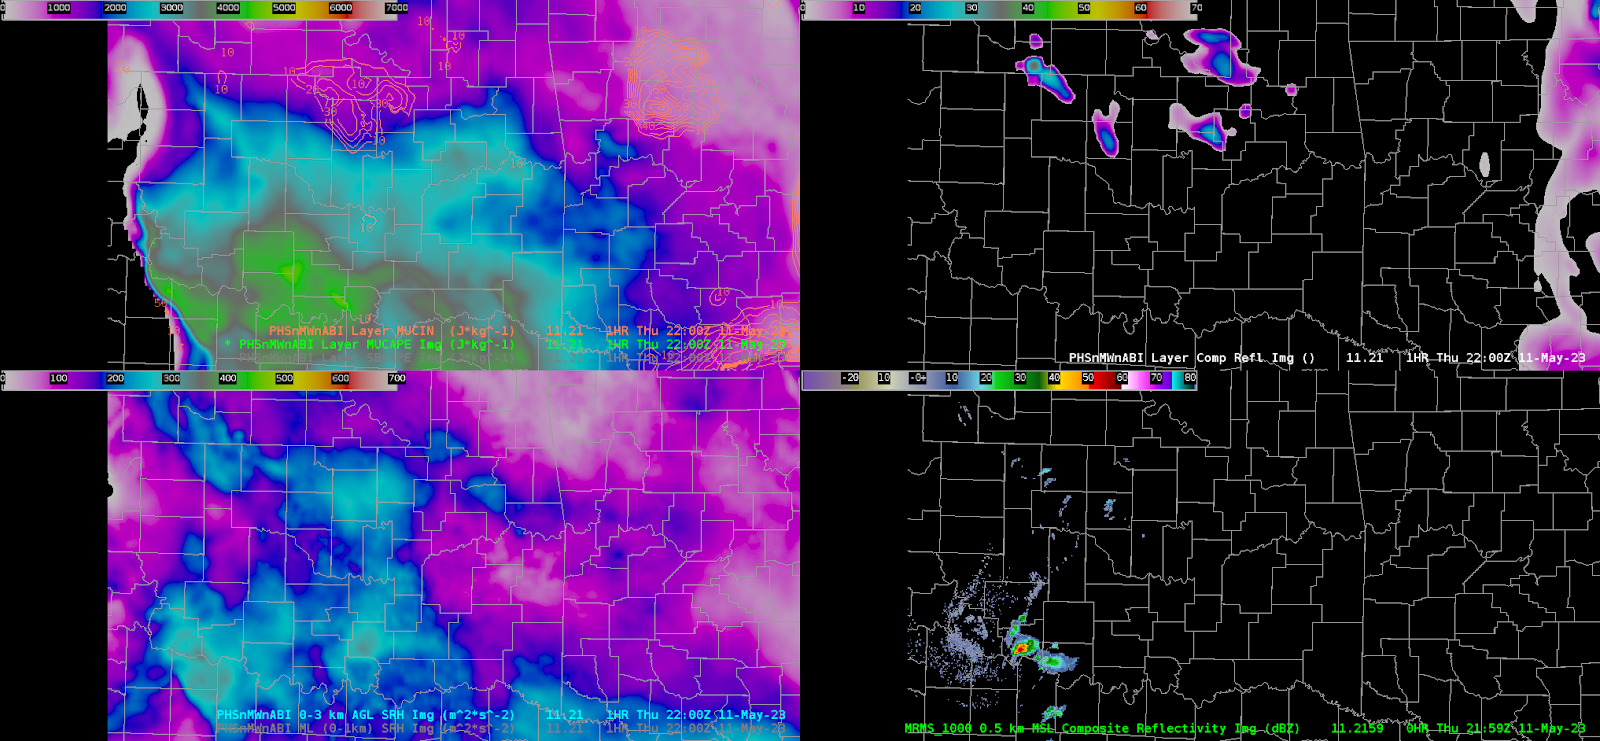
Convective initiation began around 21-22Z with noticeable towering Cu across Cotton County, OK, prompting the first issuance of a SVR at 21:56Z given cooling cloud tops/increasing storm top divergence.
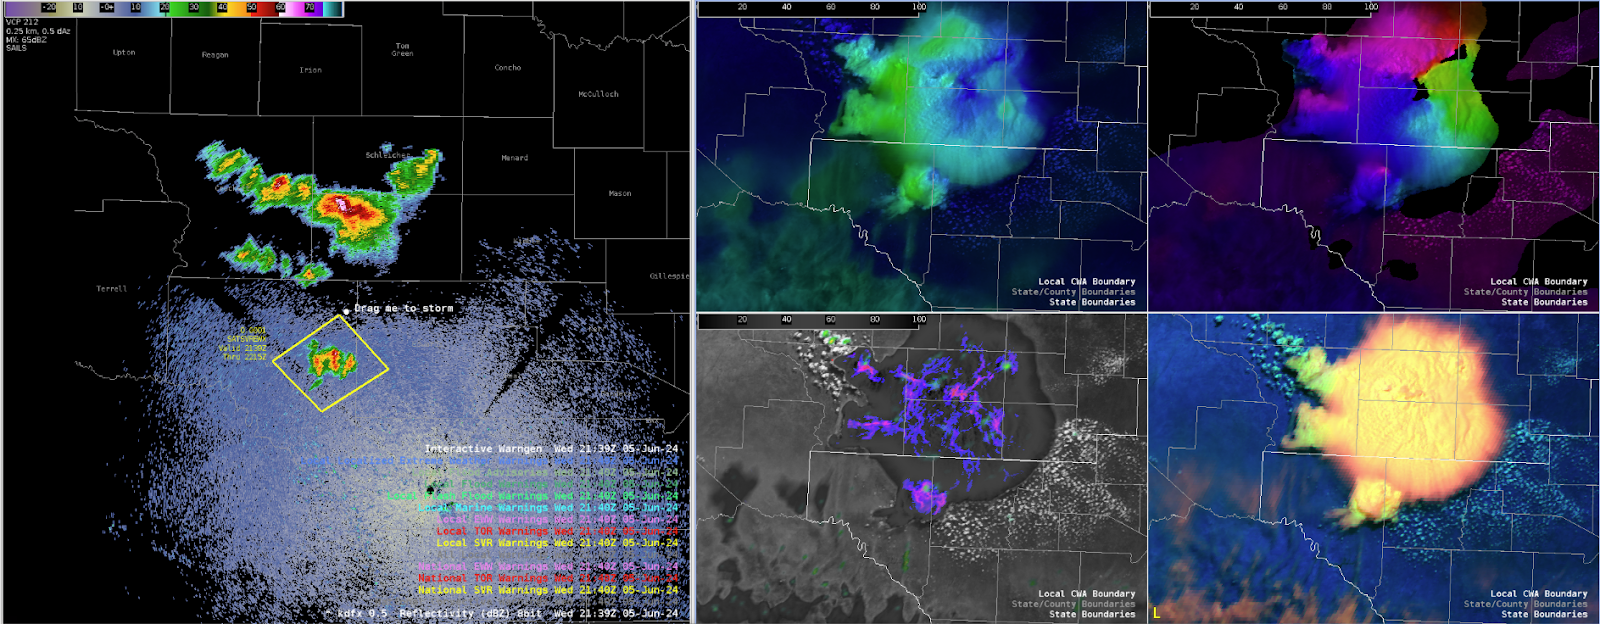
Towards the end of the loop above, observation was made that the overshooting tops were turning more ENE biasing closer to the bunkers right, implying the likelihood of the storm developing a mesocyclone. Not shown here, but a useful trick of enhancing the contrast of the Day Cloud Phase RGB became extremely useful in tracking overshooting top motion and intensity, along with other satellite products diagnosing an intense updraft in progress.
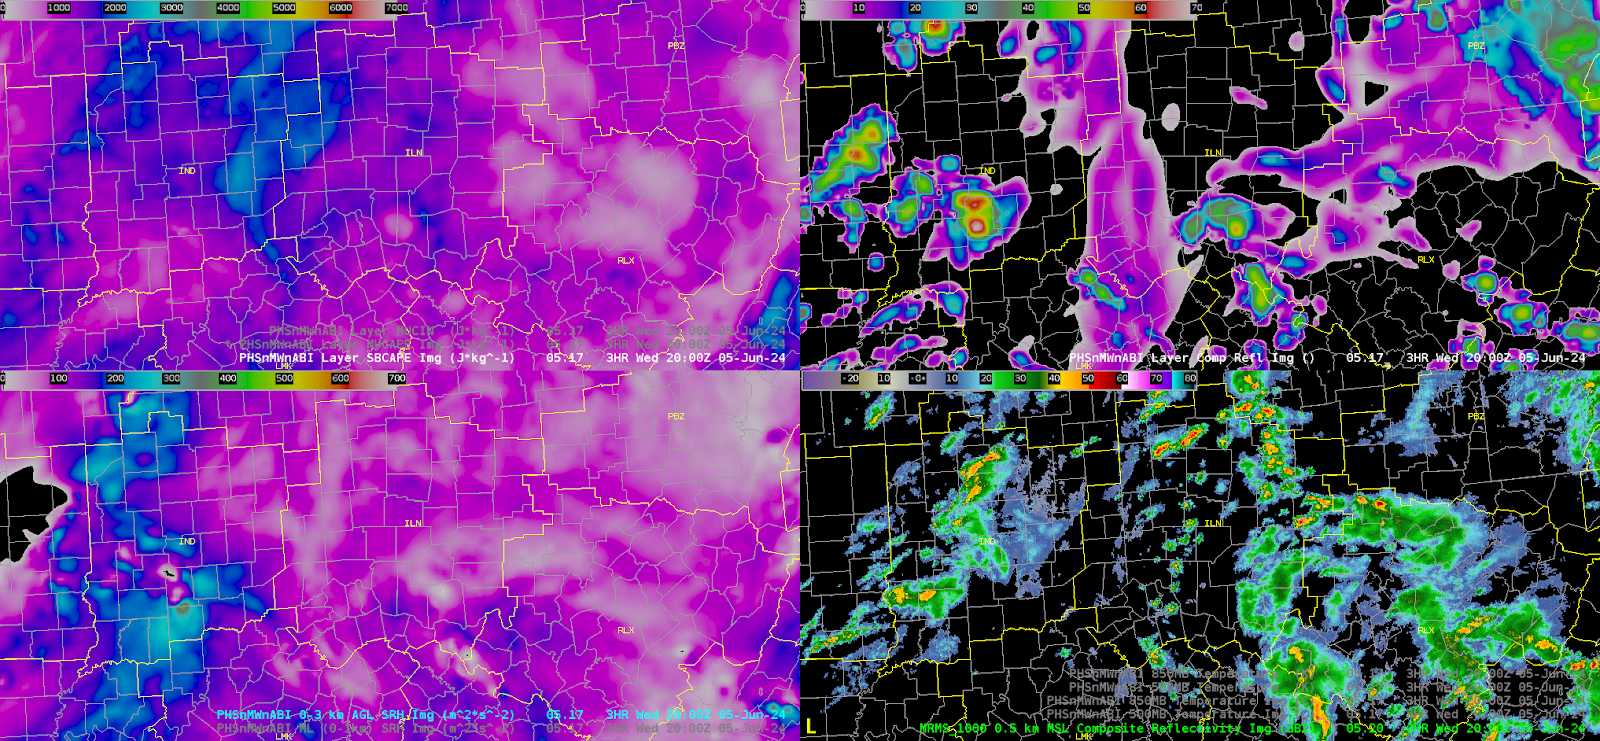
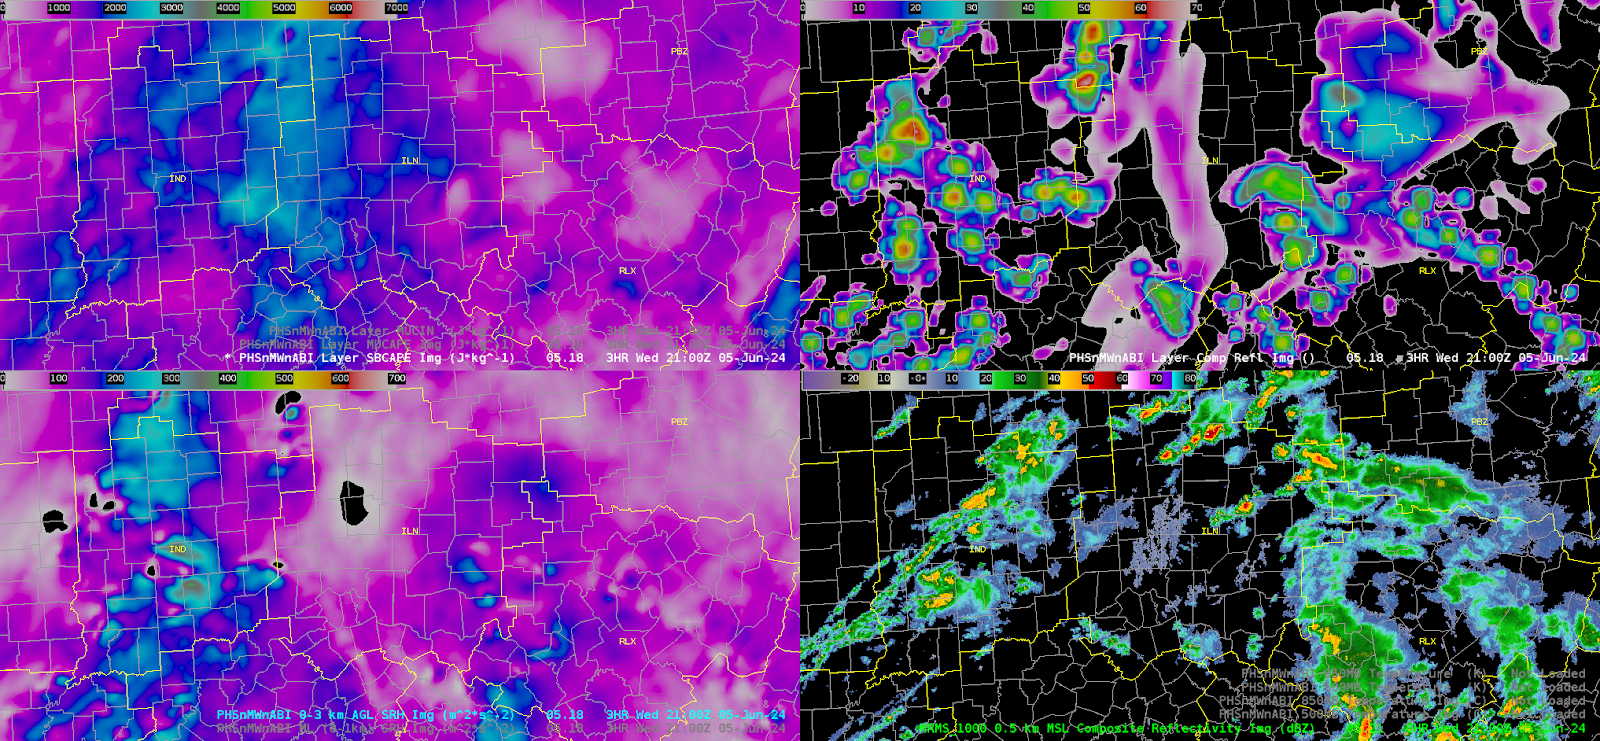
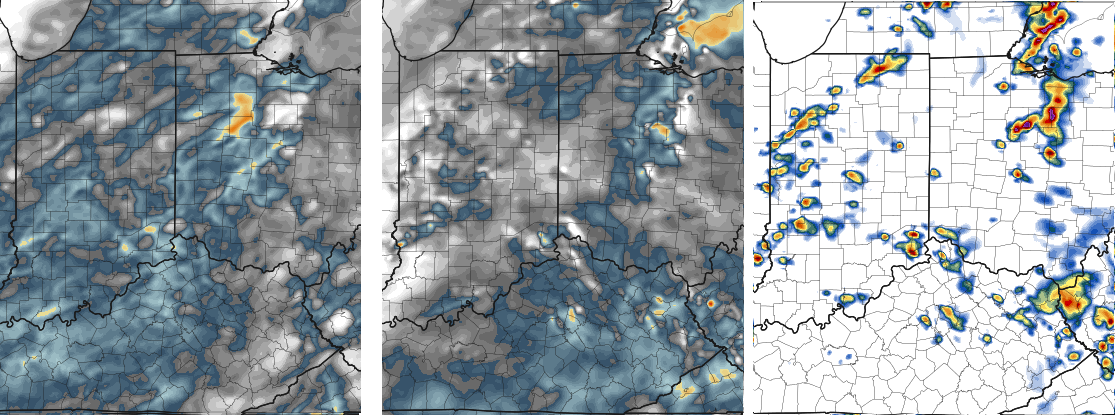
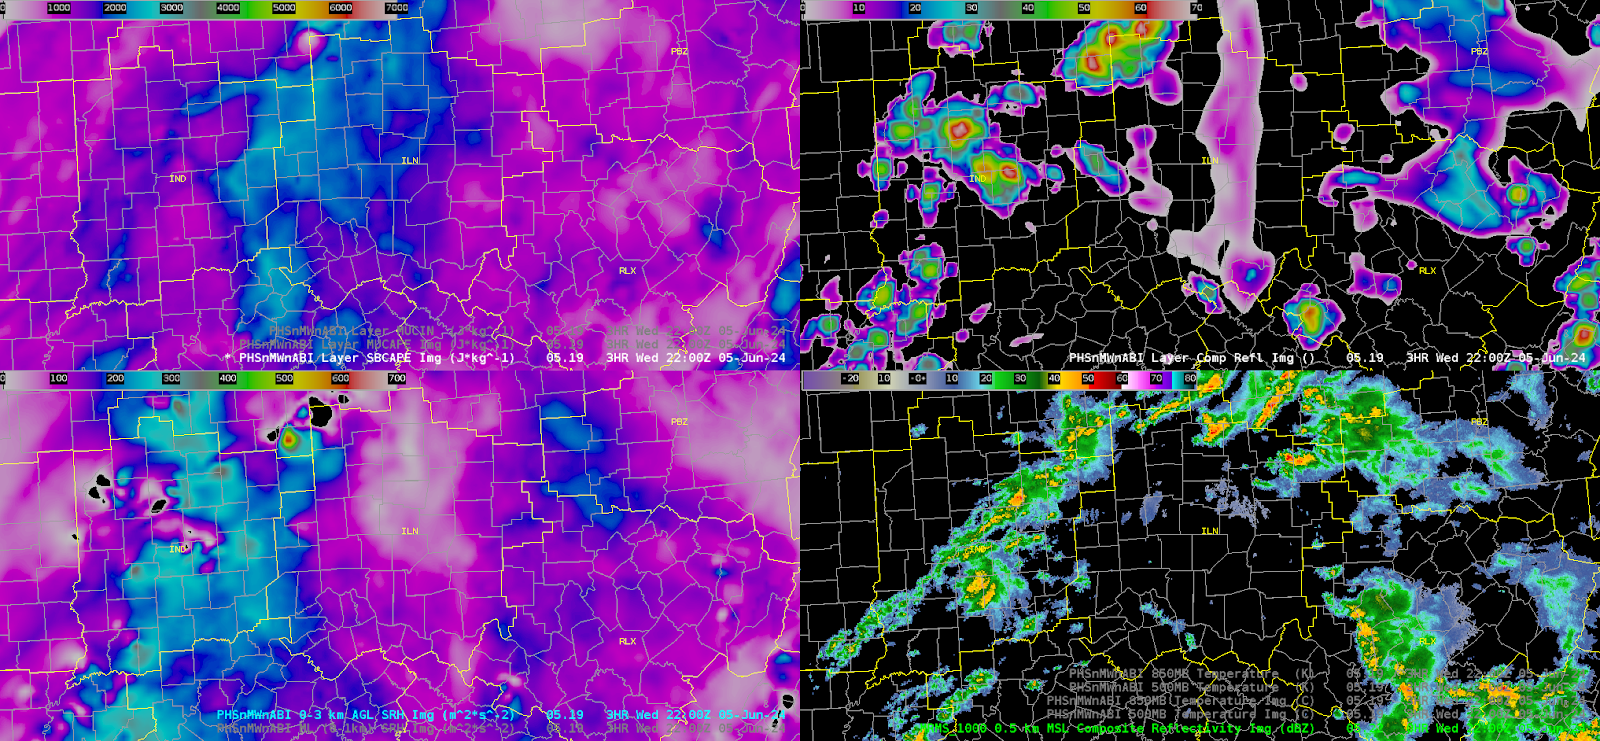
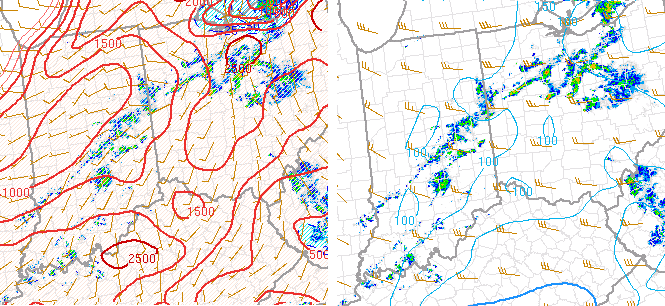
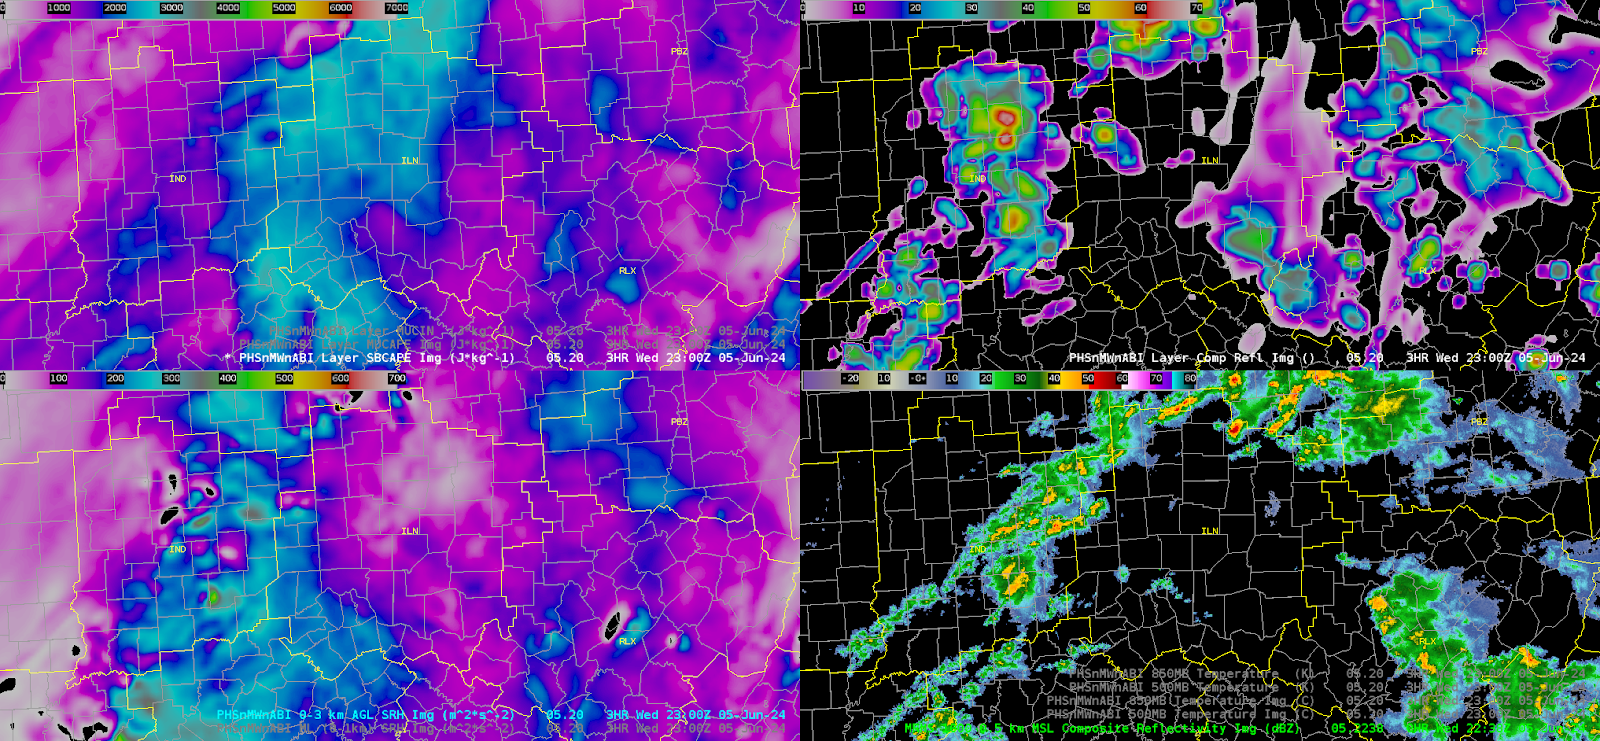
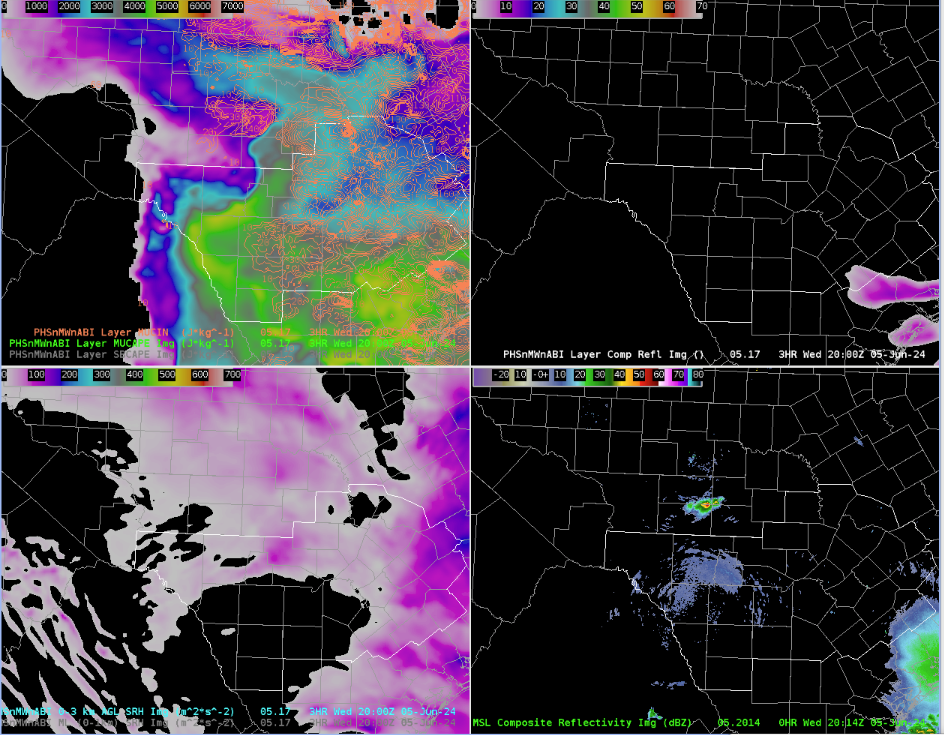
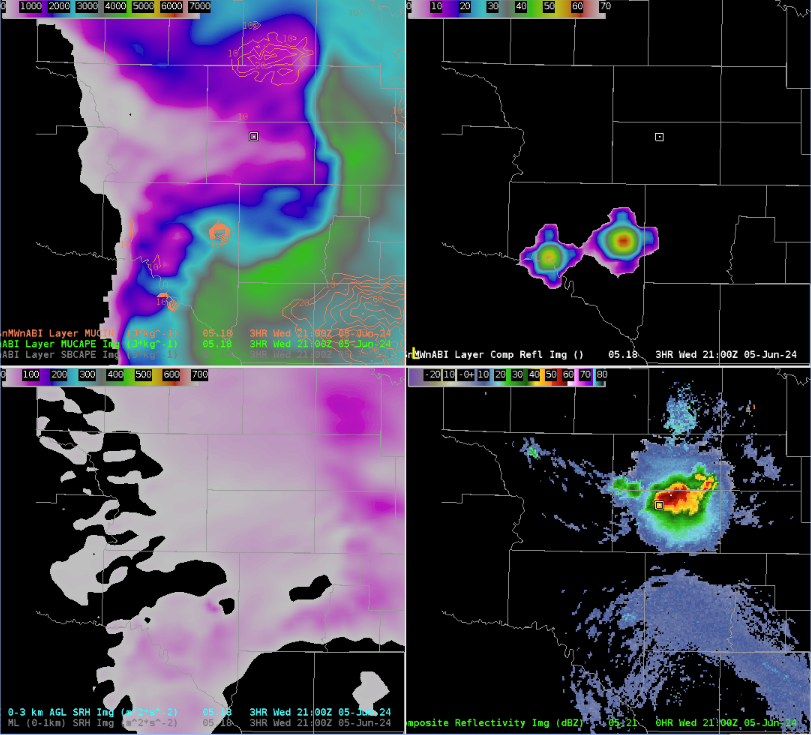
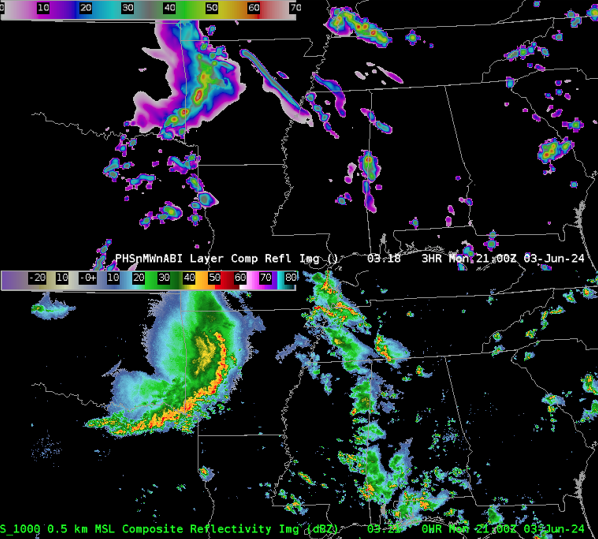
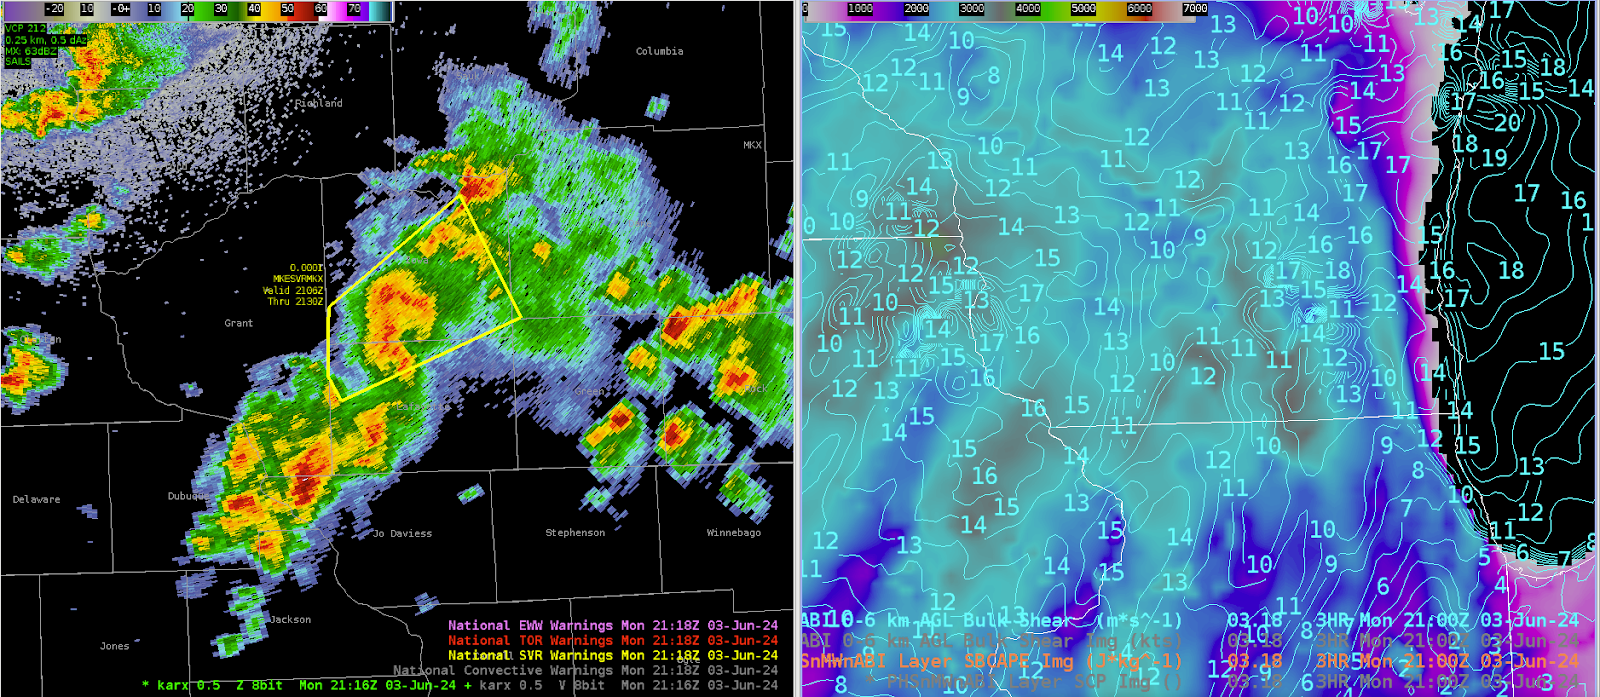
The pre-storm environment was analyzed using PHS data, highlight ample MUCAPE on the order of 3500-4500J/kg around the area of CI, and large-scale 0-3km SRH ranging around 250-350m2/s2, bringing support for stronger/severe storms to attain rotation in a volatile, highly unstable/moderately sheared environment.
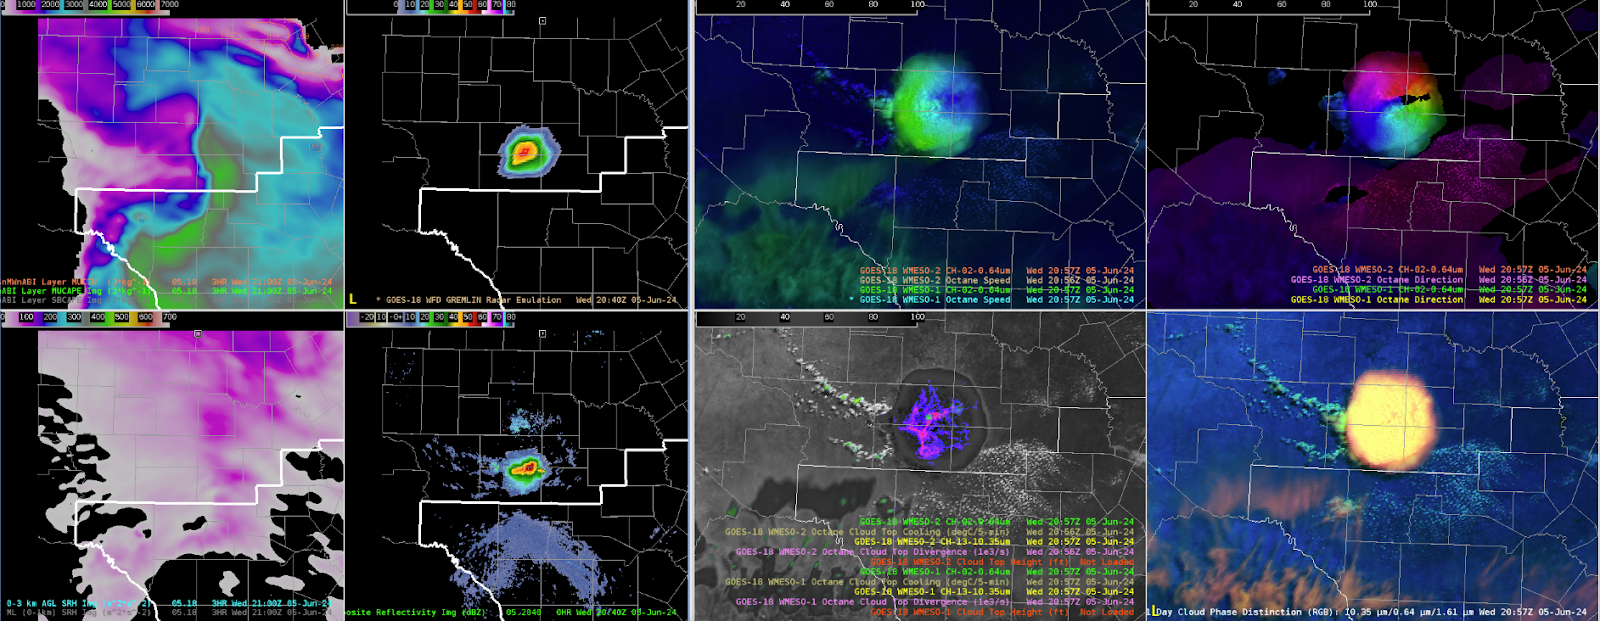
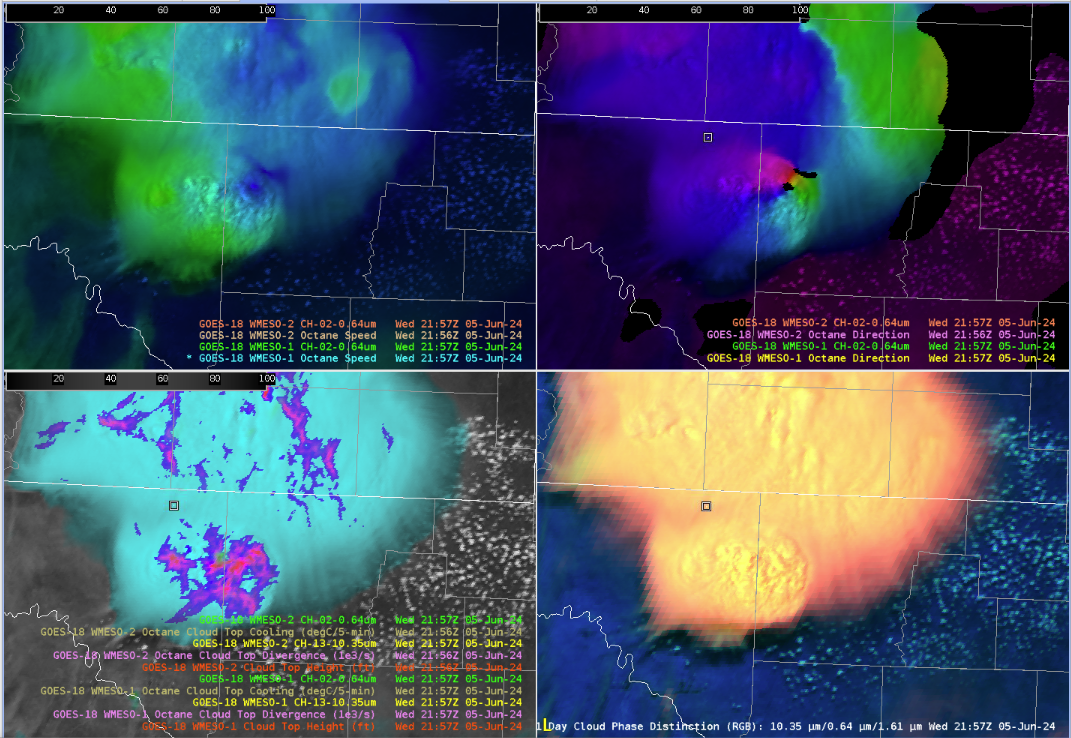
WIth the storm obtaining a developing/intensifying left splitting updraft (later in the first loop), confidence of a strengthening mid-level mesocyclone increased leading to a transition to a base TOR warning, with polygon design mainly following the bunkers right motion vector to imply near-term motion to continue ENE.
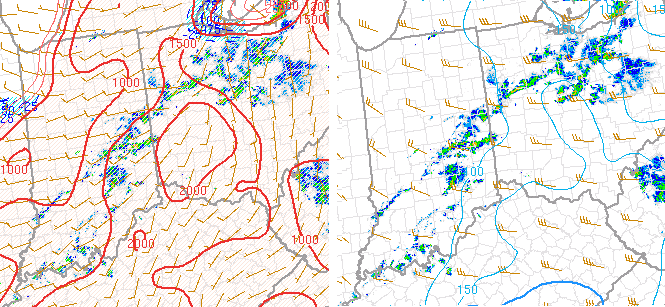
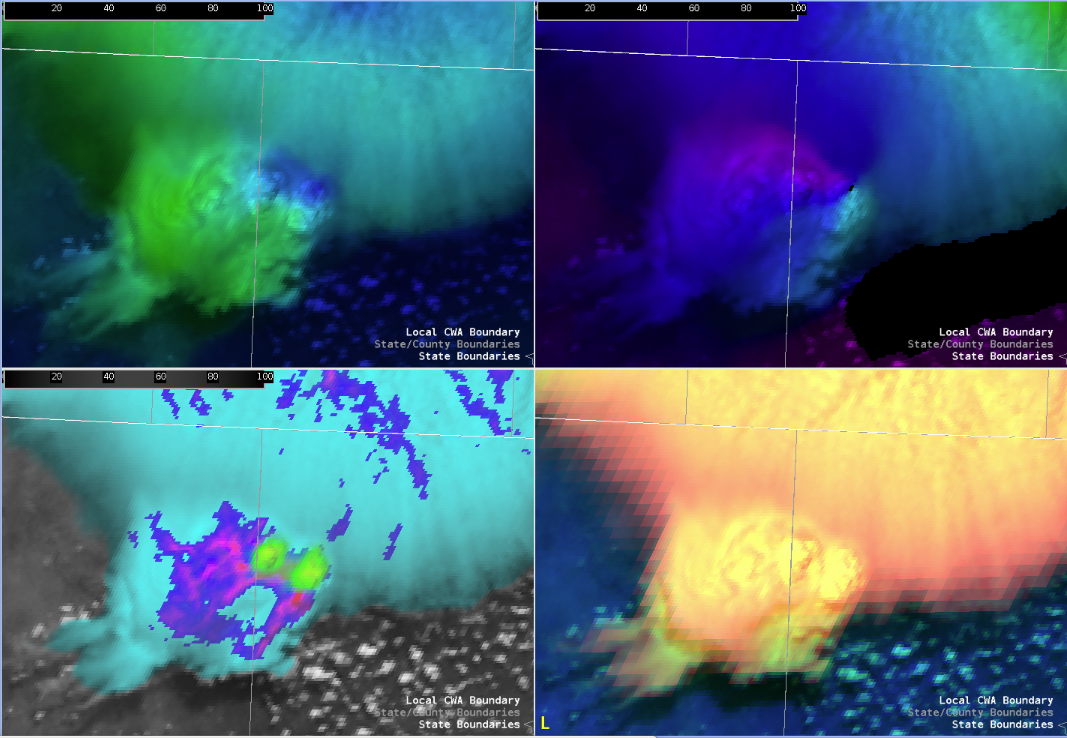
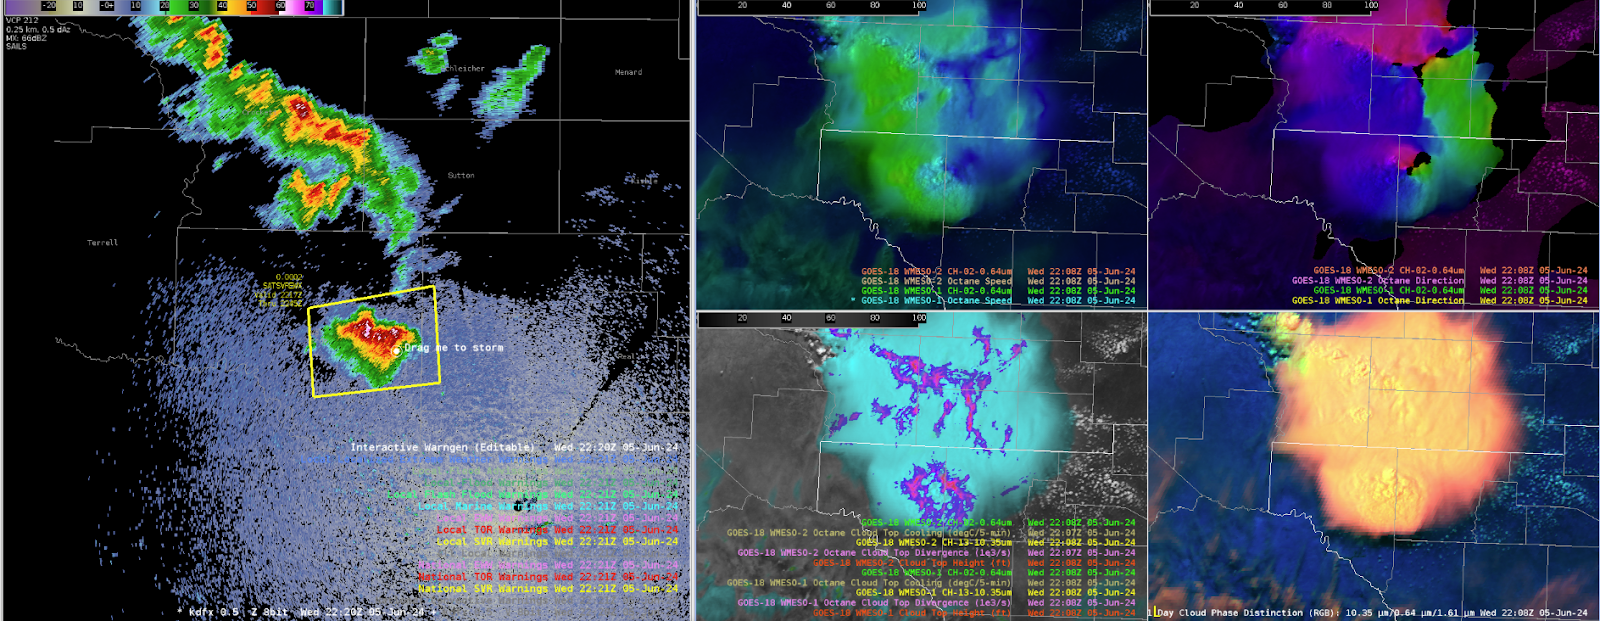
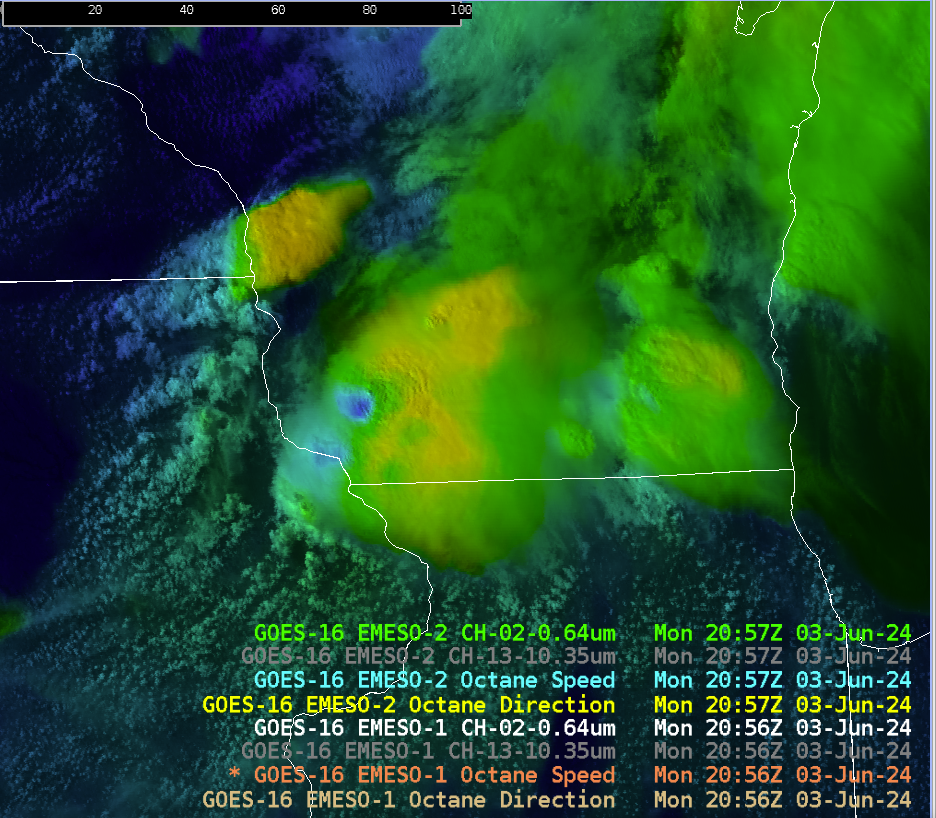
Modifying the OCTANE speed product by decreasing the max observed values downward and min values upwards helped diagnose a more eye turning signature to storm top divergence. Additionally, modifying the direction scale, albeit took some work, came out with a product that illustrates (in red) backed sfc winds <`180 degrees which existed well ahead of it, inferring the likelihood of larger curved hodographs and greater attendant estimated low-level SRH.
However, one item that was not noticed until after the TOR warning was the winds being ingested into the storm (shown in green) averaged around 210-230. This appeared very accurate looking at feeder cumulus ingesting into the inflow region of the cell just to the SSW. Less backing of the surface winds yields much less available streamwise vorticity (in fact is mainly crosswise) leading to the likely reason the storms rotation did not strengthen, and ultimately collapsed 30 minutes after the image above and the left-turning supercell became the dominant storm.
Overall, OCTANE exhibited great, practical uses to understanding not just the storm intensity/trends but the environment explaining why the storm was behaving the way it did.
– RED11248