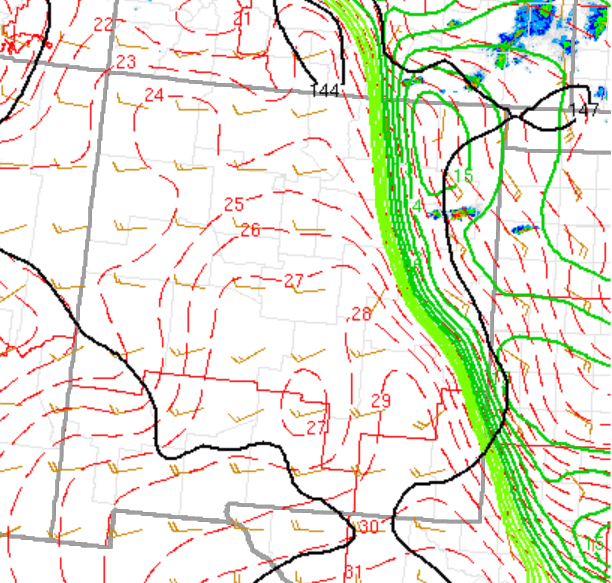
What appears to be a nice distinction between sheared / lesser sheared convection across the Octane window. Stronger shear across SW OK producing much different appearance versus SW KS convection. Nice quick visual distinction for operational use. The idea of a quantifiable divergence contour and/or grid would be welcome also.
Octane data from Goes west meso sector was zoomed in along the inflow region across the SW OK supercell (not our CWA but I had to look). The upper right panel is the directional component and the color scale was changed to highlight approximately 210 – 150 degree range. The increasingly warm colors represent a backing of flow at approximately 4.5 kFt. This level of storm integration (if appropriate) would be advantageous to warning operations.
ProbSevere time series plots do not sample. I would like sampling tied to the cursor as in the parent CAVE window. The element assignment within ProbSevere did cause a problem with the time series information with a storm that strengthened on the southern end of a developing line. The storm initially had a defined area for the region of interest but once ProbSevere assigned it to the larger line the probabilities became much less representative. This impacted ProbTor values which were being monitored ahead of an eventual tornado warning in the Tx Panhandle. I was the warning forecaster today and used ProbSevere extensively for my decisions. It is not the deciding factor but it certainly weighs into the decision process.
PHS model output was interesting and the Updraft Wind element was noted as something not usually seen with model output. It was viewed initially but I didn’t monitor the model output once storms developed and warnings were being issued.
NUCAPS forecasts were unavailable until the very end of the operational window. I did view the 19z overpass soundings and found the familiar trends of errors at the boundary layer when compared to nearby surface observations. This limitation continues to impact my confidence in the product.
– jbm
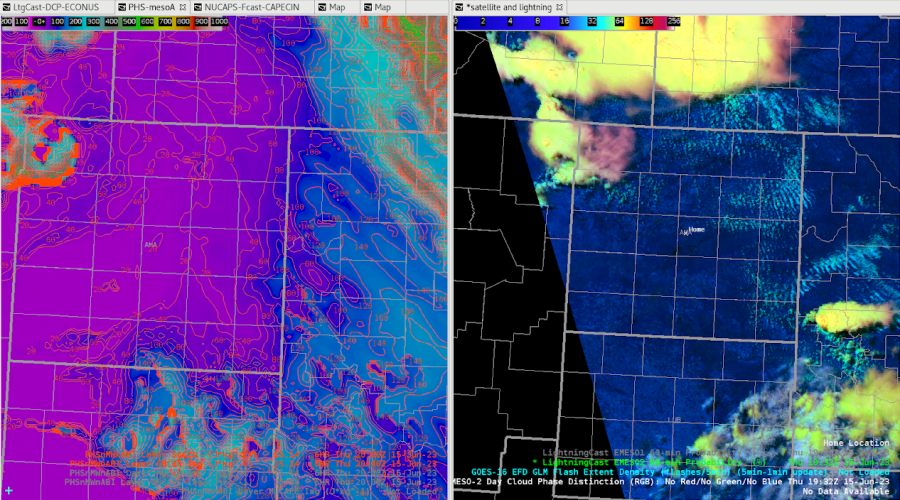
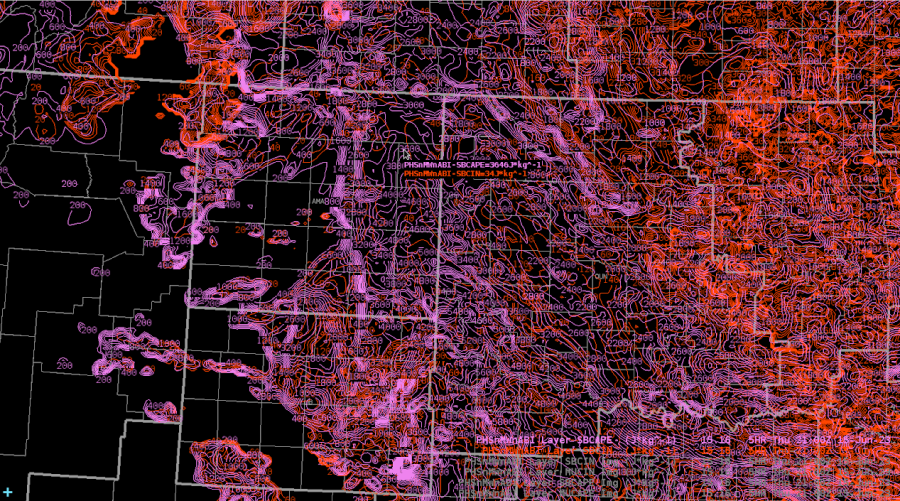
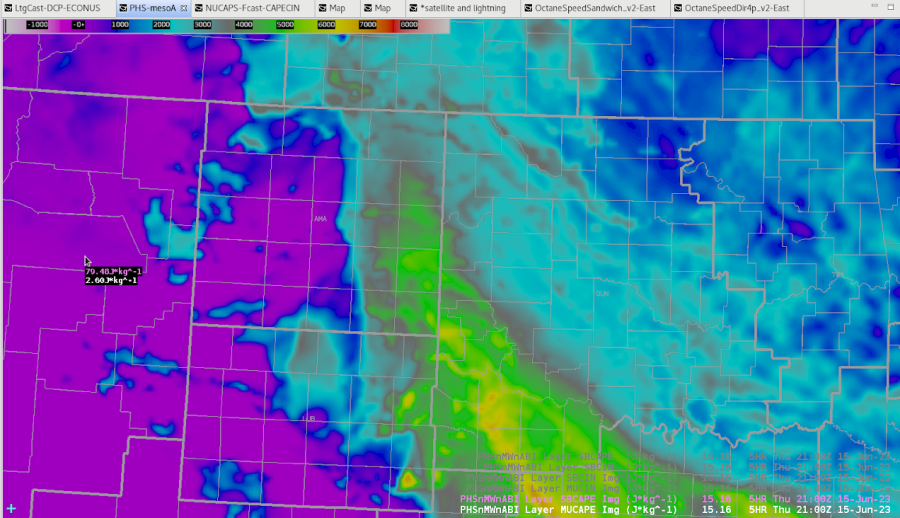
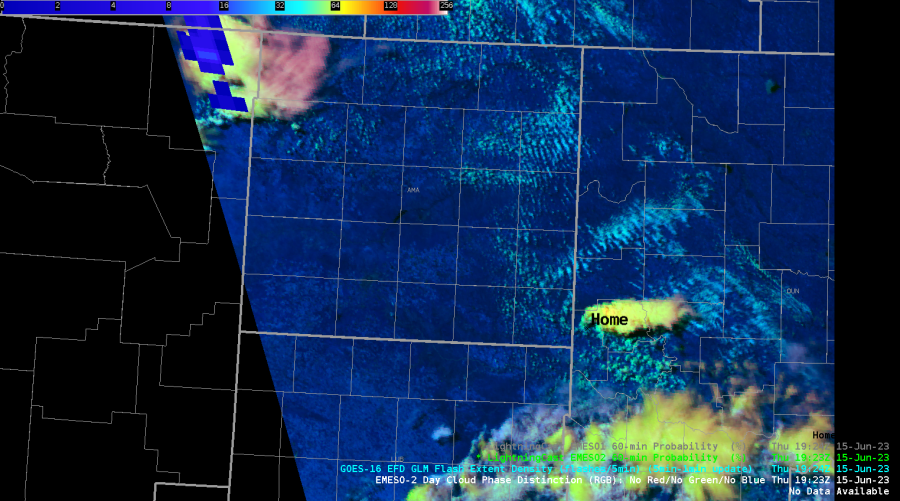
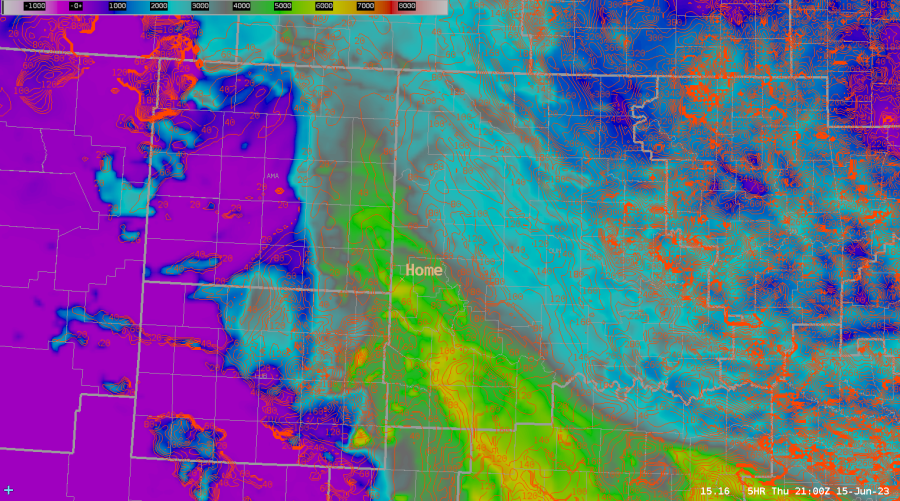
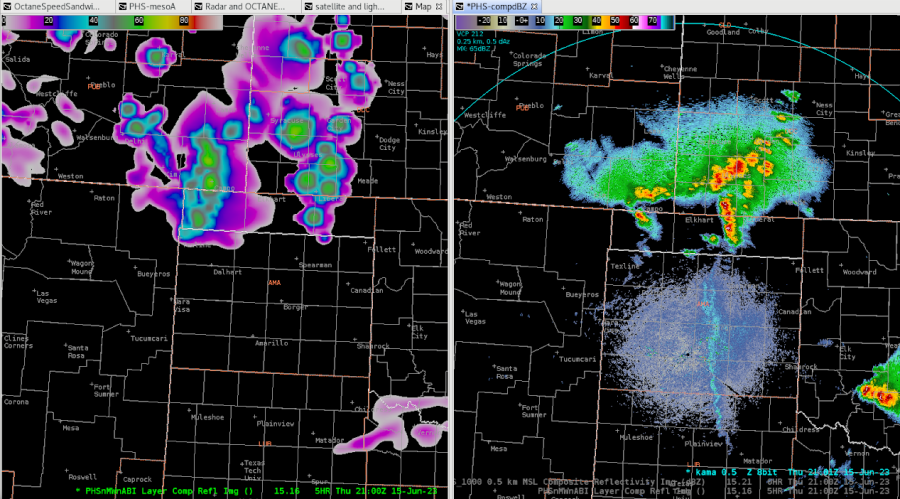
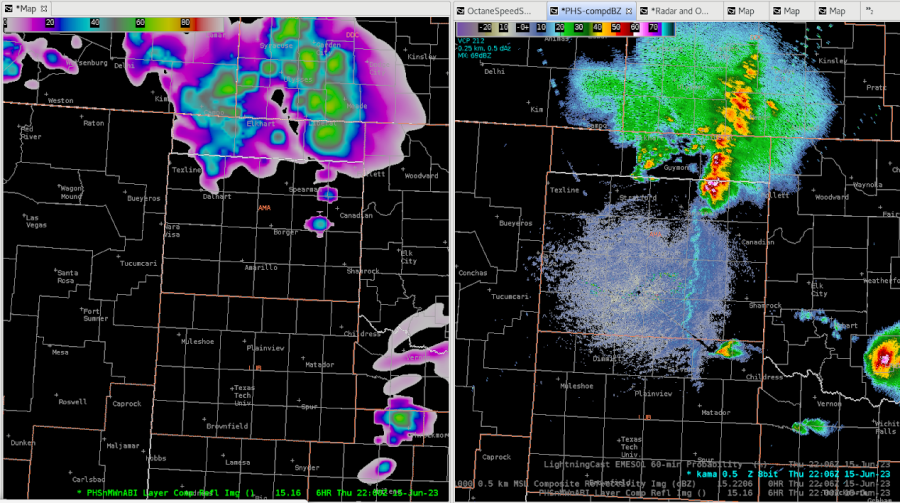
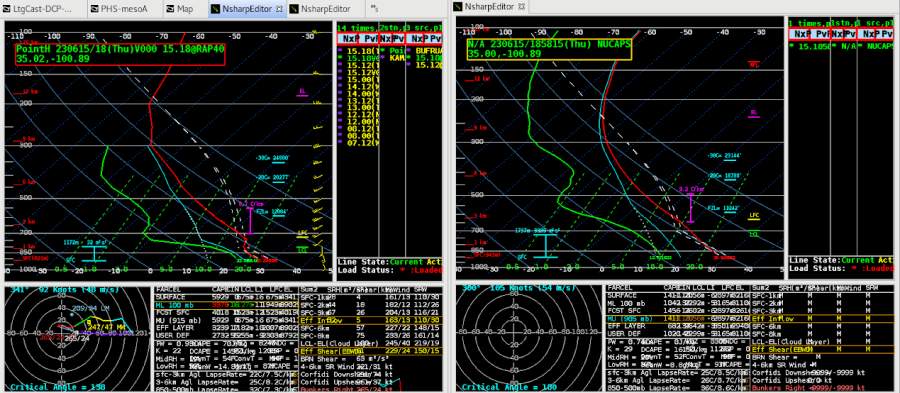
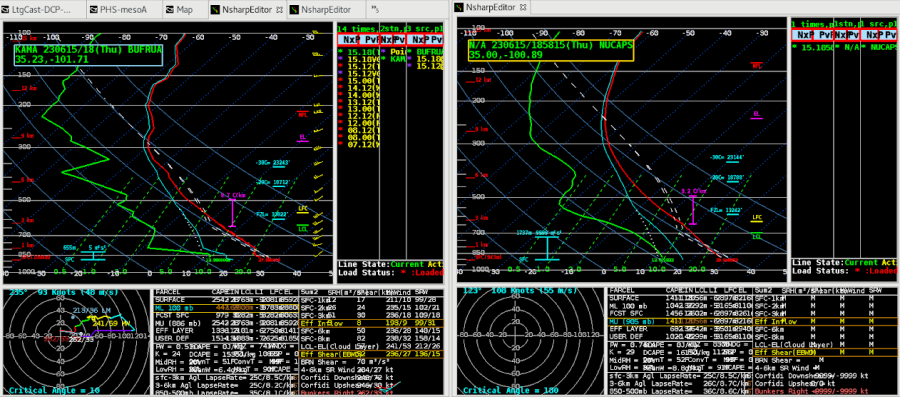
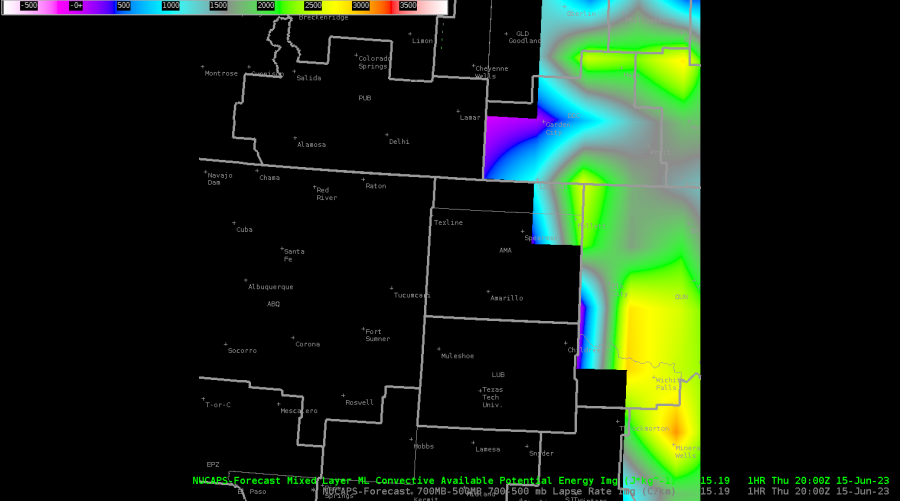
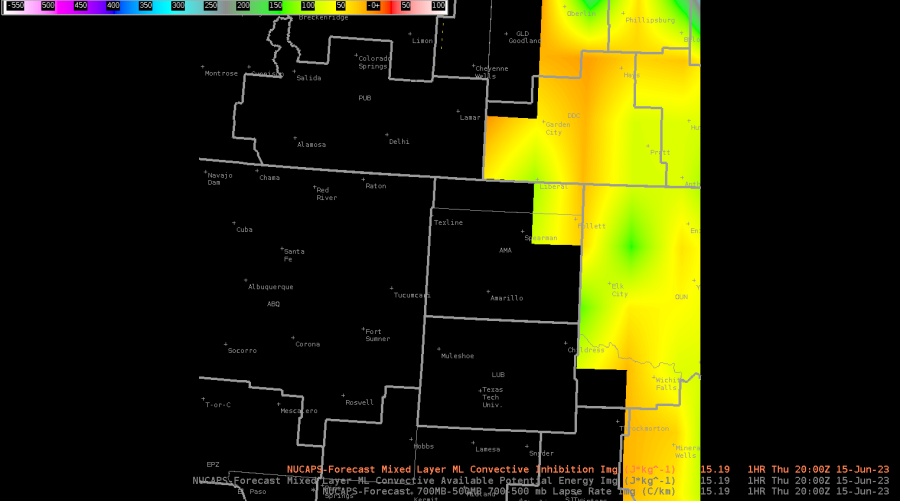
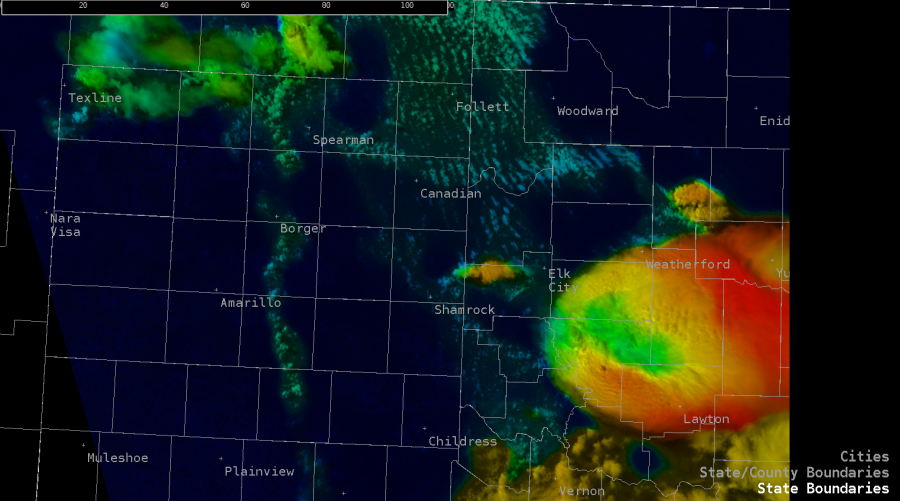
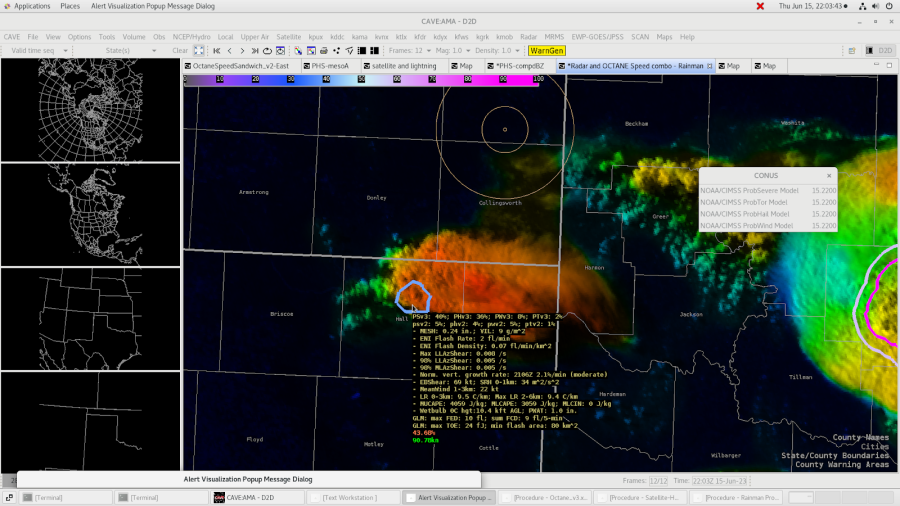
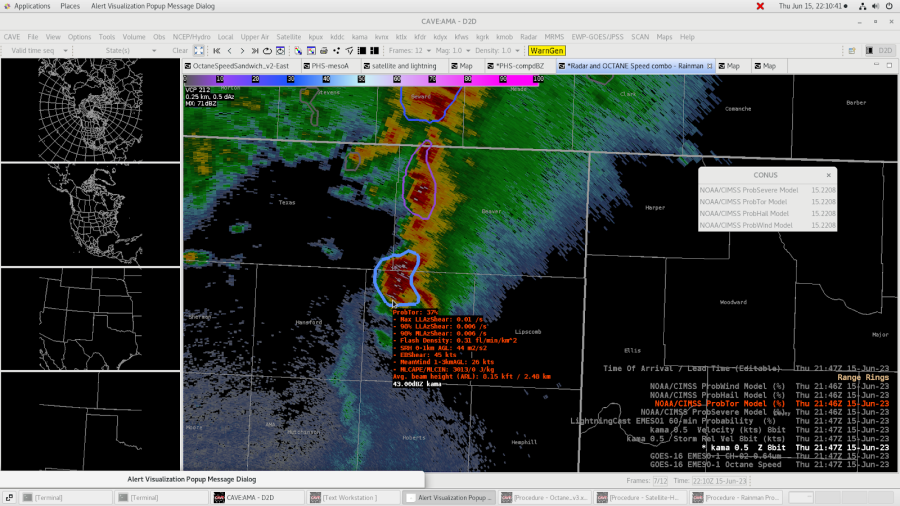
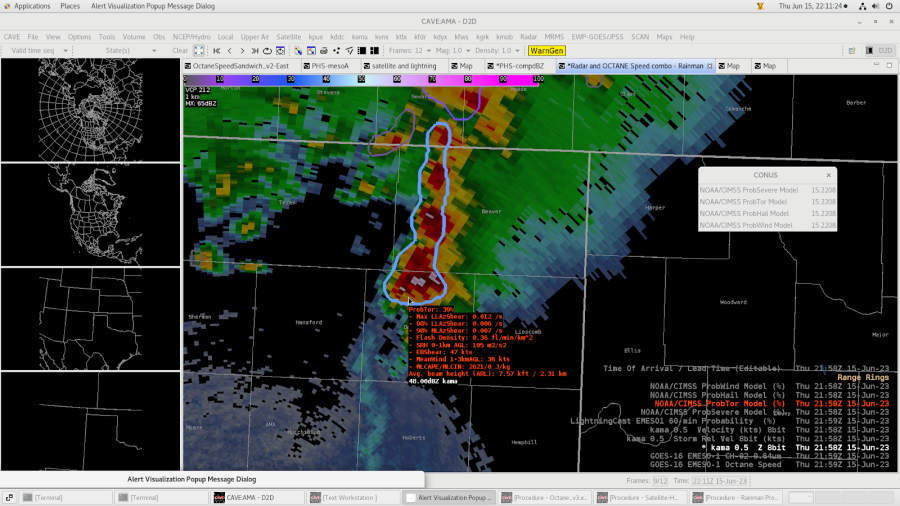
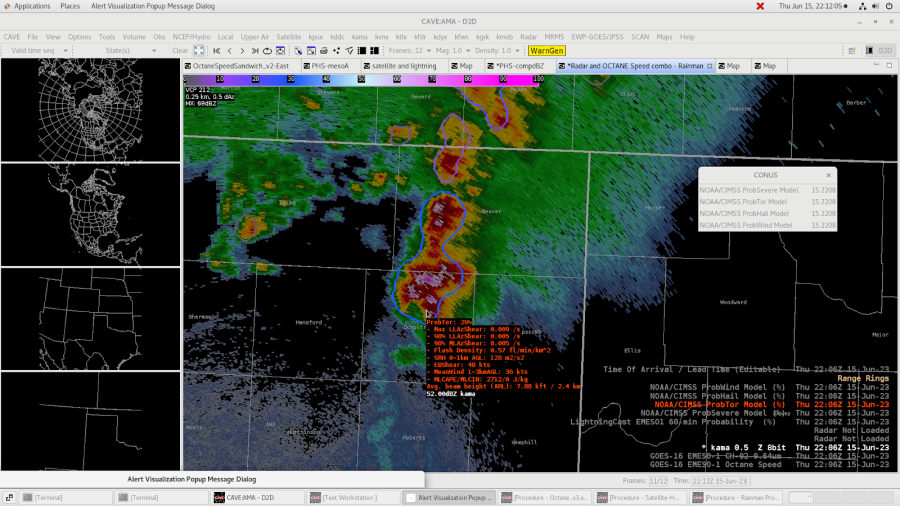
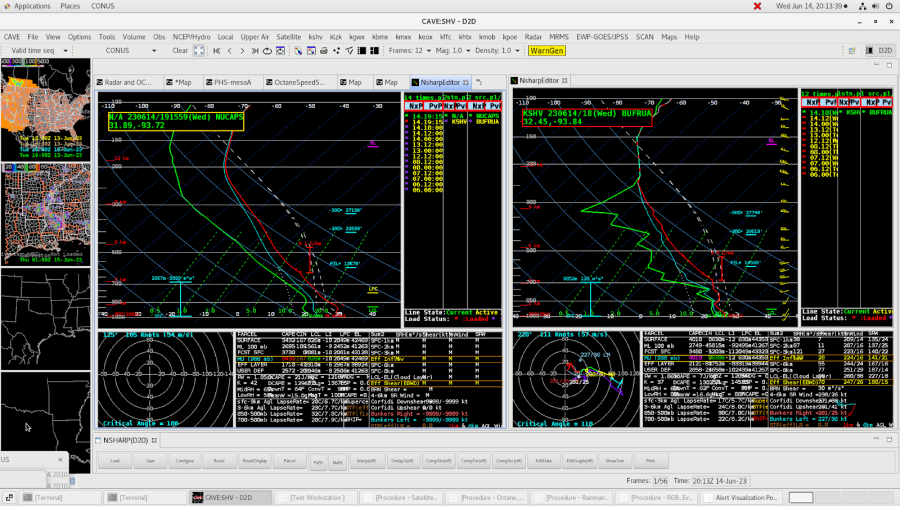
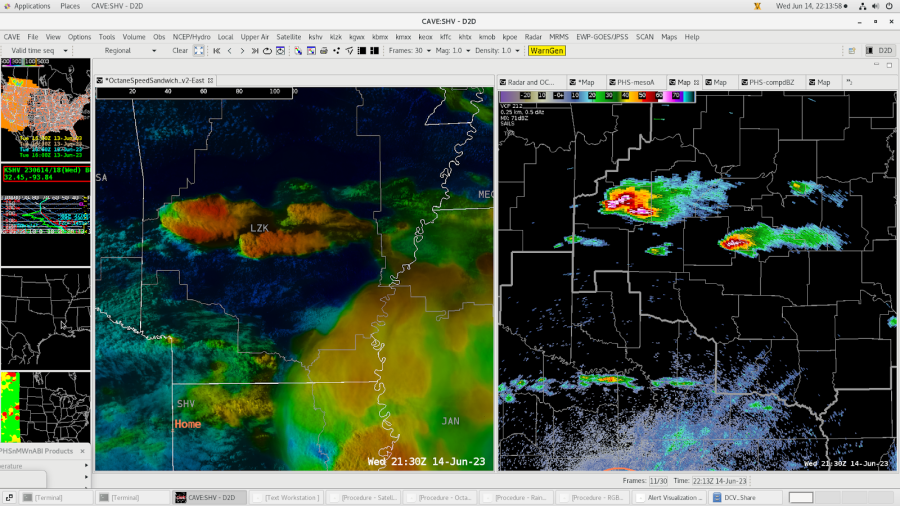
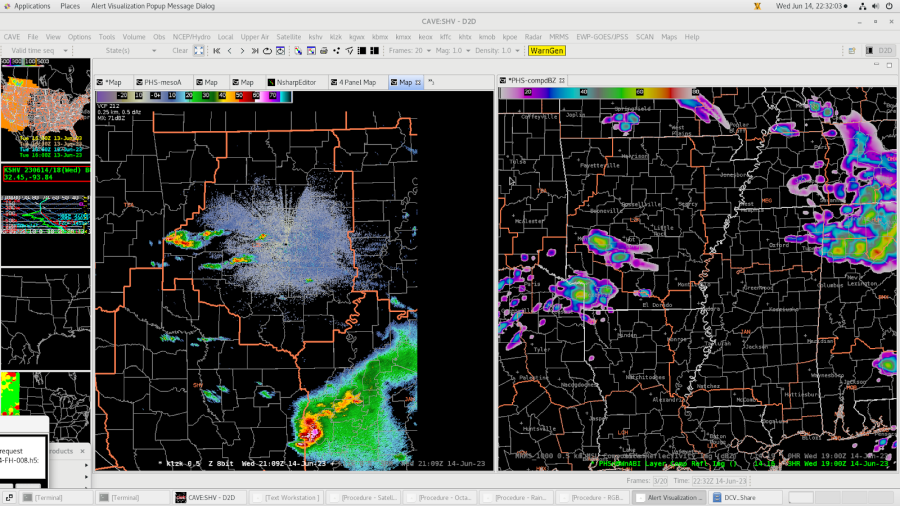
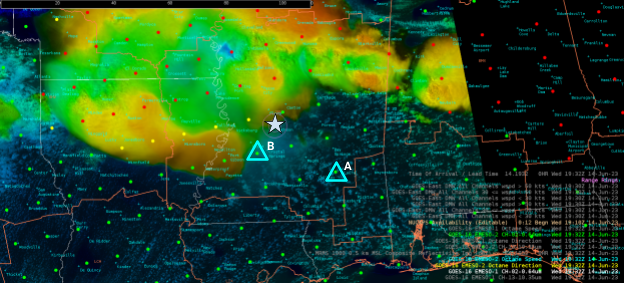
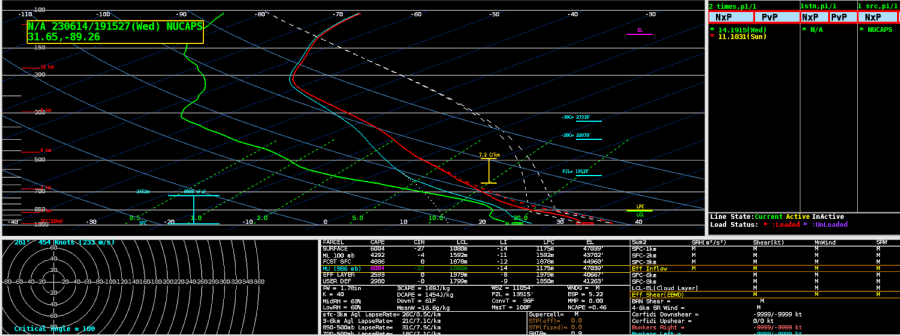
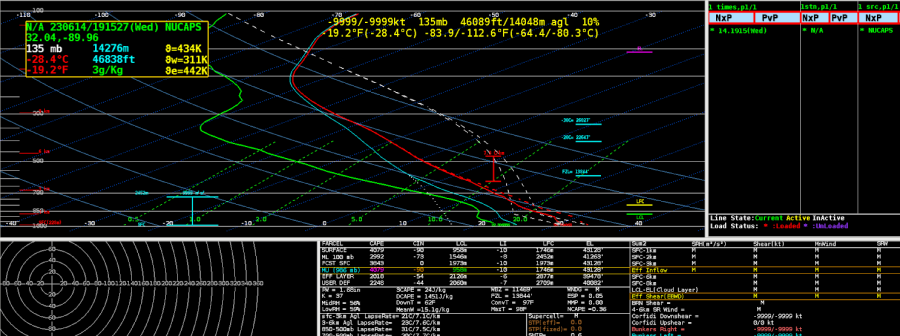
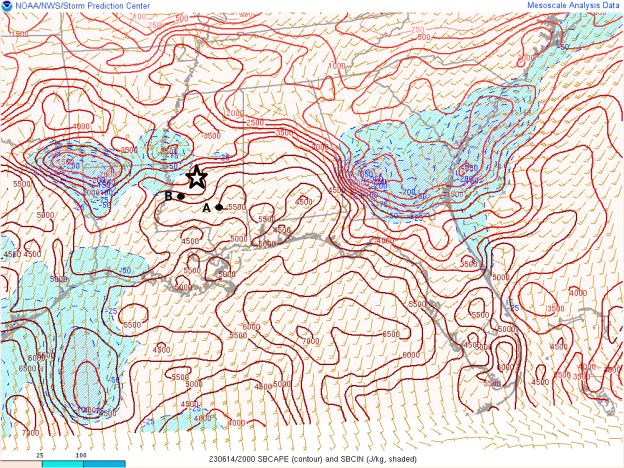
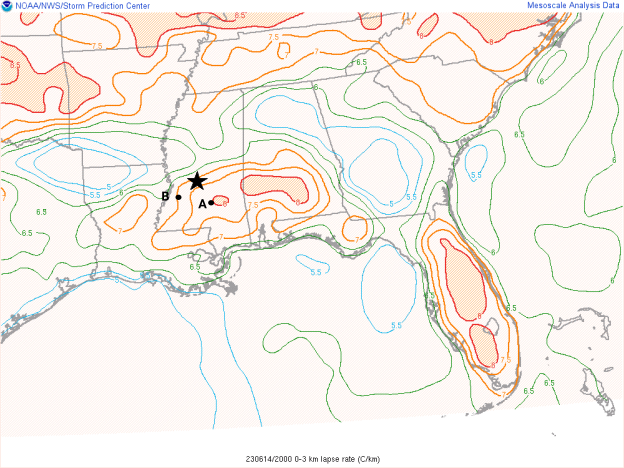
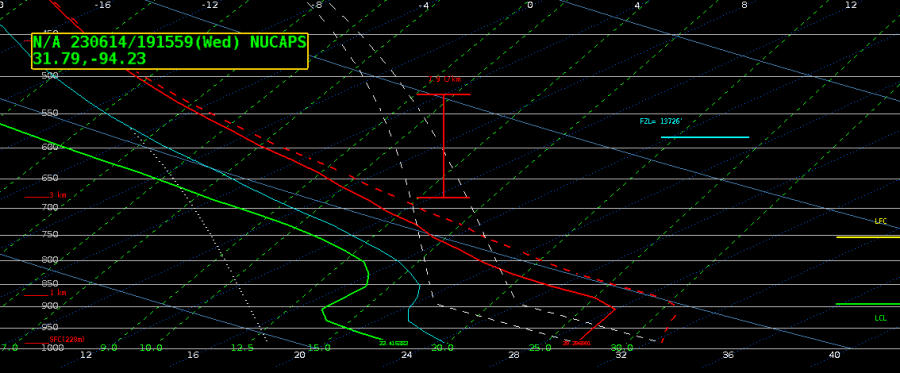
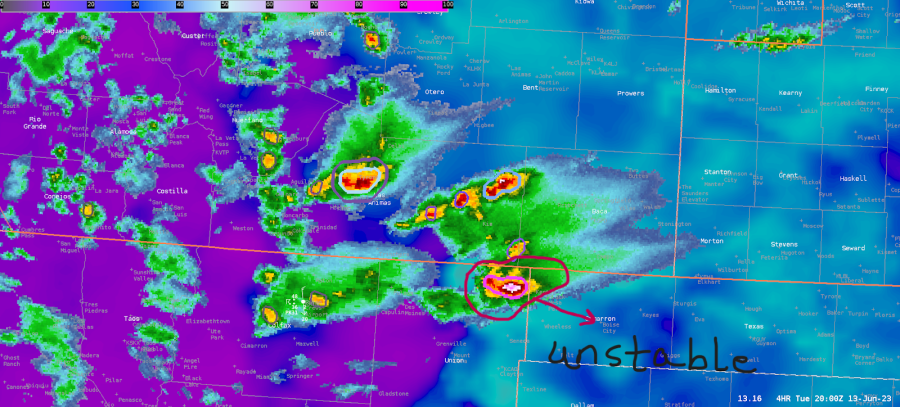
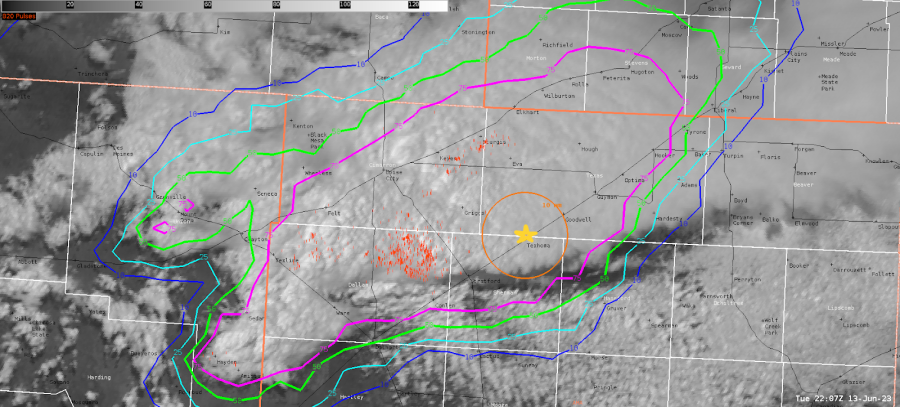
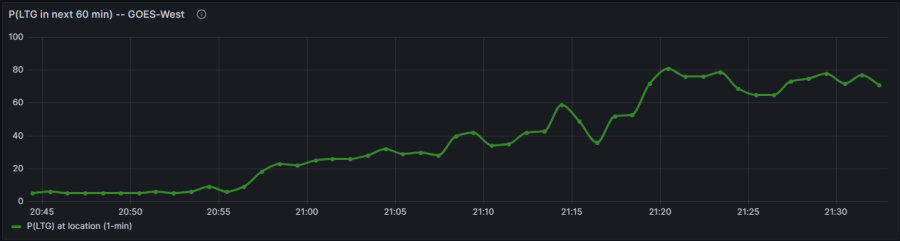
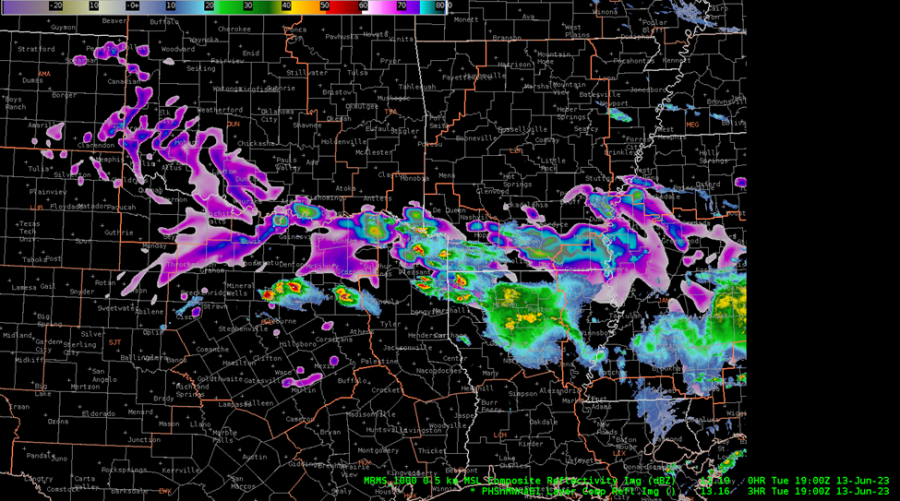
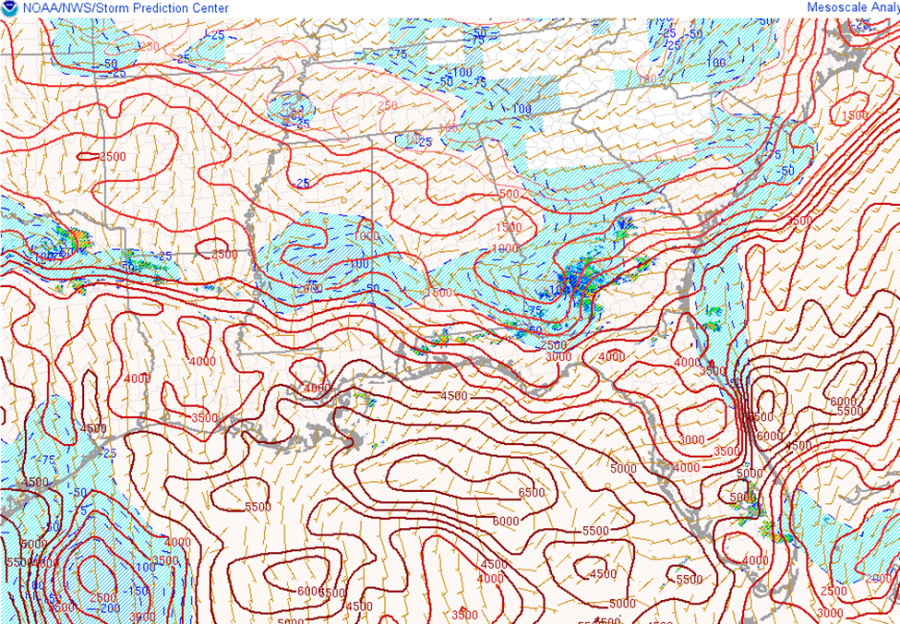
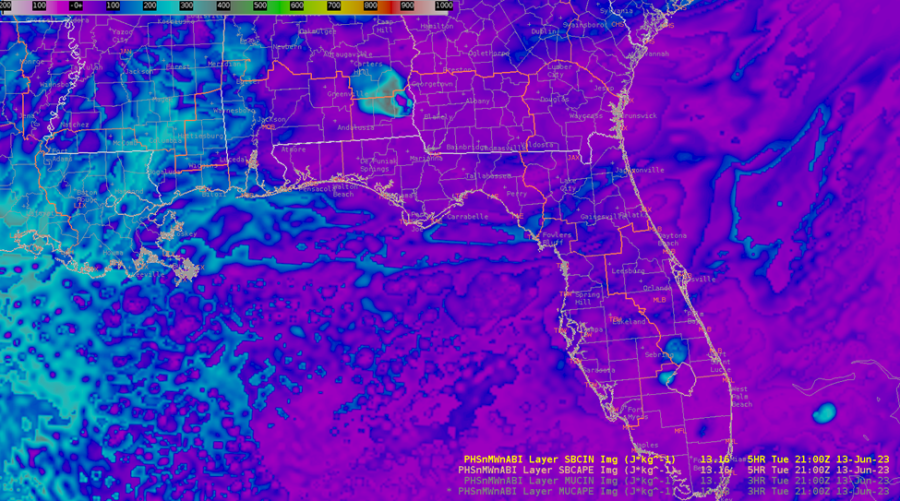
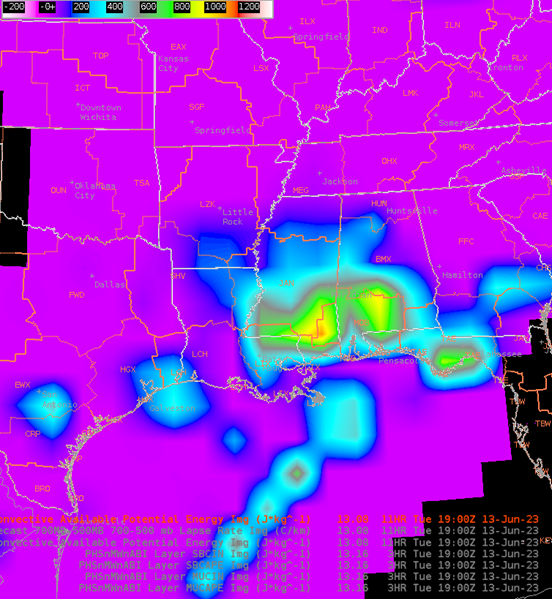
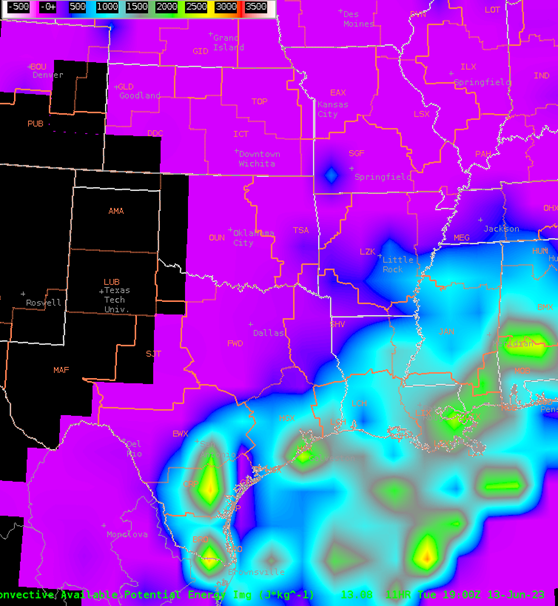
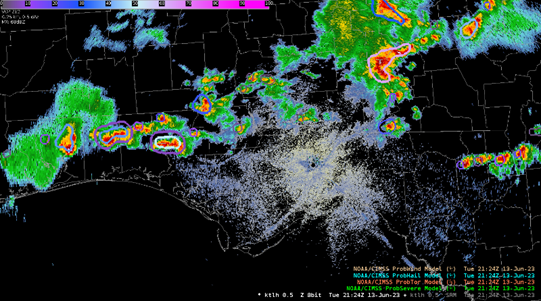
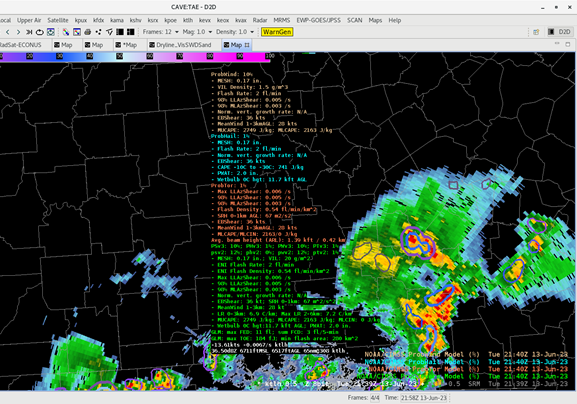
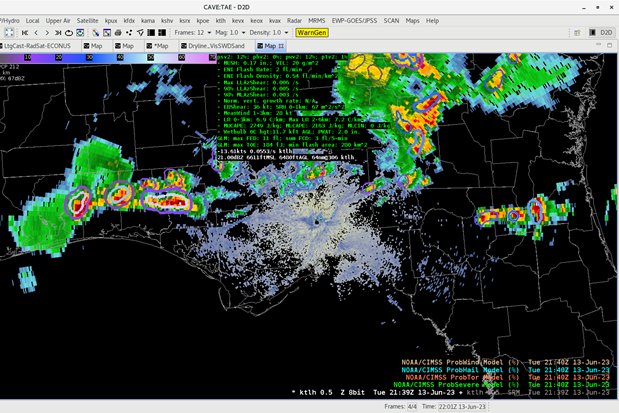
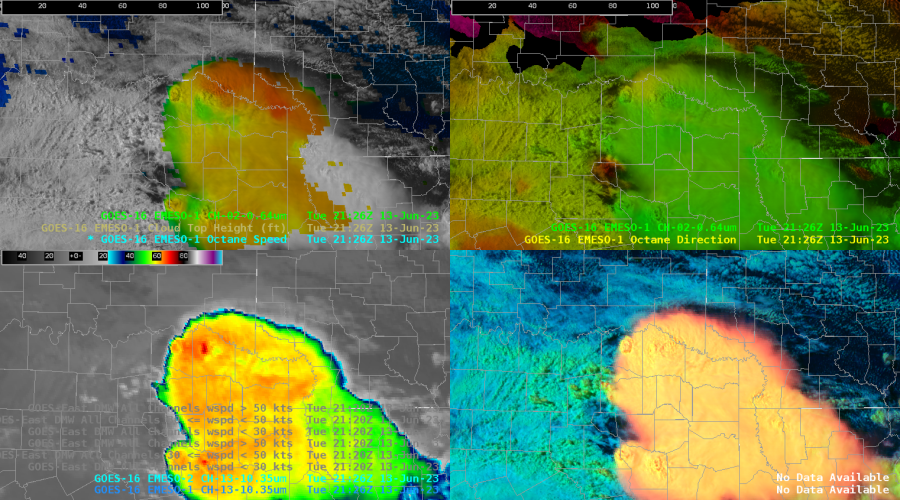
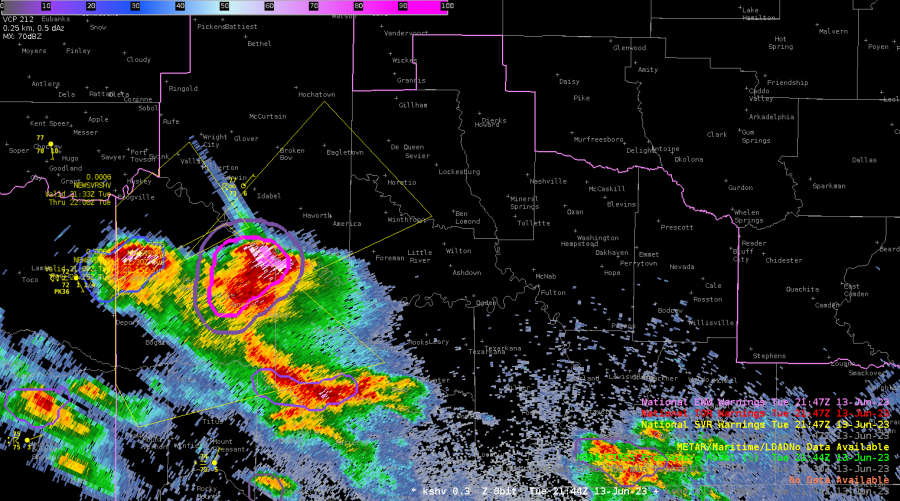

 Figure 1
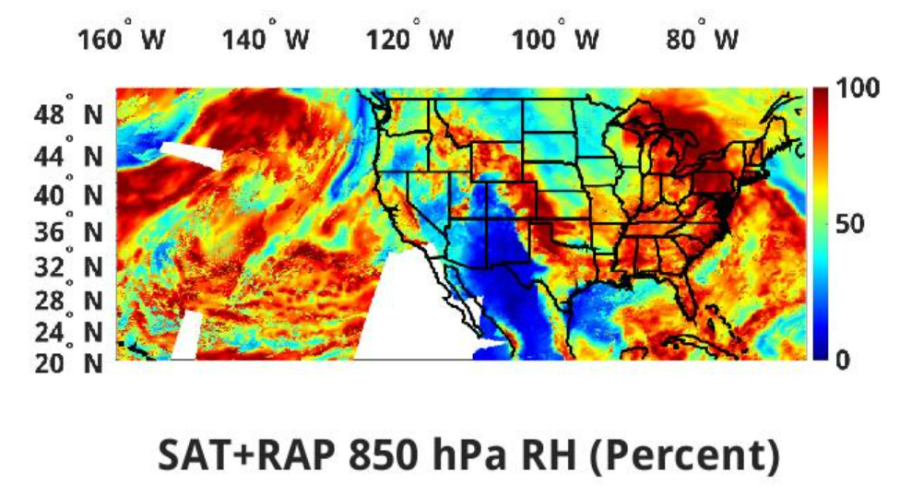 Figure 2