Day 4- Large Hail in Texas

Conditions were favorable for severe thunderstorms across west Texas on Thursday, June 5, 2025. High instability and shear led to rapid development thunderstorms across the high plains. Initially, a cluster of thunderstorms congealed into one which then split into two. The right mover went on to produce at least 3” in diameter hail and wind gusts in excess of 72mph. Due to the poor radar coverage in west Texas, GREMLIN was useful in supplementing radar and MRMS data. GREMLIN showed features I hadn’t seen in the start of the week, including bean-shaped storms and double updrafts that later split into two storms.

GREMLIN had some odd things occur too. ECONUS GLM did not represent the lightning that was occurring with these storms and it is believed that this may have degraded GREMLIN.  In the loop below, ECONUS GREMLIN produced a fictitious cell northeast of the left and right movers. It also lagged a bit before it showed two strong cells, especially the southern storm.

Four Panel-GREMLIN EMESO-1 (top left,) MRMS -10c (top right,) GREMLIN ECONUS (bottom right,) and CH07 (bottom left.) In this example you can see the stronger storm to the south

Here is a single image of the bean shaped cell that produced at least 3” hail.

LightningCast was useful for situational awareness and messaging our partners for the DSS event. We noticed V2 was a little better at maintaining the high probability of lightning (greater than 90%) than V1 in mature convection.

LightningCast proved to be useful for our fictitious DSS event in west Texas. V2 was faster to increase the probability of lightning prior to lighting occurring at the event (below.) It was also faster to show lightning cessation. There was a brief lull in lightning mid-way through the operational period and both V1 and V2 showed about a 20 min lead time of the probability of lightning decreasing in the next hour. V2 stayed slightly elevated compared to V1, but both highlighted that there was still a high probability of lightning in the next hour.

Lastly, OCTANE (below) proved to be useful again in warning operations. Robust, mature convection was ongoing and while it was “off to the races” in west Texas, the speed and divergence products continued to the tight gradient of speed divergence. We noticed that the compressed color scale was more “eye catching” to show the tight gradient. Below is a picture of the speed/direction divergence product with sampling turned on. The overshooting top was at an impressive -85C with winds out of the west at 50 mph. In this example, the gradient on the west side of the storm helped maintain our confidence of a powerful storm.

– Eagle

Tags: None

Supercells in Southwest Kansas

 Convection crossing into Hamilton County

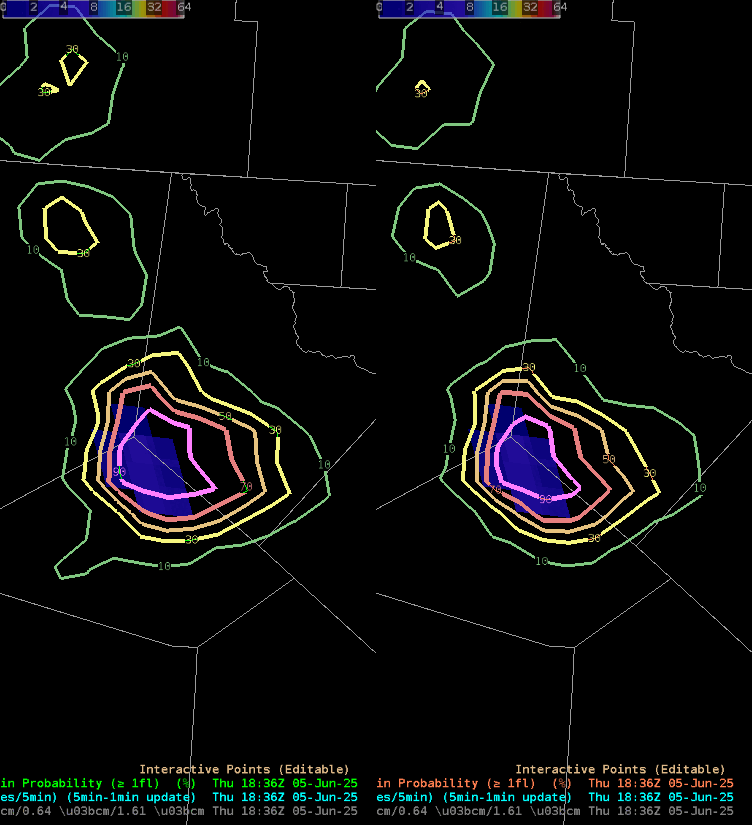
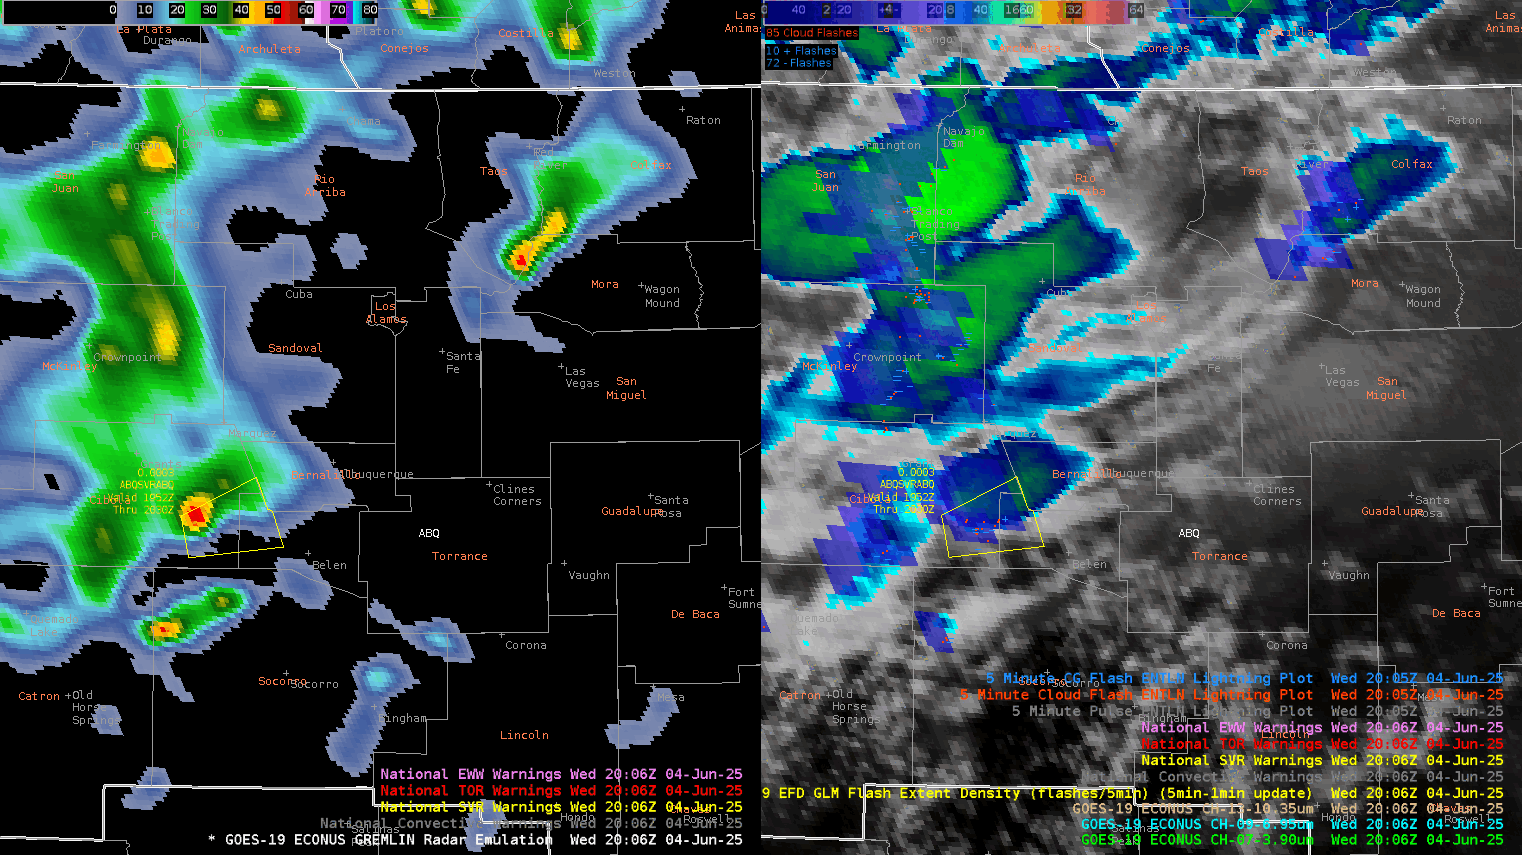
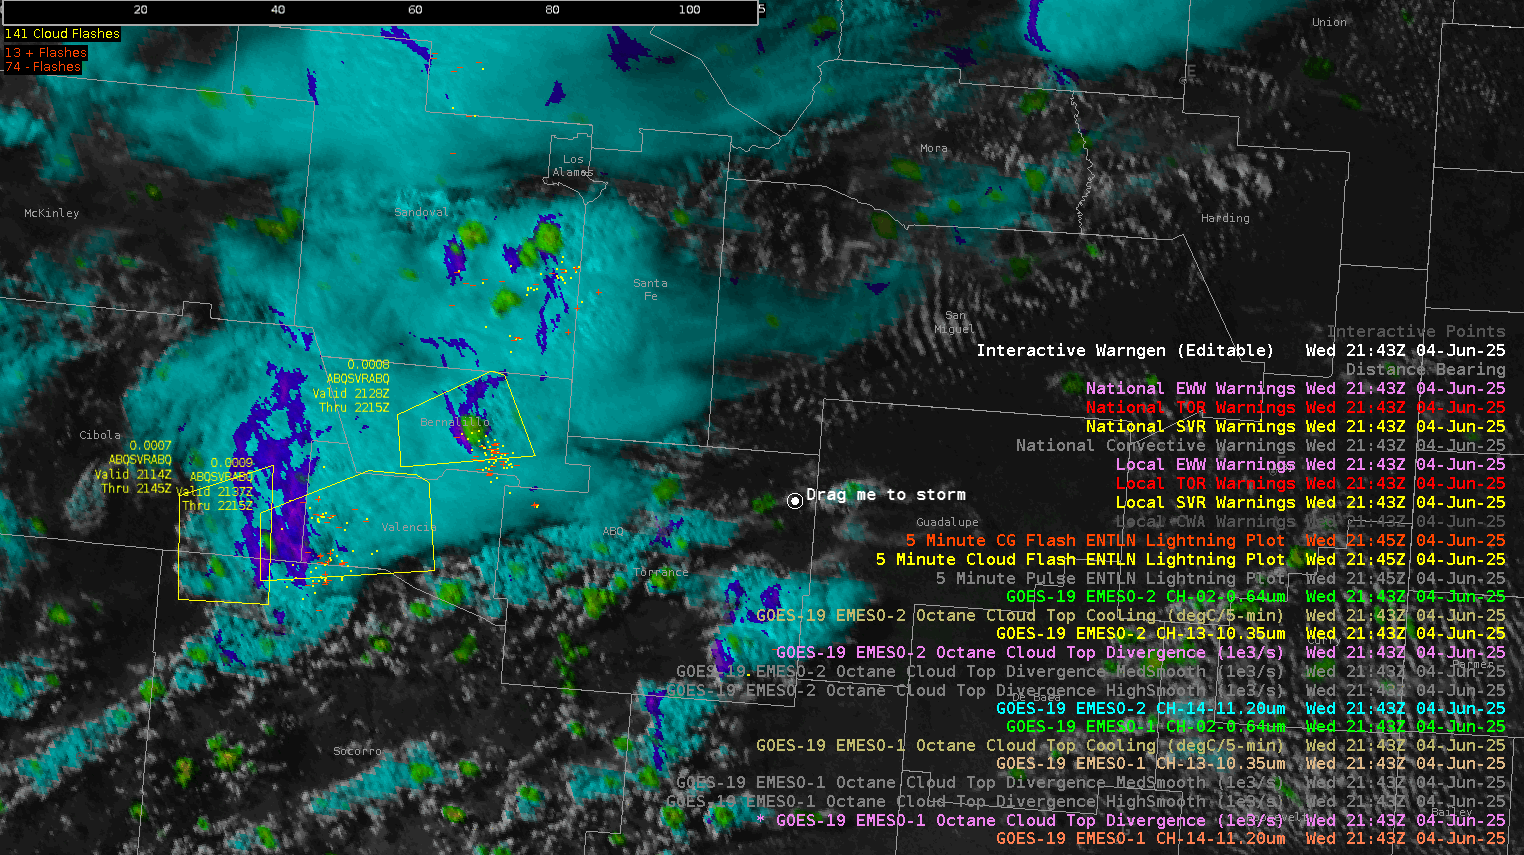
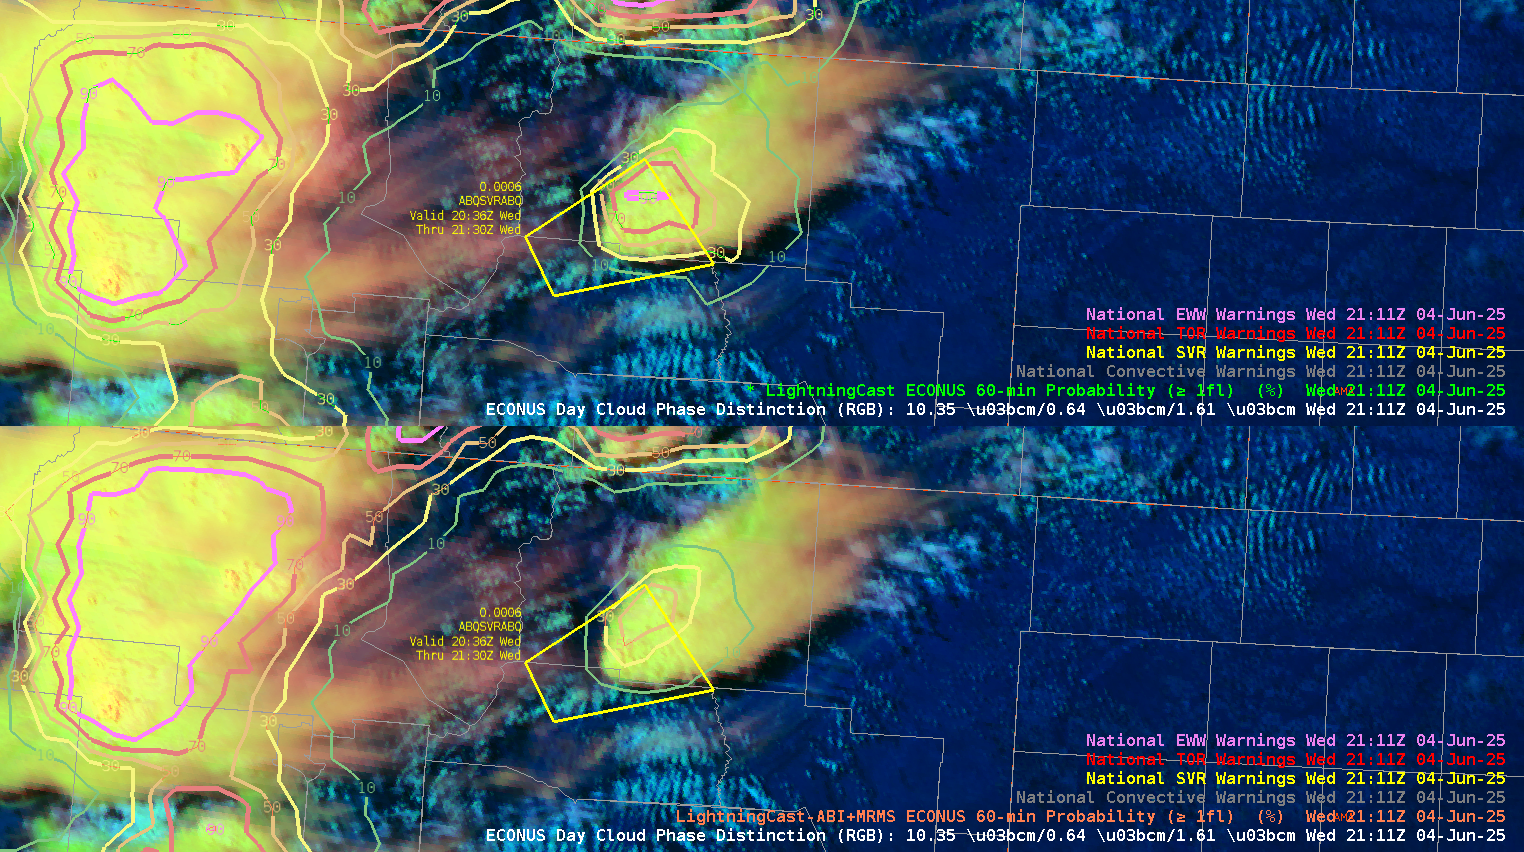
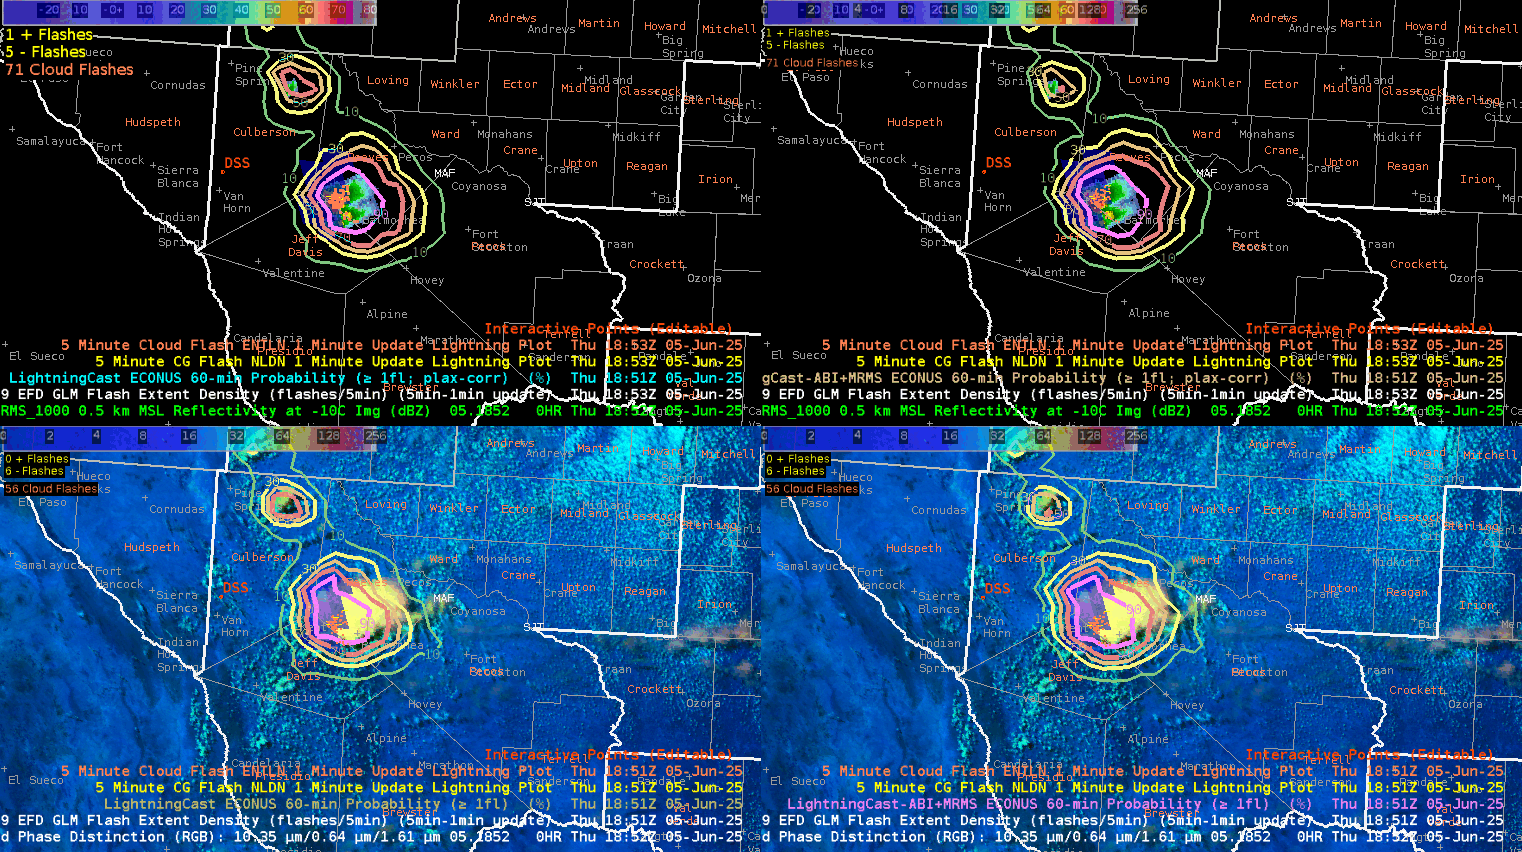
Pretty much right at the start of operations, convection over southeast Colorado began pushing east into Hamilton County, KS. Looking at the first gif below (Figure 1 with the Octane 4-panel), you can really see a persistent divergence signal as the storm continued into the county. Additionally, probsevere (located in the top left panel) was pretty high, maxing out above 90%. Next, looking at the LightningCast panels in Figure 2, you can see the lightning jump occurring right as it crosses over the county line. Utilizing these products together and noting radar showing a mid-level meso with 50 dBZ over 35kft, we felt confident to go ahead and issue a Severe Thunderstorm Warning for this cell (shown in Figure 3).

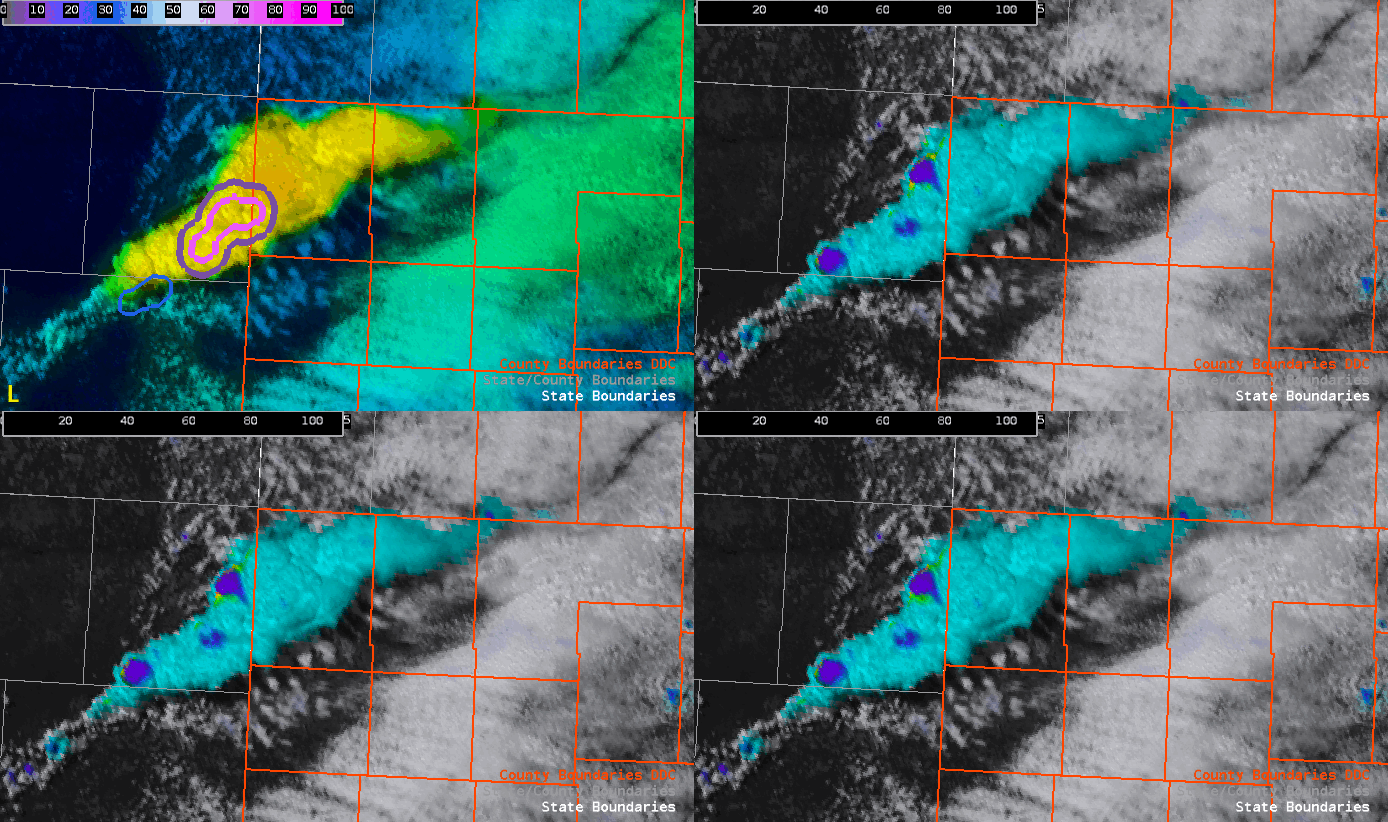
Figure 1: Octane 4-panel with ProbSevere overlaid in the top left panel

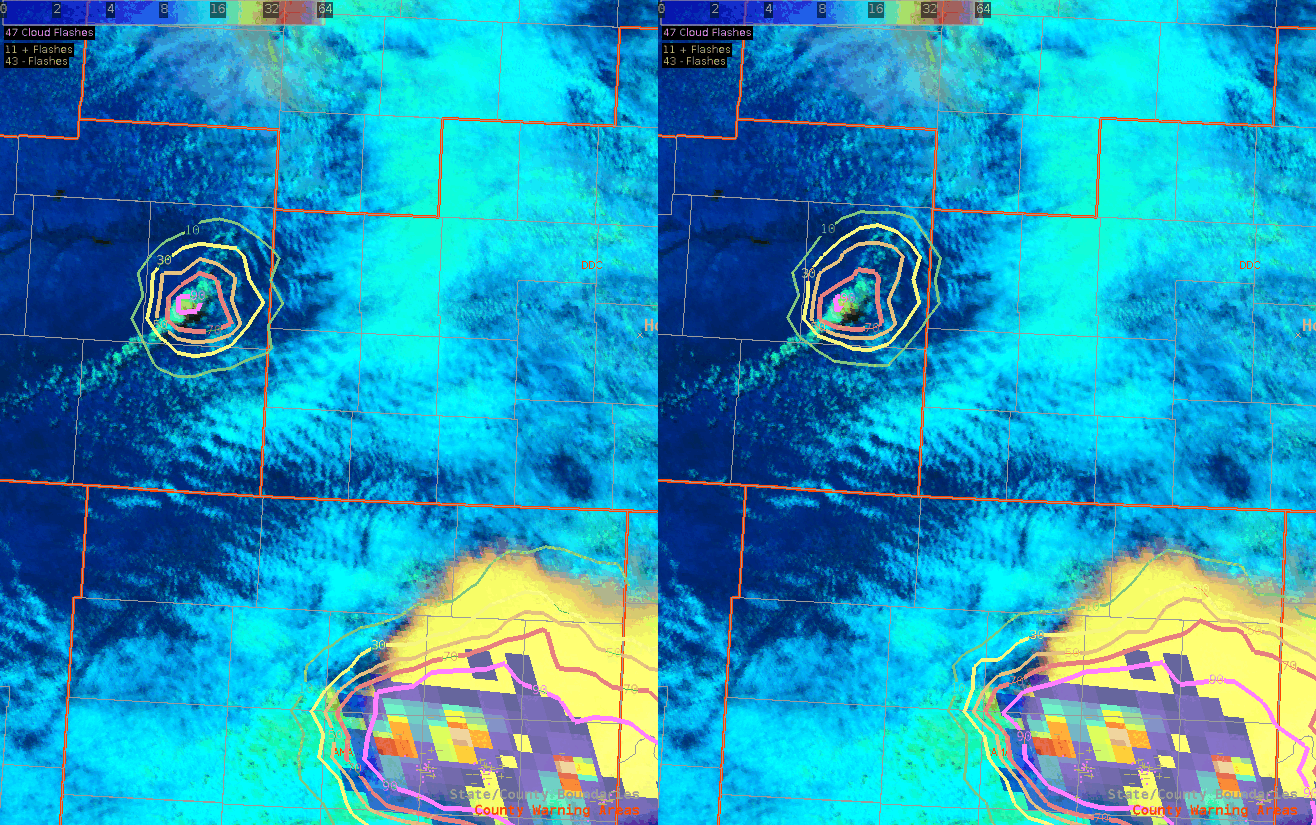
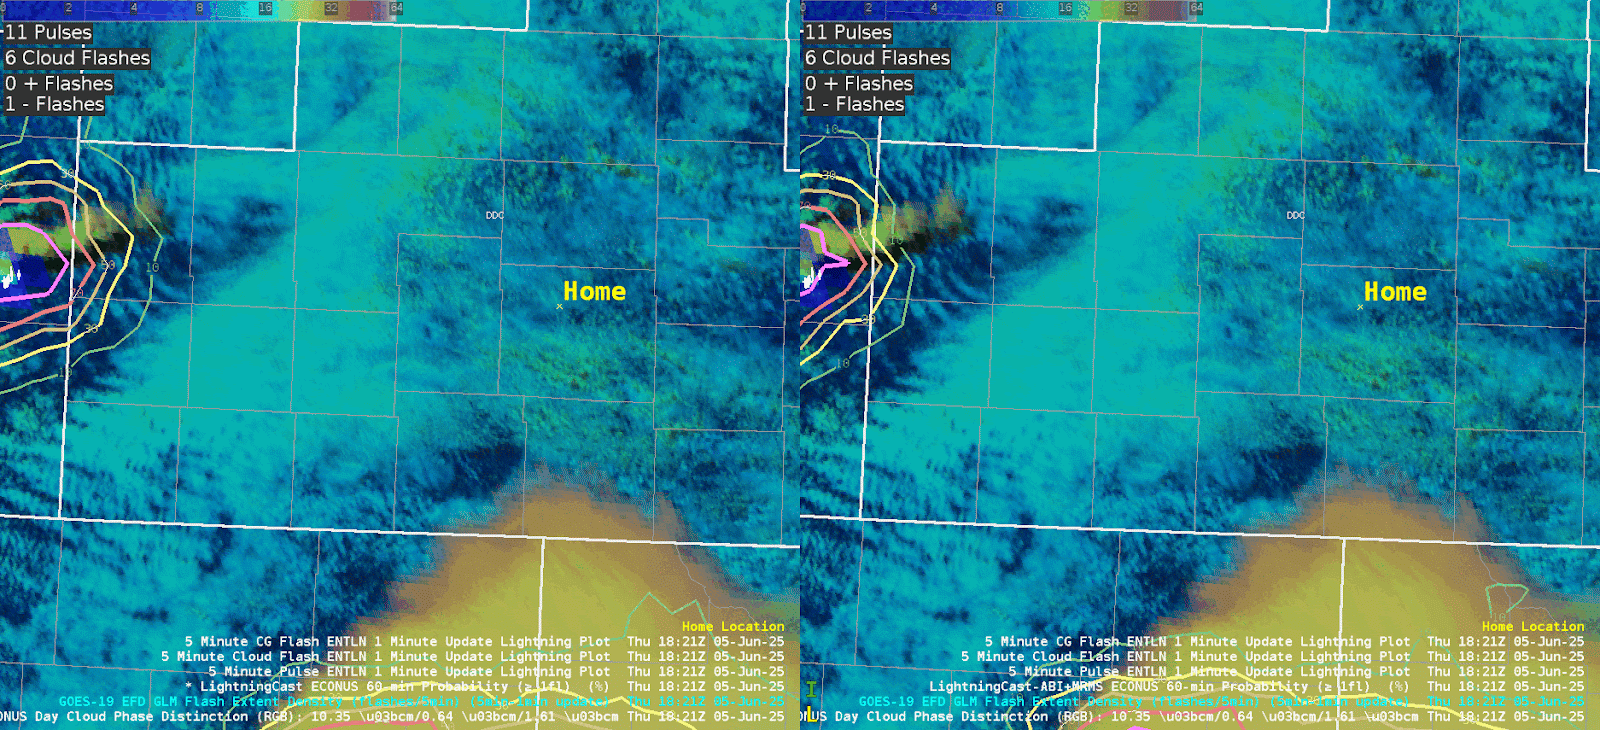
Figure 2: LightningCast v1(left) and v2(right) with GLM


Figure 3: Radar Reflectivity with the Severe Thunderstorm Warning


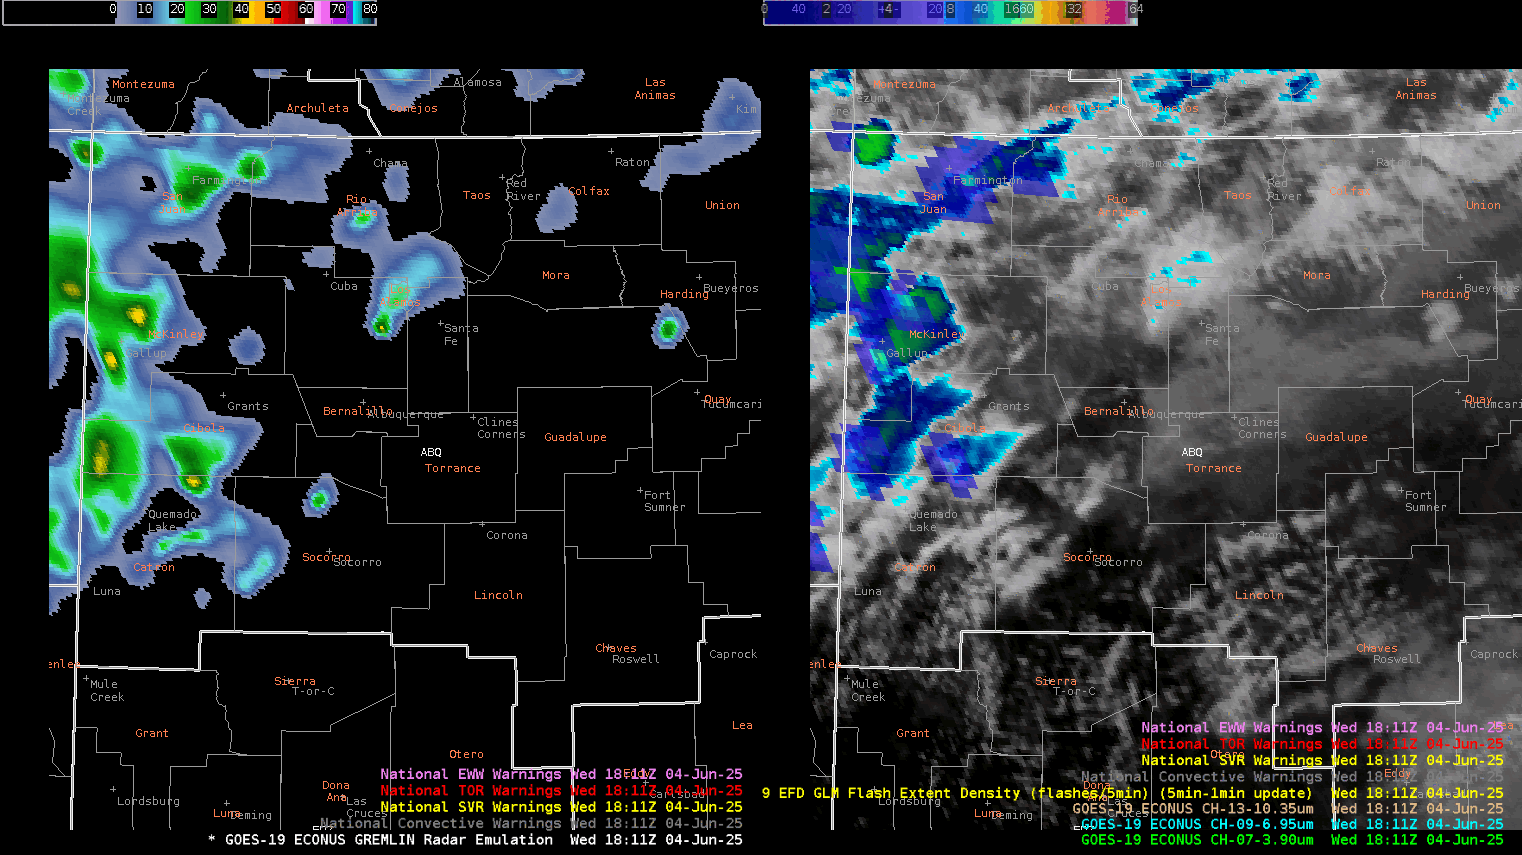
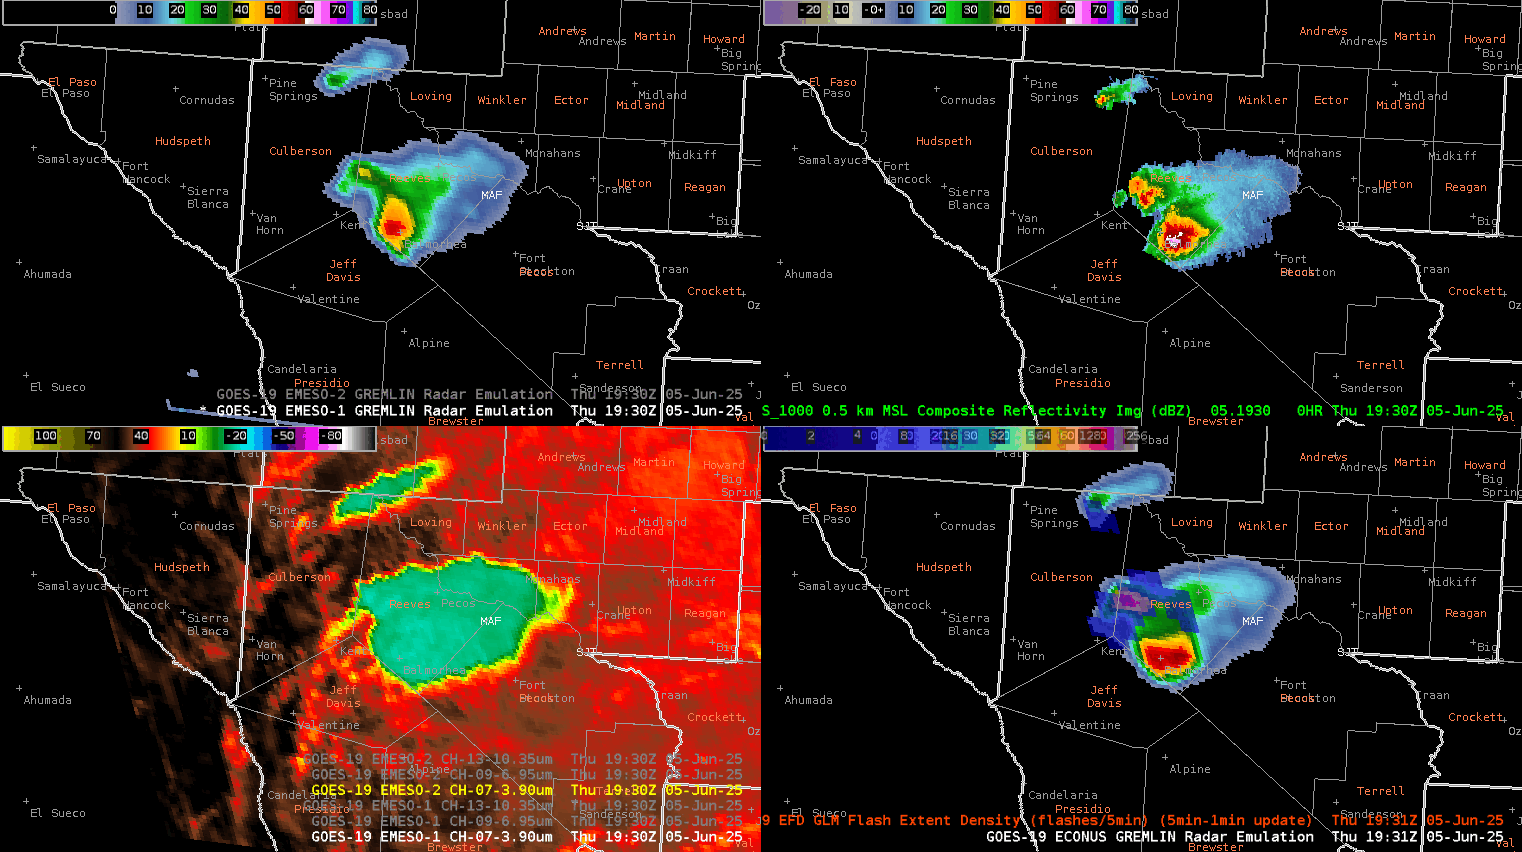
GREMLIN (top left panel in Figure 4 below) did a pretty good job showcasing this cell, as well as another strong cell just to the southwest, however compared to MRMS (top right panel), it didn’t capture the stronger reflectivities as well, and was approximately 5-10+ dBZ off. So if I didn’t have radar access and could only rely on GREMLIN, I may not have felt as strongly about issuing a SVR.

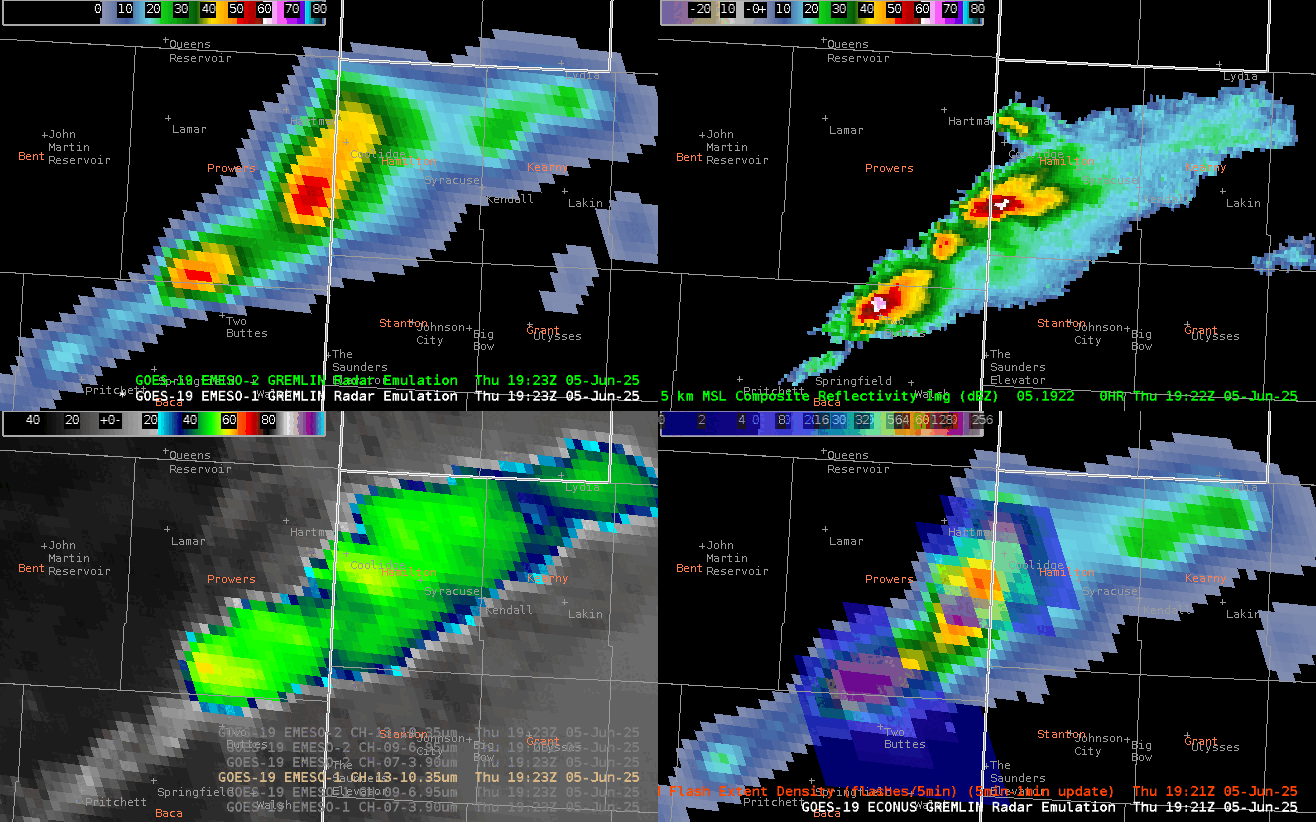
Figure 4: GREMLIN 4-panel

I didn’t grab images of this, however later on, there was a clear decrease in the lightning activity, with noticeably lower divergence and cloud top cooling. This gave me the confidence to cancel my warning early.

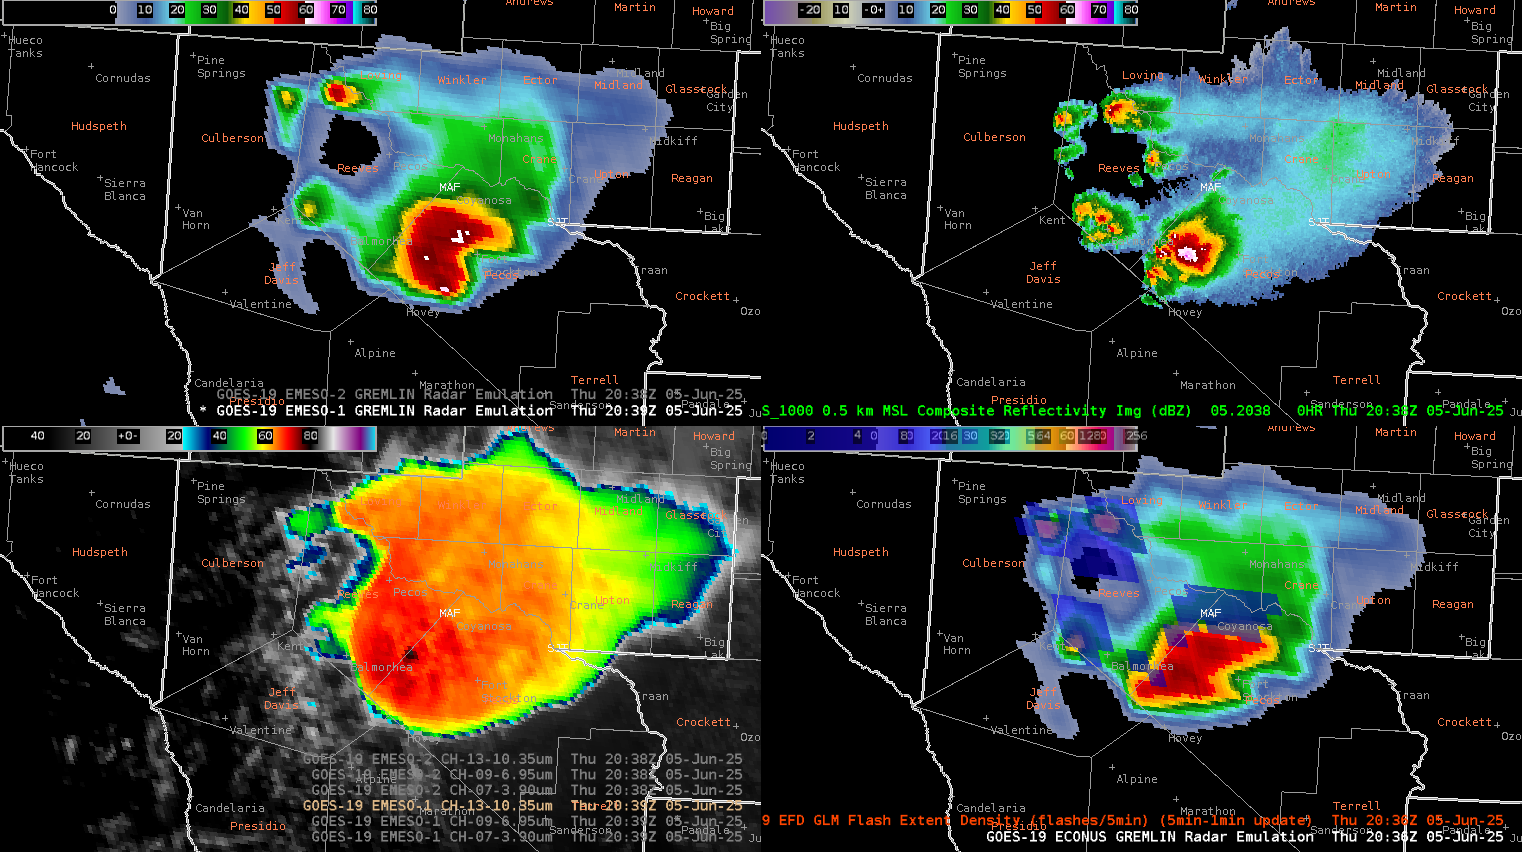
Octane and ProbSevere

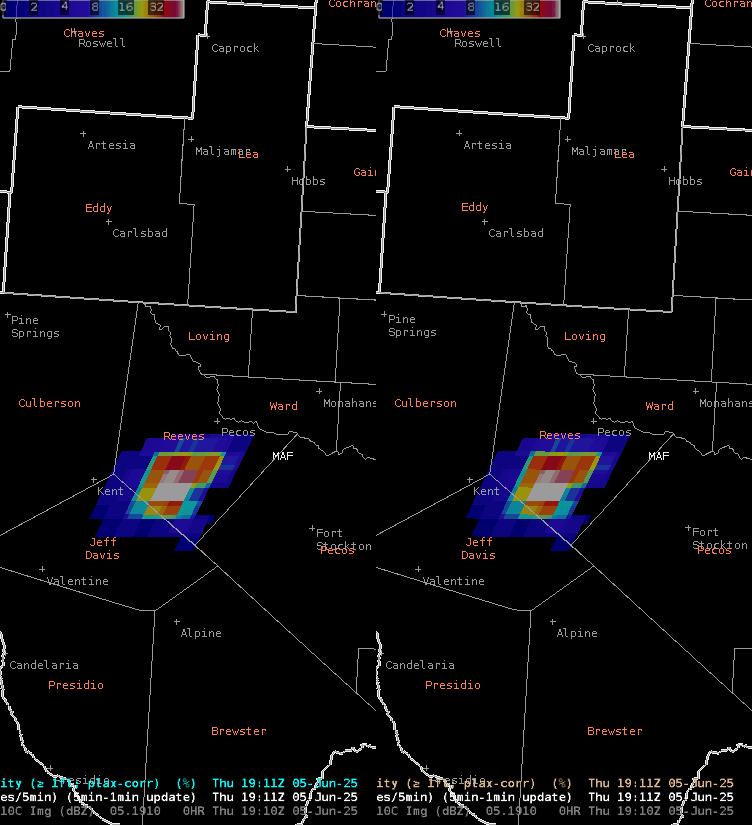
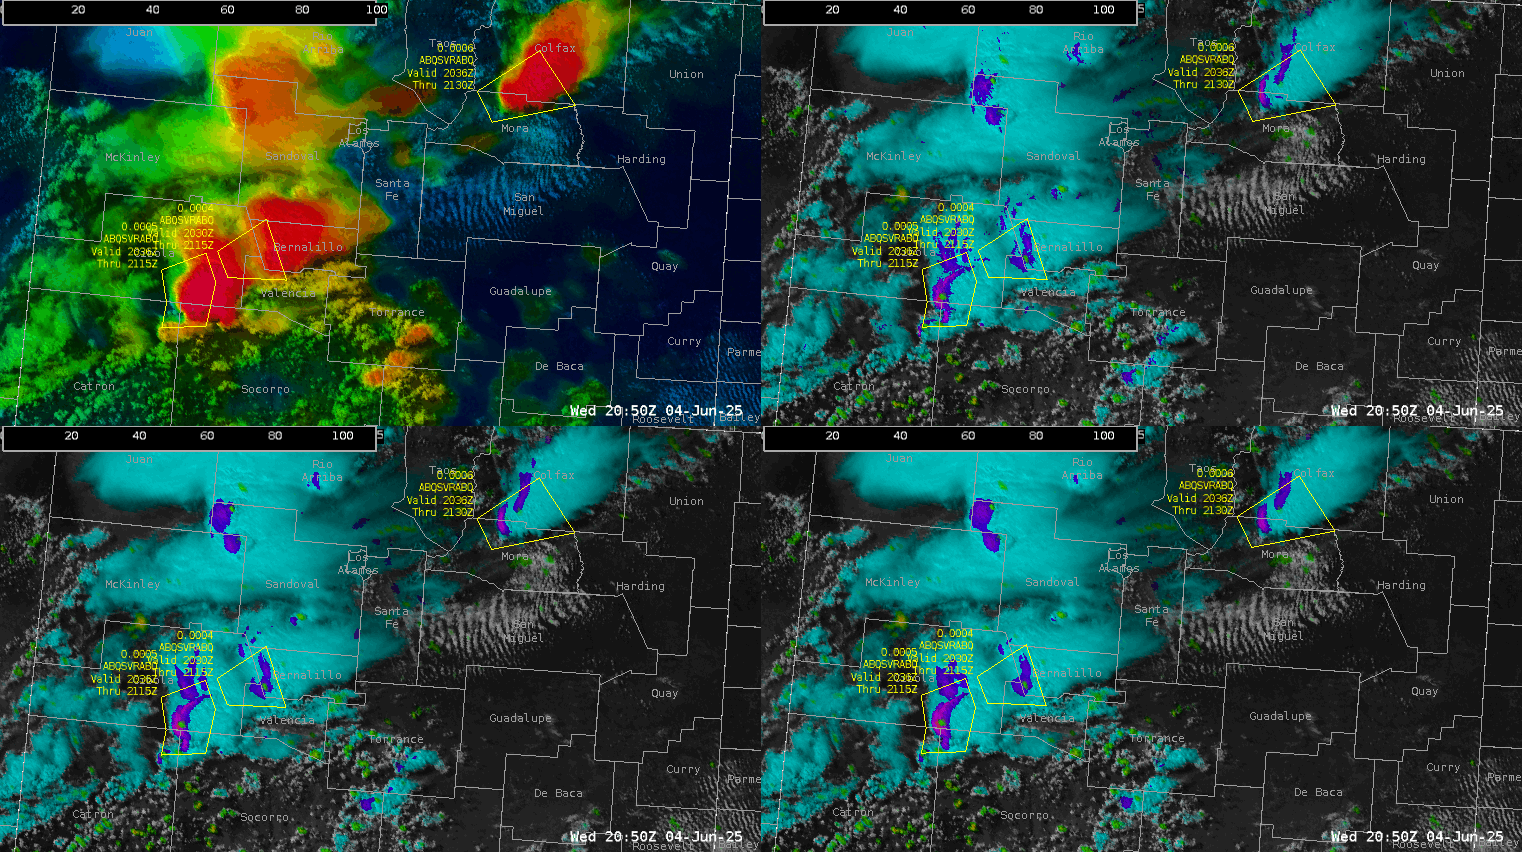
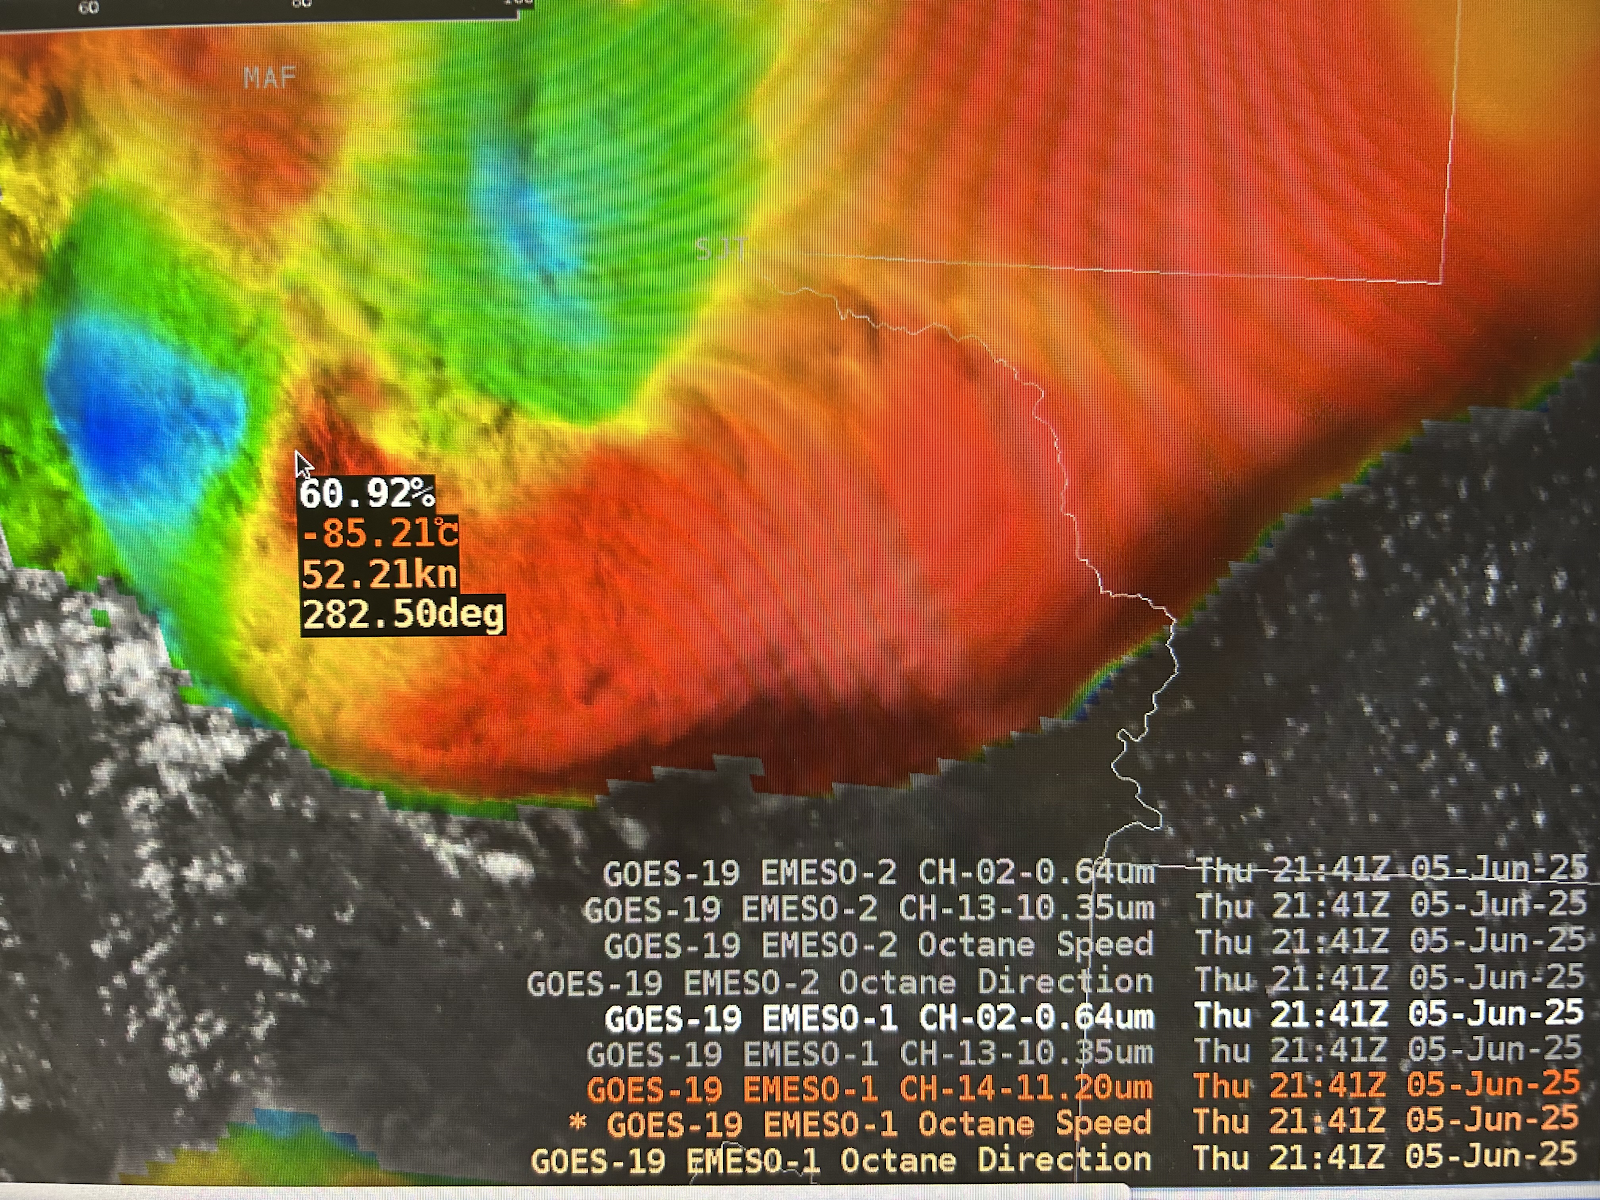
Later on, the same cell over Hamilton County began slightly cooling again, with ProbSevere noting 59% probabilities (top left panel in Figure 5). Additionally, there was a very clear mesocyclone noted in Figure 6. Using just these two products, I may have been inclined to issue at least a SVR warning. However Octane wasn’t noting much, if any, cloud top divergence or cloud top cooling. Lightning also didn’t look very impressive either. Noting this, I strayed away from any warning issuance (especially considering radar was sampling this storm at 12.5kft), which I think was a good call, at least for this time.

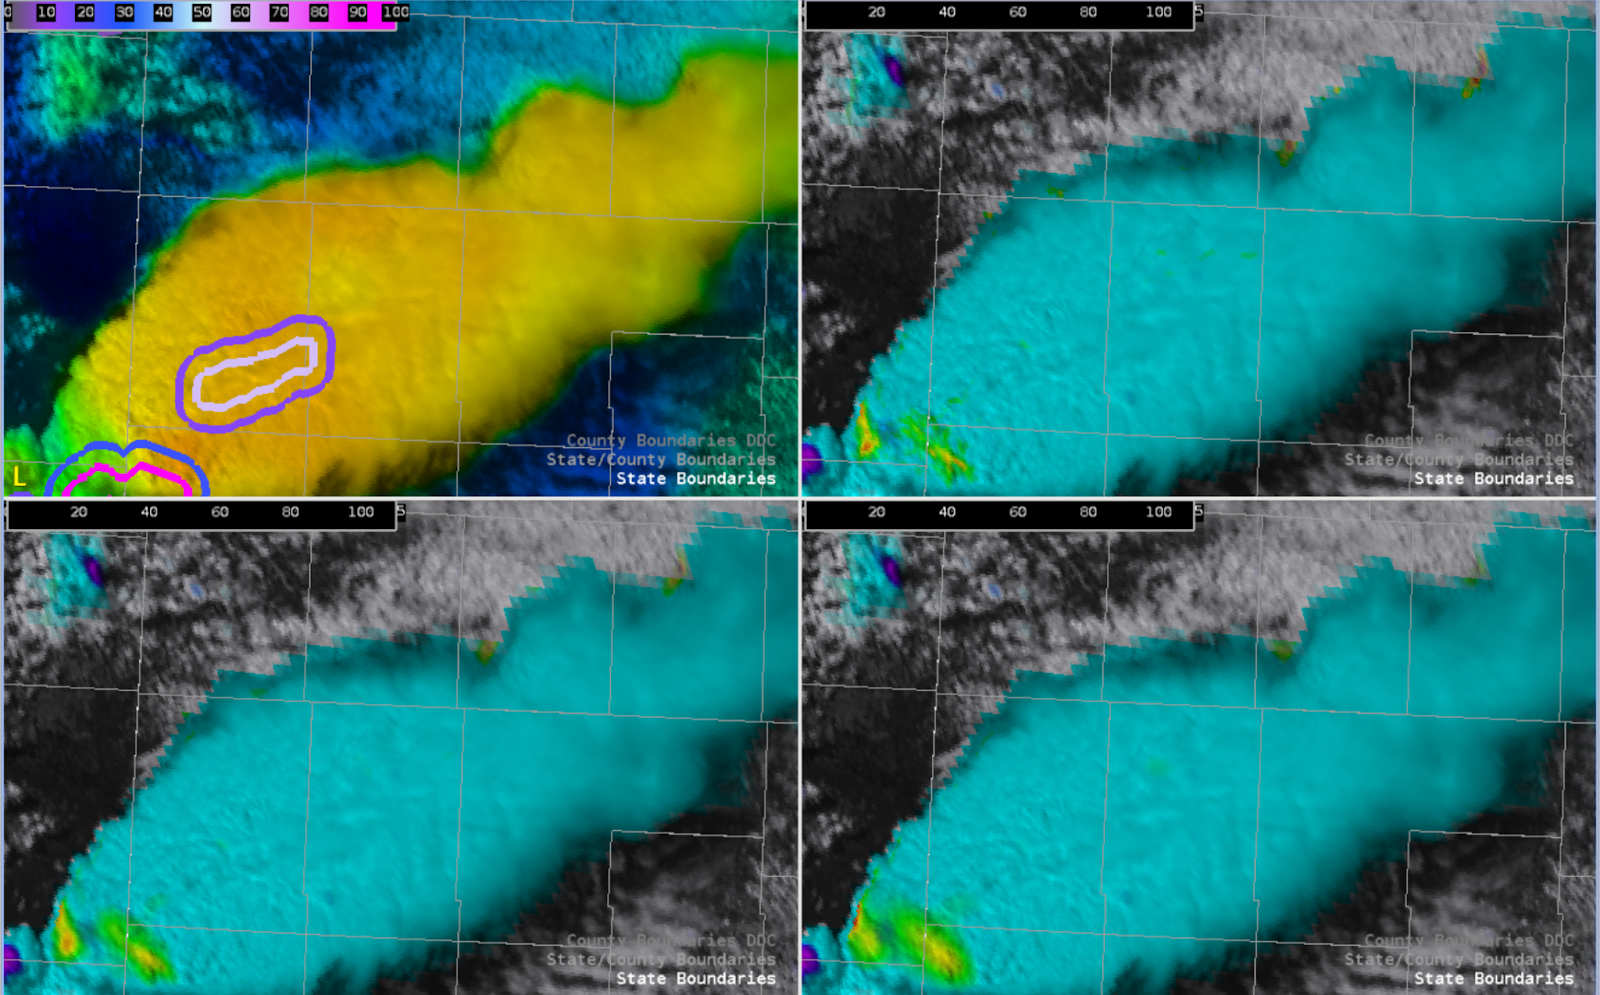
Figure 5: Octane 4-panel with ProbSevere overlaid in the top left panel

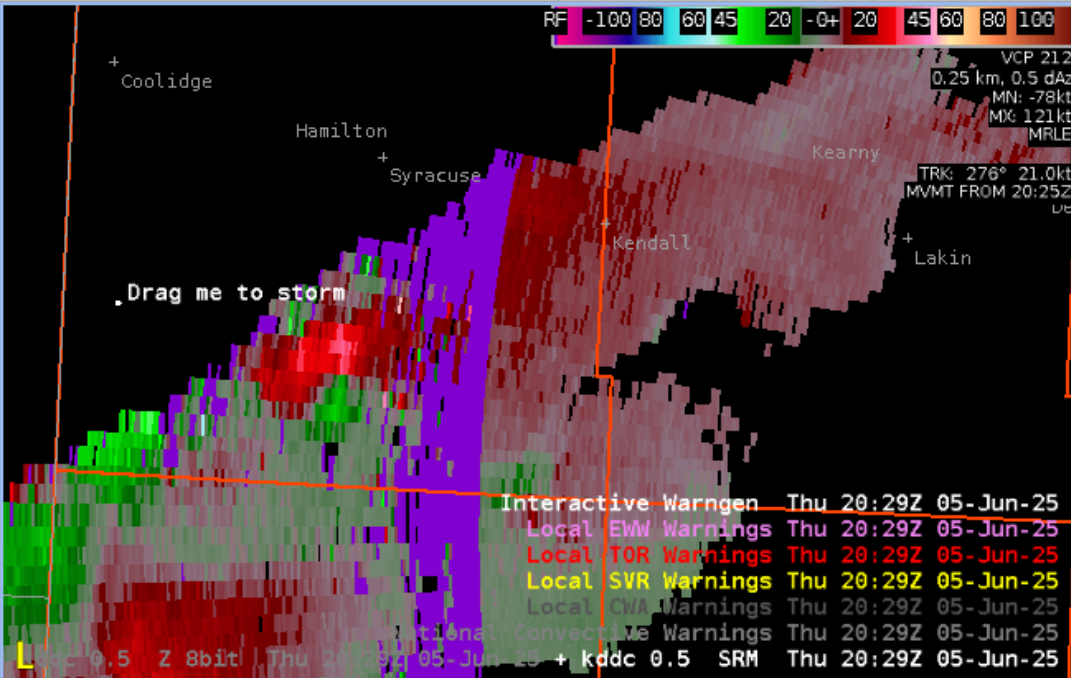
Figure 6: Storm Relative Velocity

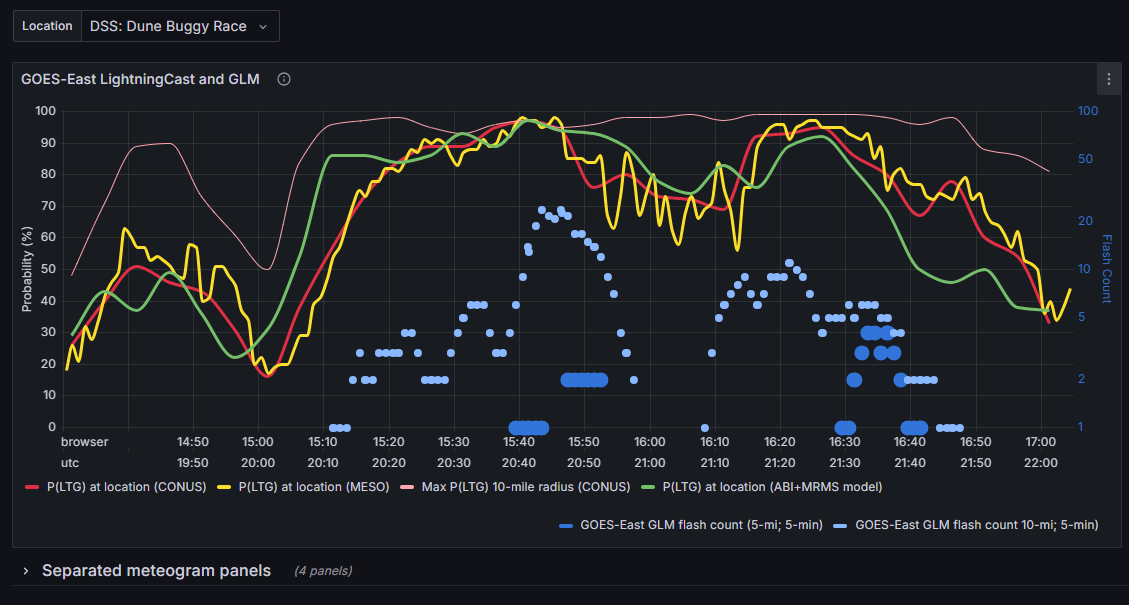
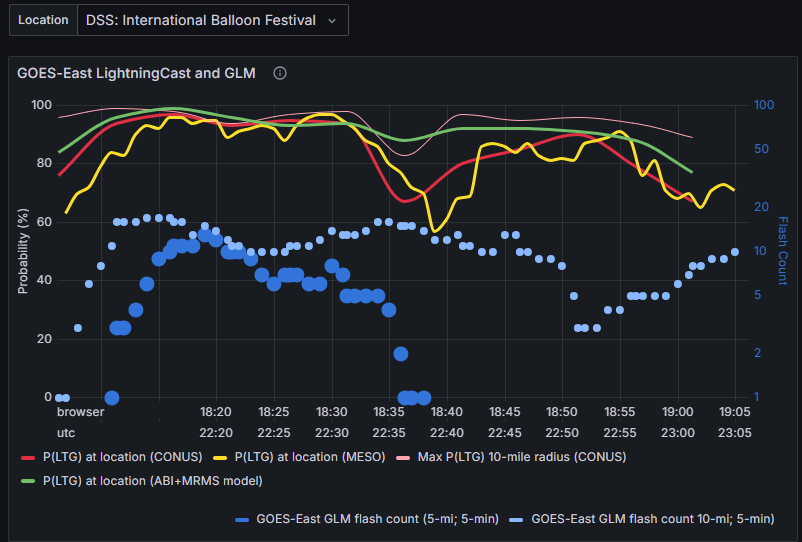
LightningCast Dashboard for the DSS Event in Dodge City

Closer to the end of operations, the LightningCast dashboard (Figure 7) started showing higher probabilities of lightning, with the Max prob for a 10-mile radius showing 77%, v1 at 45%, and v2 at 30%. There were two supercells several counties west of the event that were expected to track southeast, missing the venue, however with the dashboard and CAMs showcasing the potential for lightning to reach the event, we were confident enough to fill out a DSS form and graphic (shown in Figure 8) with this information.

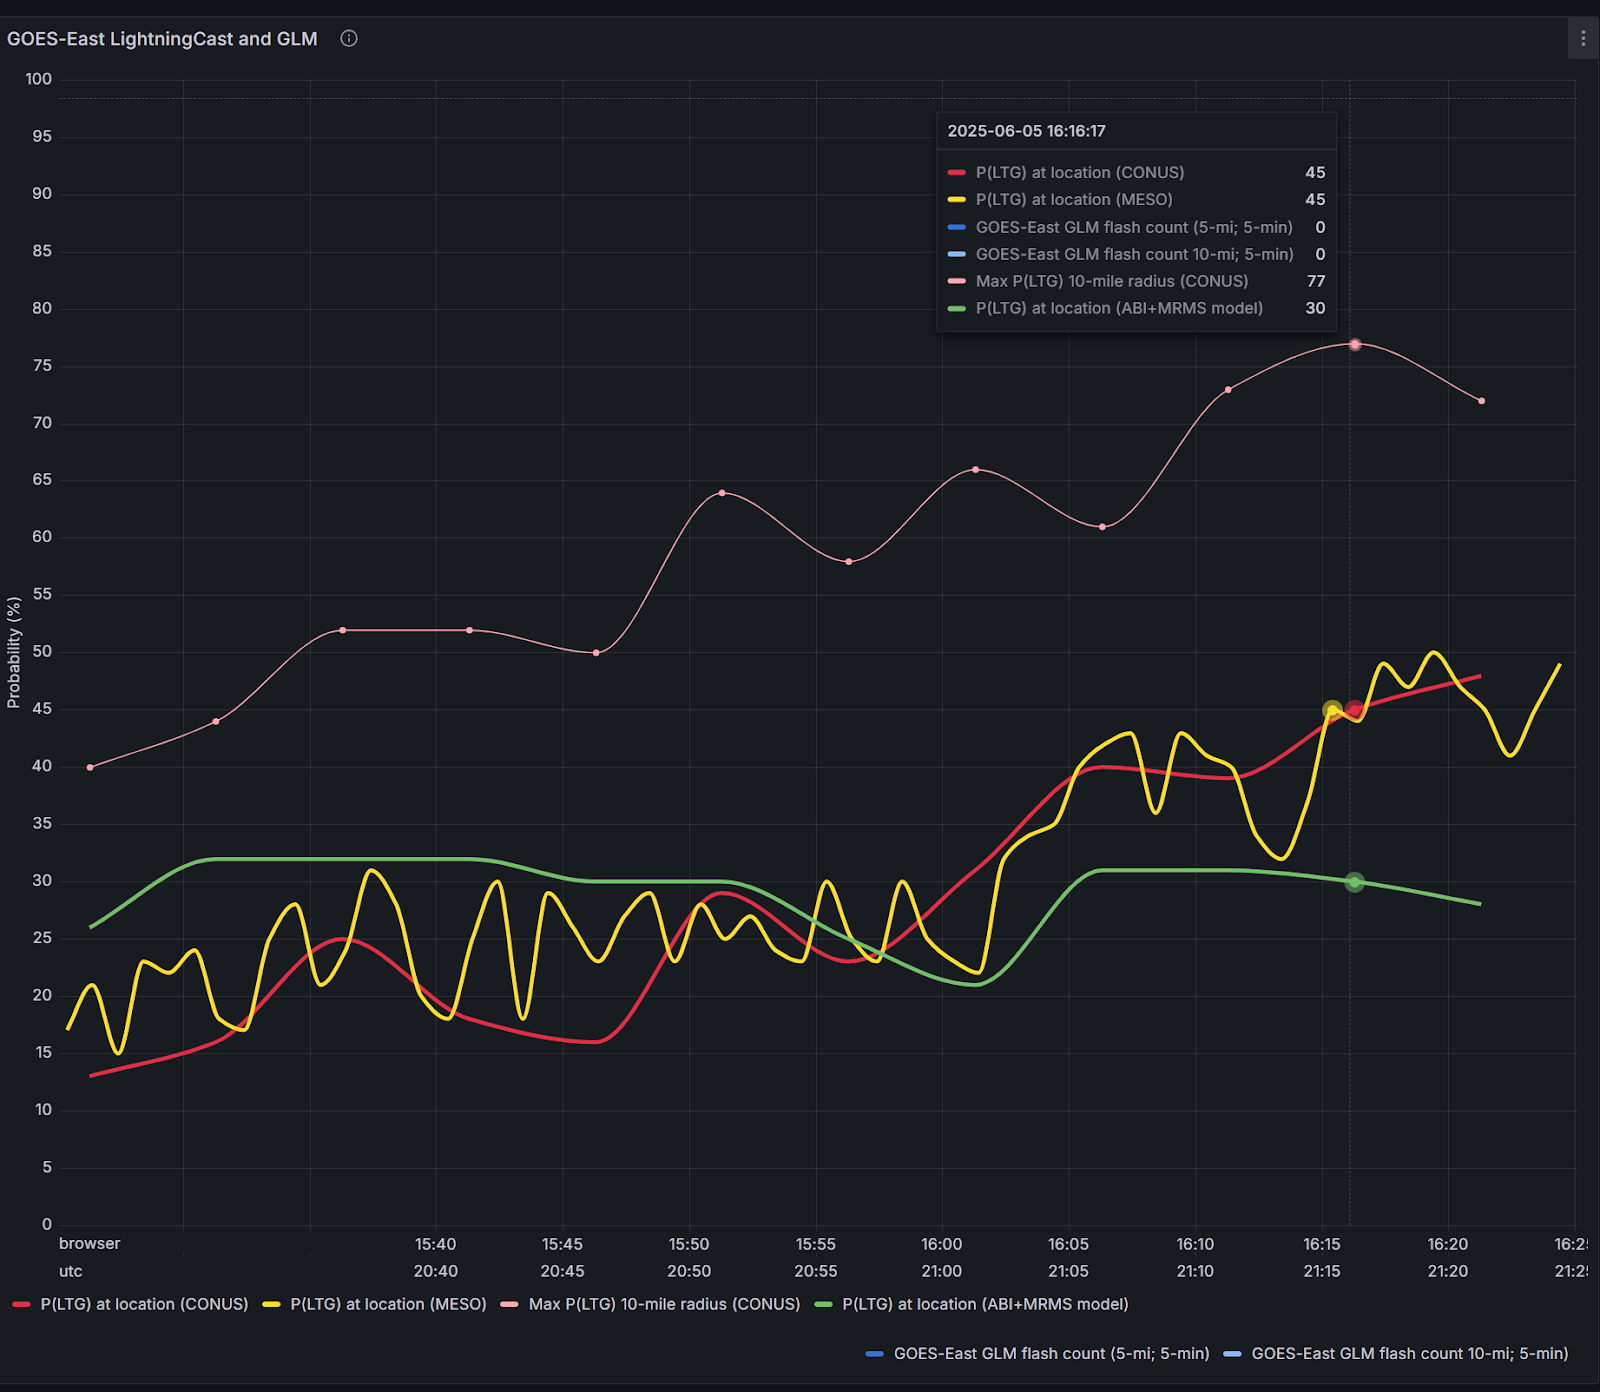
Figure 7: LightningCast Dashboard

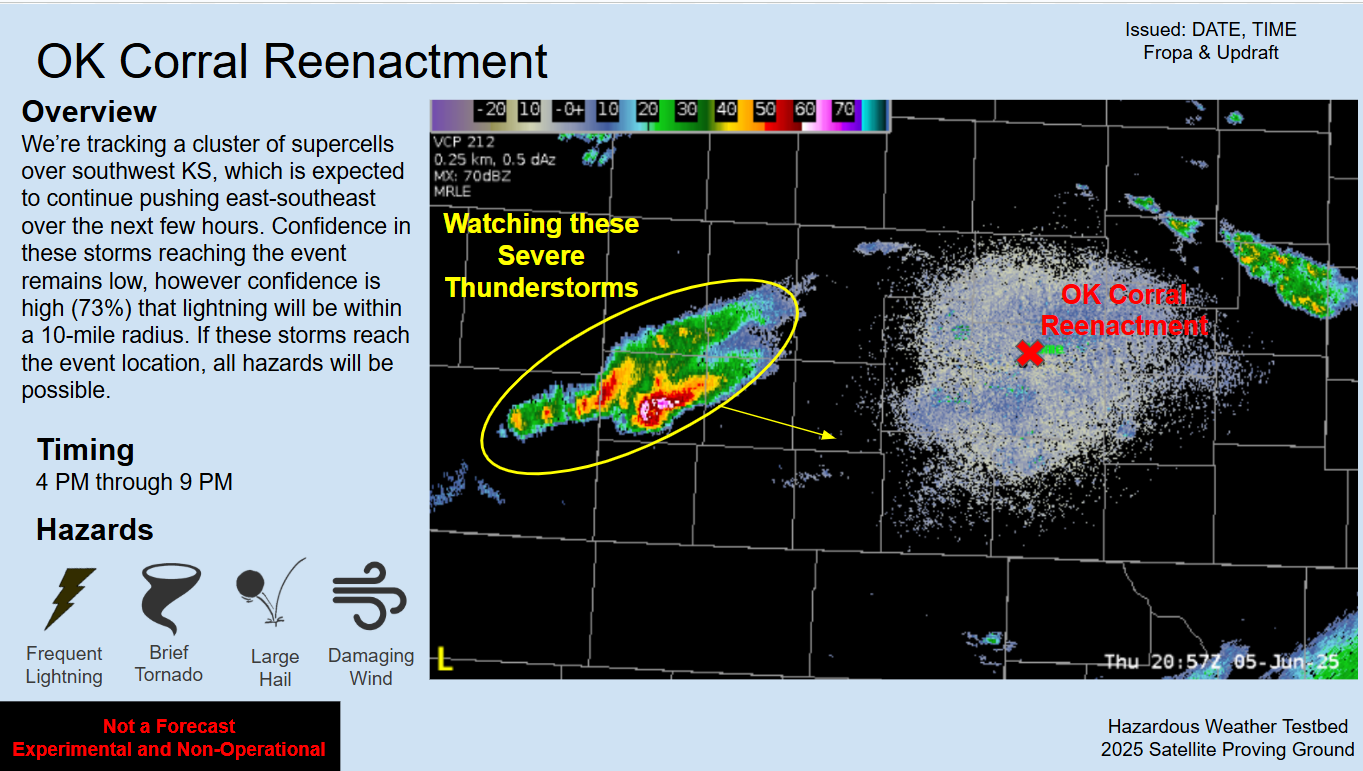
Figure 8: DSS Graphic
It should be noted that v2 only highlights a 30% probability, and later on was ~44% lower than v1 (v1 was at 76%, with v2 at 32%. With this being at the end of operations, we couldn’t see if lightning actually occurred at the event, but I’d be interested to see if v2 actually had a better grasp on the convection tracking southeast and missing the event altogether, or if v1 showcasing the higher probabilities was the better option.
Final Thoughts from Day 4:
The Octane product really shined today, both in increasing my confidence to issue a SVR warning, and in talking me down from issuing a separate warning. I’ve been sold on the Stoplight colorcurve, with no smoothing (top right panel) coming out on top.
– Fropa
Tags: None

Southwest Texas Lightning Product Performance

Lightning, and GOES-East vs. GOES-West

Observation 1: GLM discrepancies between satellites

Left: GOES-East LightningCast v1 & GLM FED        Right: GOES-East LightningCast v2 & GLM FED 1836 UTC – 1931 UTC 5 June 2025 in southwest Texas

GOES-West GLM 1911 UTC – 1933 UTC 5 June 2025 in southwest Texas (LightningCast outside the domain)

The Midland-Odessa (MAF) forecast area (and nearby upstream areas in Mexico) sits in a weird position where it is well within the GOES-East CONUS domain, but on the edge of the GOES-West CONUS domain (and thus outside the CONUS LightningCast domain), yet within the GOES-West full disk domain. The above images show GLM observations in southwest Texas from both satellites, where GOES-East shows far less lightning (and a downward trend) while GOES-West showed significantly more lightning at the same time (also with a downward trend, but still indicating a stronger storm).


Observation 2: GOES-East LightningCast performance within areas where GLM FED is underestimating


While LightningCast data is not available from GOES-West in this portion of southwest Texas to compare GOES-West v1 vs. v2 as well as East vs. West, the quality of the GOES-East LightningCast product in areas with potentially degraded GLM observations raises an interesting question about how the models perform in this situation.

In the first GOES-East LightningCast loop shown above, version 1 and version 2 generally seem to perform very similarly, likely because of poor radar coverage and data availability. (See RQI image for the area below). Version 1 picks up on a contour of 70% ProbLightning for a developing storm to the northwest of our main cell at 1856 UTC, roughly the same time as Version 2, giving roughly a 20 minute lead time, with the first strike via GLM around 1916 UTC. Version 1’s 70% contour is larger and remains larger than version 2 for the first 10 minutes or so, before both products begin matching closely around the time of first lightning detection. Version 2 then quickly begins downtrending on that cell, seeming to pick up on lightning cessation prior to version 1 does.

Observation 2.5: GOES-East LightningCast DSS Dashboard

This storm impacted our DSS event. At 1955 UTC, DSS was provided to the partner that “lightning will be within 10 miles of the event within the next 30 minutes (by 2030Z) from a storm roughly 30 miles south-southwest of the location (the larger, southernmost storm in the GOES-East loop), a Severe Thunderstorm Warning has been issued for that storm just south of them but the warning doesn’t encompass the event, and that additional convection is going up north of the event, which may also bring lightning within the 10 mile range of the event.”

GOES-East LightningCast DSS Dashboard.

The decision to contact the partner about the DSS event at 1955 UTC was made with the help of the LightningCast DSS Dashboard, which had a max probability of lightning within the 10 mile radius of the event at 90% at the time of the contact. They were told they had less than 30 minutes before lightning was within 10 miles, and 20 minutes after that call, the first GLM strike was observed in that radius. Negating the time it took to fill out the DSS form online in comparison to picking up the phone, the DSS provided to the partner based on the dashboard output was 10 minutes late on onset, but could have been spot-on if the DSS call was provided immediately after the 10-mile radius probability reached 90% instead of waiting to see persistence before calling the partner.

Back to observation 2: GOES-East LightningCast performance within areas where GLM FED is underestimating

Also in the GOES-East LightningCast loop, there is a lower probability contour in the farthest northwest corner of the image at the beginning of the loop. Both versions pick up on it, and both versions go back and forth between characterizing this small bullseye area as continuous/connected to the two storms to its southeast and discrete. Version 2 indicates 50% probabilities briefly, while Version 1 does not. Both have probabilities dropping <10% at the same time, and lightning was never observed.

MRMS radar quality index

– prob30

Tags: None

Lightning Dashboard IDSS

For Day 4, we were DDC. There was an outdoor event ahead of the convection, and prob lightning did a great job 1) detecting some convection ahead of it and 2) showing that it would be east of our IDSS event.

The animated GIF above shows both versions of the lightning cast, with the outdoor event marked by the “Home”. In this case, both versions accurately predicted lighting (white dashes), and also showed it staying east of the event.

– Updraft

Tags: None

Warning Without Radar Data in Northern New Mexico

Day 3 of the testbed offered a unique opportunity to issue real-time warnings without access to radar data. Having never been in such a situation before, it was an eye-opening experience.

Mesoanalysis showed very steep lapse rates, a long and straight hodograph, high LCLs and a fairly deep mixed layer with relatively low surface dew points. This allowed us to key in on large hail and severe winds being the primary hazards. Additionally, equilibrium levels were only around 9km so hail much larger than 1” was determined to be unlikely.

We issued our first warning upon noticing a rapid uptick in updraft intensity on OCTANE, which showed cooling cloud tops, fast motions, and strong divergence aloft. This storm was located west of Albuquerque in a sparsely populated area so it is difficult to say if the warning verified or not. Gremlin showed a similar uptick in simulated reflectivity which added weight to our decision to warn.

We issued additional warnings as the storm traveled into the Albuquerque area. A second and third cell began to strengthen as well, and two more warnings were issued with the southwest storm looking the most intense on OCTANE. Our mesoanalysis determined that the low-level cumulus field east of the northeastern cell appeared flat and was therefore stable…so weakening was anticipated as it moved off the Raton Mesa.

As expected the northeastern cell began to weaken and dissipate, which was evident on OCTANE and Gremlin. The two cells further southwest continued to look strong, and warnings were maintained into the Albuquerque metro. A hail report of 1” was received at this point on the southern margin of the city.

Lastly, lightningCast showed the northeastern cell begin to weaken before its appearance on satellite degraded significantly. This allowed us to cancel the warning early, in conjunction with noticing the downward trends in OCTANE (weakening cloud top divergence).

During the course of the event we had to keep tabs on a fictitious DSS event, and used LightningCast and its associated dashboard to determine when lightning was approaching their critical threshold (10 miles). LighgtningCast did a good job with lead time as it had 70 percent or higher before any lightning was detected nearby.

– WxAnt

Tags: None

ProbLightning Ending Time

For Day 2, we were the Wichita Office. Our IDSS event had a high probability of lightning. Our group had a discussion about the idea of “lighting ending”, as that is a common question from outdoor events. In this case, ProbLighting did a great job of forecasting the ending time of lightning by using the time of arrival tool on the back gradient of the convection. Of course this would not work for back building storms or new development, but it performed well in this case. We incorporated that time info into our messaging.

The image above shows the ProbLighting (V2, left, V1 right) with ENL pulses on the left. This time of arrival tracker is shown in white on the left. Unfortunately AWIPS locked up toward the end, but this time of arrival gave a fairly accurate forecast that was used in the graphic.

The image above shows the graphic that we created at 346pm that showed the storms ending at 6pm using the time of arrival tracker on the back side of the Prob Lightning gradient. This turned out to be fairly accurate. In a real scenario, we could have probably briefed this information out to the decision maker.

– Updraft

Tags: None

ICT Convection with Octane and LightningCast

 LightningCast

The LightningCast contours didn’t provide much insight due to high probability (>90%) of lightning pretty much the entire event. However we were able to utilize the dashboard for a DSS event. In Figure 1 below, the first thing I noticed was that the first lightning flash was recognized at approximately 2:57PM CDT where both v1 and v2 showed 90-100% probabilities. Looking back within the past hour at around 2:05 PM (not shown in the image), probabilities of lightning occurring within the next hour were approximately in the 50-60% range. It makes sense that the probabilities would increase with shorter lead times, however if this were being utilized for a DSS event and a partner was briefed at 2:05pm, they might decide to take a risk and hold off on sheltering since the probability is only 55% (therefore giving them a 50/50 chance in their eyes). Whereas around 2:20 PM when the probabilities started increasing to 80+%, there was only about a 30 minute lead time at that point. So the DSS events that require additional lead time due to further sheltering options or larger crowds may not be able to fully shelter by the time the first lightning flash occurs.

All that to say, I really like the utilization of this dashboard, however it would need to be used with additional tools (satellite, radar, etc.) in order to provide the most accurate information.

Figure 1: LightningCast Dashboard

Another item that was pointed out was that in Figure 2 below, you can see that the probabilities in v1 (red line) start to decrease around 4:10pm whereas v2 (green) remains above 95%. This could be due to the fact that maybe there were warming cloud tops, however with the ongoing lightning flashes in the vicinity, v2 would be the more reliable tool in my opinion

Figure 2: LightningCast Dashboard

Octane

The first cell that caught our attention was the cell in southwest Butler County. Figure 3 below shows the cloud top cooling and cloud top divergence (top right and bottom two panels), and you can see that cell shoot up with decent divergence aloft. We didn’t end up warning on it since radar looked pretty subsevere, however it was a good situational awareness tool to keep an eye on where the stronger storms were located.

Figure 3: Octane four panel

Later in the period, we did end up issuing two different warnings. The gif below (Figure 4) honestly doesn’t do it justice since I grabbed it a little too late, but there was a pretty pronounced divergence signature that started in Harper County near the city of Anthony that later pushed east into Sumner county. With the divergence remaining consistent and radar showing a pretty good wind signature, we ended up issuing a warning.

Figure 4: Octane four panel

I messed around with the colortables a little bit in Octane, switching to a stoplight color scale for the divergence and the magenta hue for the cooling. I’m still not fully sure which colorscale I prefer, so I’ll need to continue playing with both. However, comparing the three smoothing techniques for the divergence, I found myself looking at the highest smoothing (bottom right panel) more frequently since the lowest smoothing (top right panel) often looked too noisy. I think for situational awareness and assessing which storms to dive deeper into, the highest smoothing should work well.

-Fropa

Tags: None

PUB LightningCast and GREMLIN Nowcasting

LightningCast

For this first day, I started out looking at Lightning Cast to gain familiarity with version 2 and see how it compares to version 1. The first thing I noticed was in southwest Pueblo County, where there seemed to be fairly frequent lightning. Version 1 in the top left panel (Figure 1 below) actually decreased in probability from 70% to 50%, whereas Version 2 in the top right panel remained at 70%. With both GLM and ENTLN depicting ongoing lightning, I think both versions should be showing higher probabilities. I’m wondering if it’s because both versions are so focused on the convection moving into southeast Pueblo County that they’re less focused on the stratiform lightning/less mature convection?

Figure 1: Four panel comparing LightningCast v1 (left panels) and LightningCast v2 (right panels)

Additionally, I tested out using the LightningCast dashboard for Fowler, CO beginning at 3PM MDT. One interesting thing to note was that it seemed to match better with the version 2 LightningCast in AWIPS versus with version 1, however both versions weren’t too far off. In the Figure 2 below, the left panel (version 1) shows between 30-50% probability of lightning, whereas the right panel (version 2) shows Fowler (purple dot in the image)  right on the border of the 70% probability. Comparing that to the dashboard (Figure 3) for the same time, the yellow line (version 1) depicts a 54% probability, with the green line (version 2) showing an 84% probability for 21:18Z. With MRMS reflectivity at the -10C level showing a cell up to 42 dBz just southeast of Fowler, I would tend to lean towards utilizing version 2.

Figure 2: LightningCast v1 (left panel) and LightningCast v2 (right panel)

Figure 3: LightningCast Dashboard

One final note on the LightningCast Dashboard – I thought it was interesting to see that version 1 in Figure 4 below, the yellow line (version 1) shows two separate upticks in lightning probability versus the green line (version 2) showing a steady decline in probability.

Figure 4: LightningCast Dashboard

GREMLIN

I was also able to look at GREMLIN, which was my first time assessing this product. Figure 5 below shows a four-panel, with GREMLIN (top left), MRMS Reflectivity (top right), Satellite IR sandwich (bottom left), and GLM Flash Extent Density (bottom right). Just looking at MRMS and IR, the first cell that draws my attention is the cell in southeast Pueblo County as it has higher reflectivities and cooler cloud tops. The cell in southern Otero county looks like the cloud tops are slightly warming with time. However once we start looking at GREMLIN, those two cells look to go back and forth in reflectivity, leading to less confidence in overall intensity. If I were located in an area with poor radar coverage, or if a radar was down and I had to rely on GREMLIN, it may not be straightforward as to which cell could eventually warrant a warning.

Figure 5: Four Panel comparing GREMLIN (top left), MRMS Reflectivity (top right), Satellite IR Sandwich (bottom left), and GLM (bottom right).

That being said, Figure 6 below shows a screenshot of the same four-panel at 21:41Z, which shows GREMLIN having a pretty good grasp on the convection in Stanton and Morton counties (just outside of the PUB CWA). So in this instance, confidence in the GREMLIN product would at least be higher than the previous example shown.

Figure 6: Four Panel comparing GREMLIN (top left), MRMS Reflectivity (top right), Satellite IR Sandwich (bottom left), and GLM (bottom right).

Final Thoughts for Day 1

Overall I enjoyed testing out both of these products. I definitely want to get more hands-on experience with GREMLIN as well as the LightningCast dashboard in order to see these in different scenarios/environments.

– Fropa

Tags: None

LightningCast for Convective Initiation and IDSS

LightningCast V2 did a great job predicting lighting development with developing convection along a frontal boundary in northwest Iowa. It outperformed version 1, as shown by the loop and images below.

Animated GIF showing LightningCast V1 (top) and V2 (bottom) with the day cloud phase darkened to show detail. The ENI total lighting (yellow CTG flashes, white cloud flashes) is also displayed.

At 1946Z, V2 has a higher probability of lightning (50%) than V1 (30%).

This trend continued throughout, and at 2016Z the first lighting strike was detected. That’s 30 minutes of lead time, which would be helpful for outdoor event IDSS.

LightningCast at 2016Z with initial cloud to ground strike shown in the yellow dash.

– Updraft

Tags: None

LightningCast Dashboard

One of the more useful features for DSS messaging today was the Dashboard Request Form for values at our State Track Meet. Since we were operating under the assumption that the go or no-go threshold for this event was lightning within 10 miles, I liked using the dashboard but isolating the Max P 10-mile radius line in pink.

One note of feedback I had was to add some context for what we’re looking in each line at by noting where the data comes from in the legend. I was able to verbally ask a visiting scientist exactly what each line meant and where the data comes from, but this may not always be an option. The suggestion we came up with was adding (5-min, CONUS) and (1-min, MESO) to the legends circled in red so that it’s clear that the 5 minute data came from the CONUS satellite and the 1 minute data comes from one of the mesosectors.

– millibar

Tags: None