Can PHS Improve Mesoanalysis and Near Term Convective Forecasts?

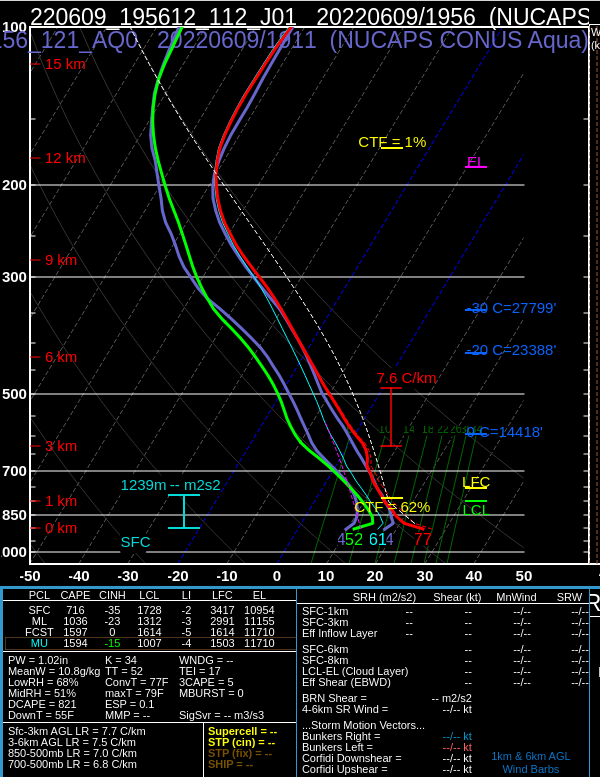
A large portion of the MKX CWA was included in a MDT severe risk, so by the start of the operational period, we had to assess the evolving severe threat spreading in from the west. Meanwhile, our DSS event was the Madison Jazz Festival, which entailed a focus specifically on south central Wisconsin. The PHS CAPE forecast appeared to be a noteworthy improvement from the CAPE fields on the SPC Mesoanalysis, along with the short-term forecast on that page.

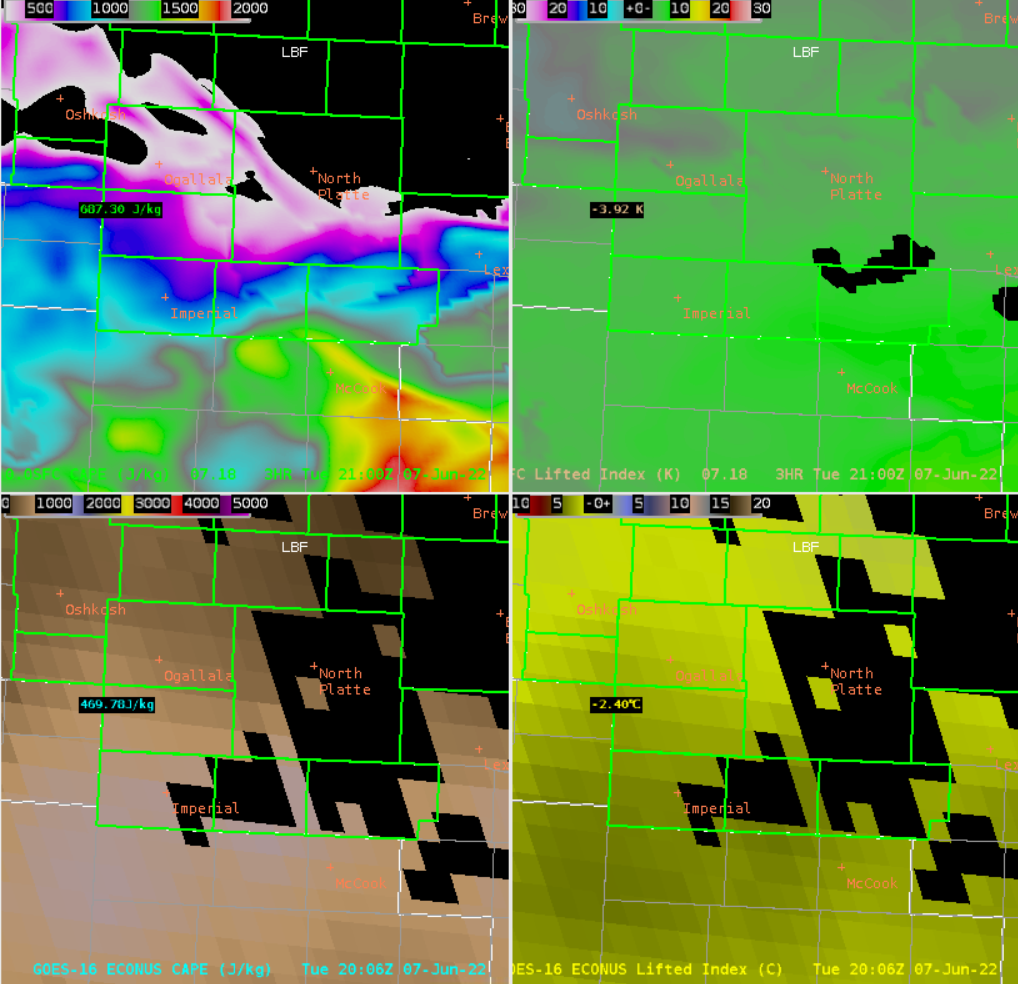
Below are the 18z through 20z plots of MUCAPE, MUCIN and effective bulk shear from the SPC Mesoanalysis page.

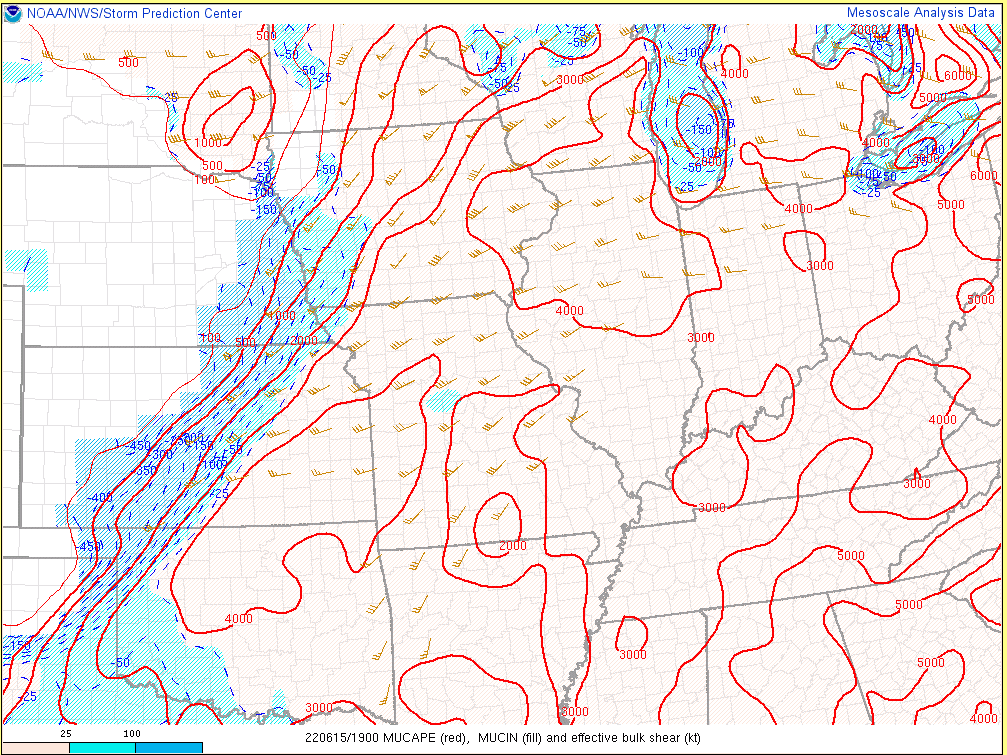
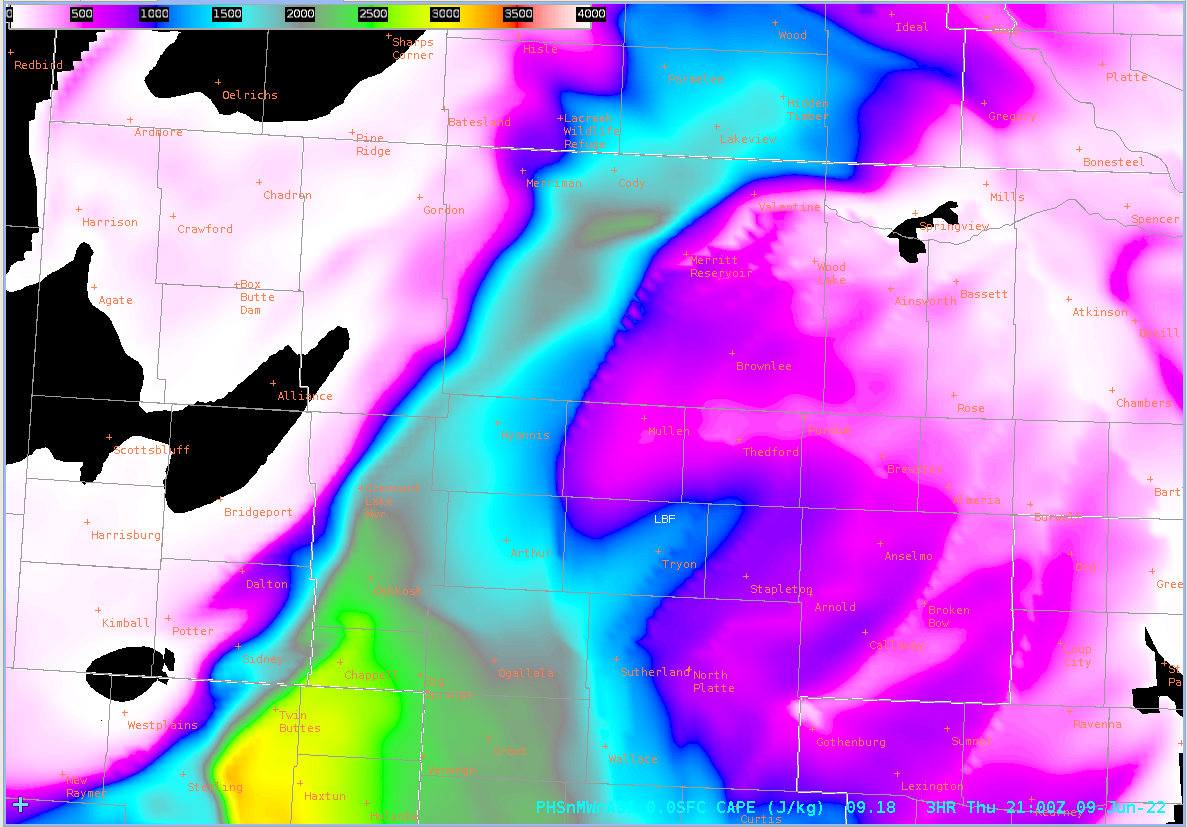
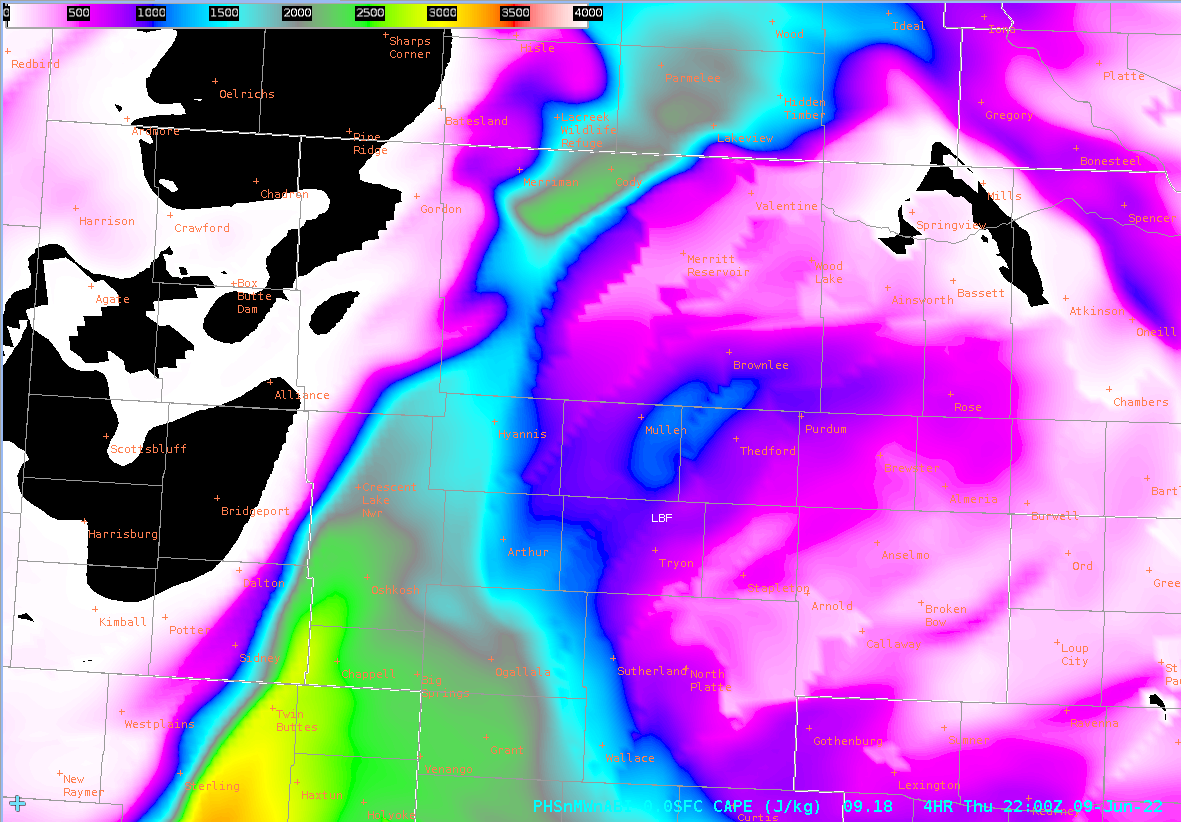
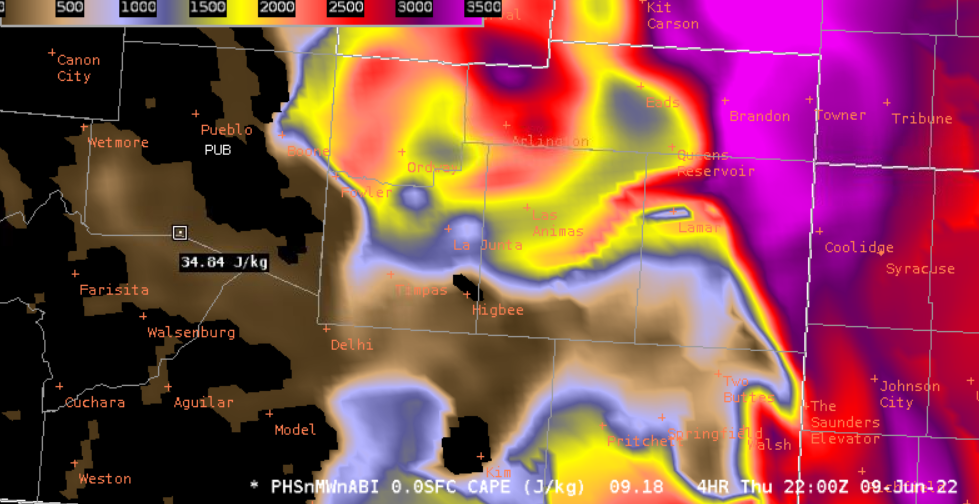
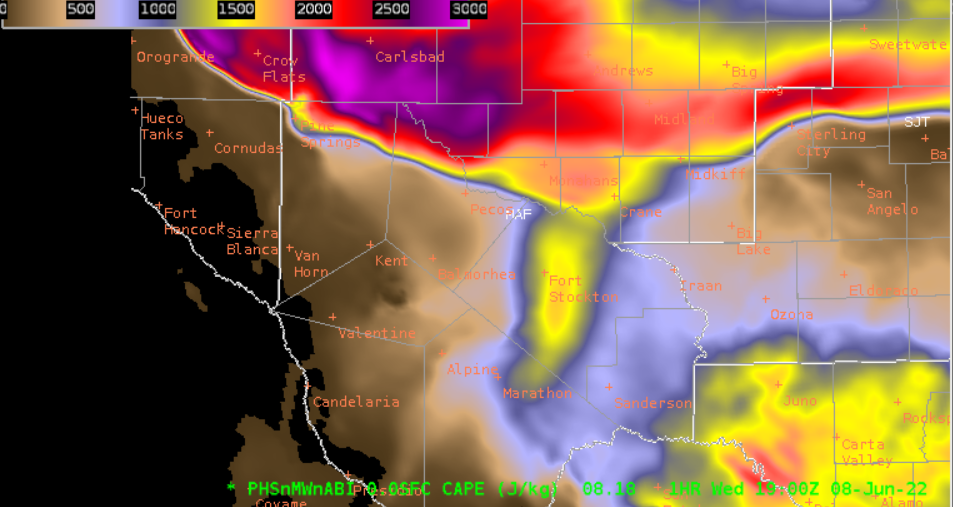
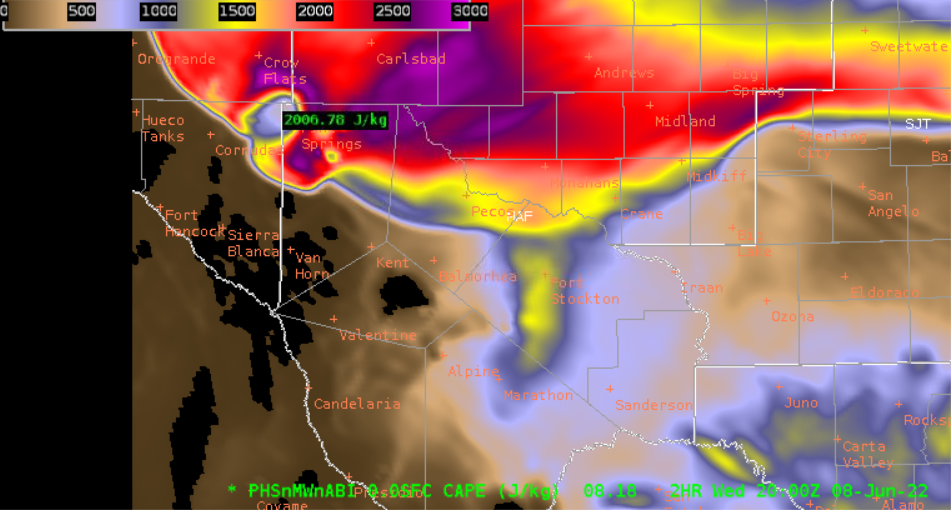
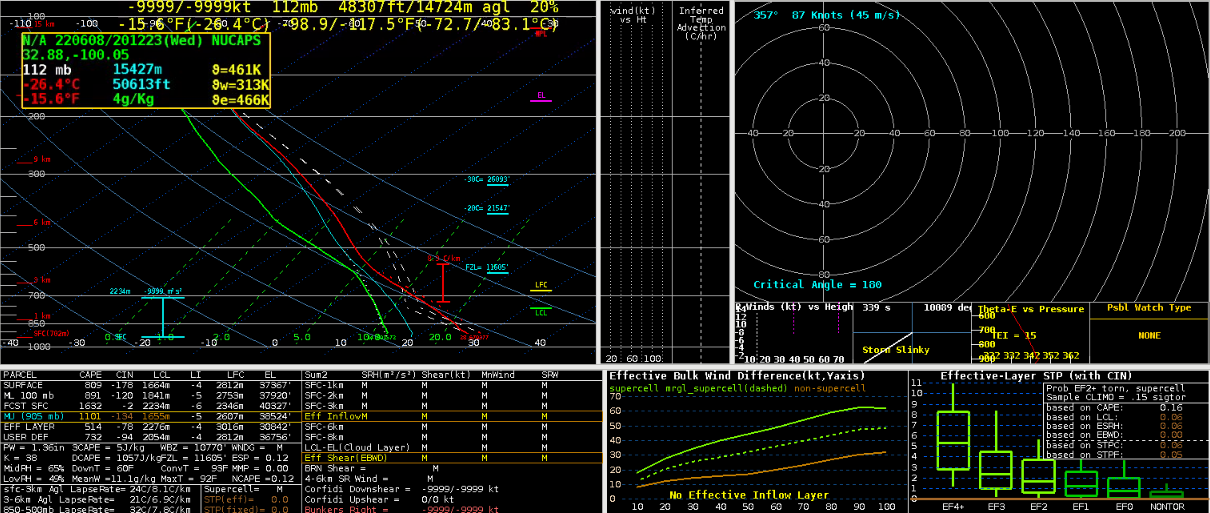
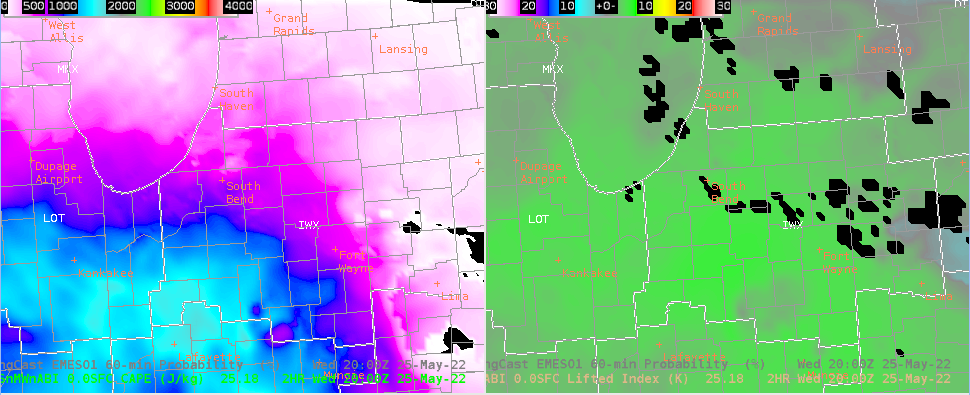
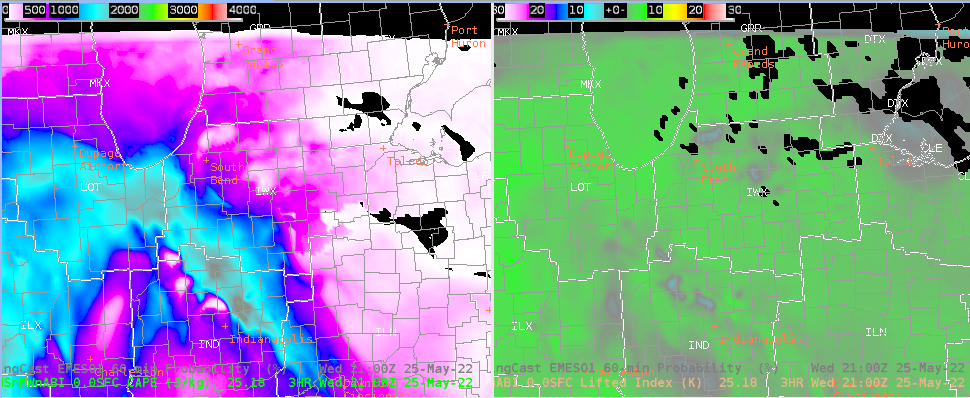
Compare the above images with 4000 J/kg of uncapped MUCAPE to the PHS MUCAPE initialization at 18z and 2-hour forecasts (19z and 20z) below.

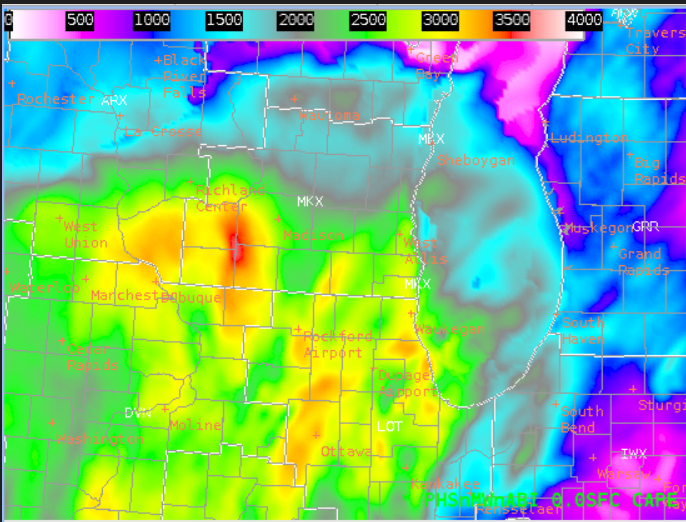
As you can see, while the SPC mesoanalysis was indicating 4,000 J/kg of uncapped MUCAPE, the PHS forecast showed CAPE decreasing across central and south central Wisconsin. This was an important and helpful piece of information for our DSS content for the Madison Jazz Festival.

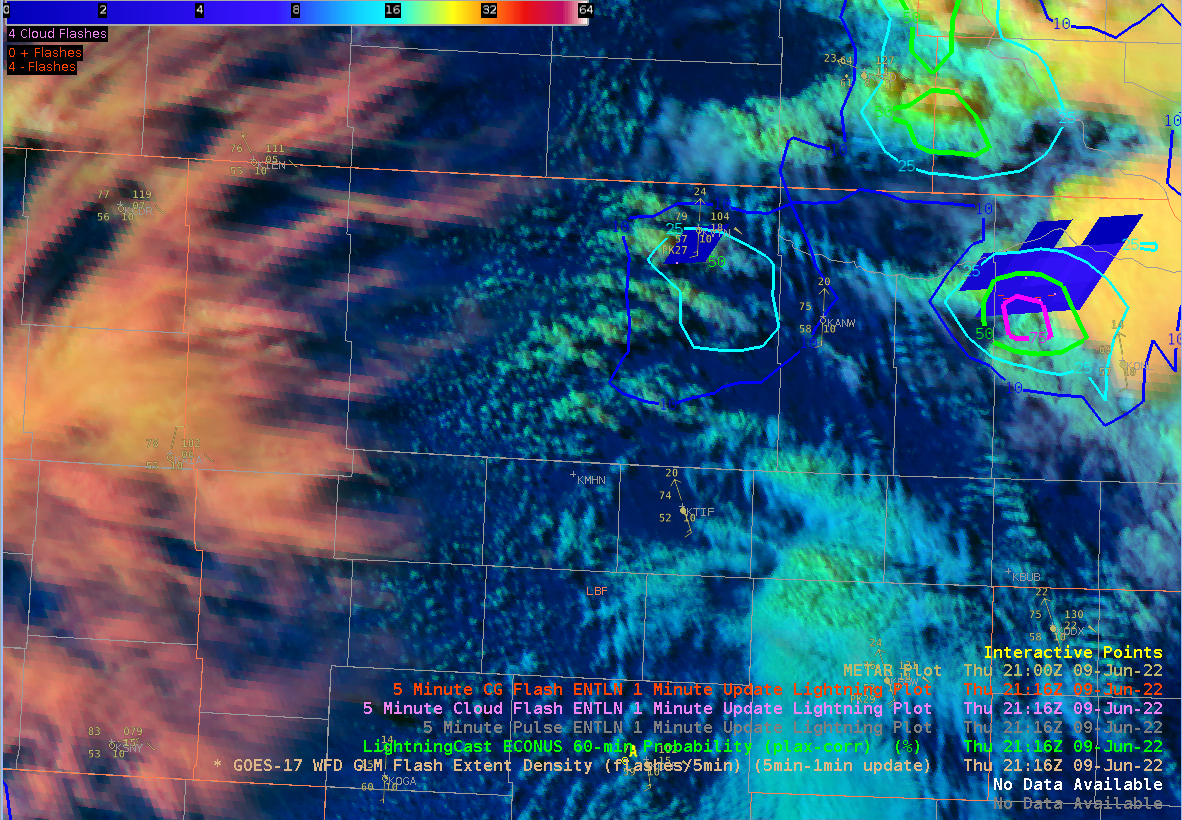
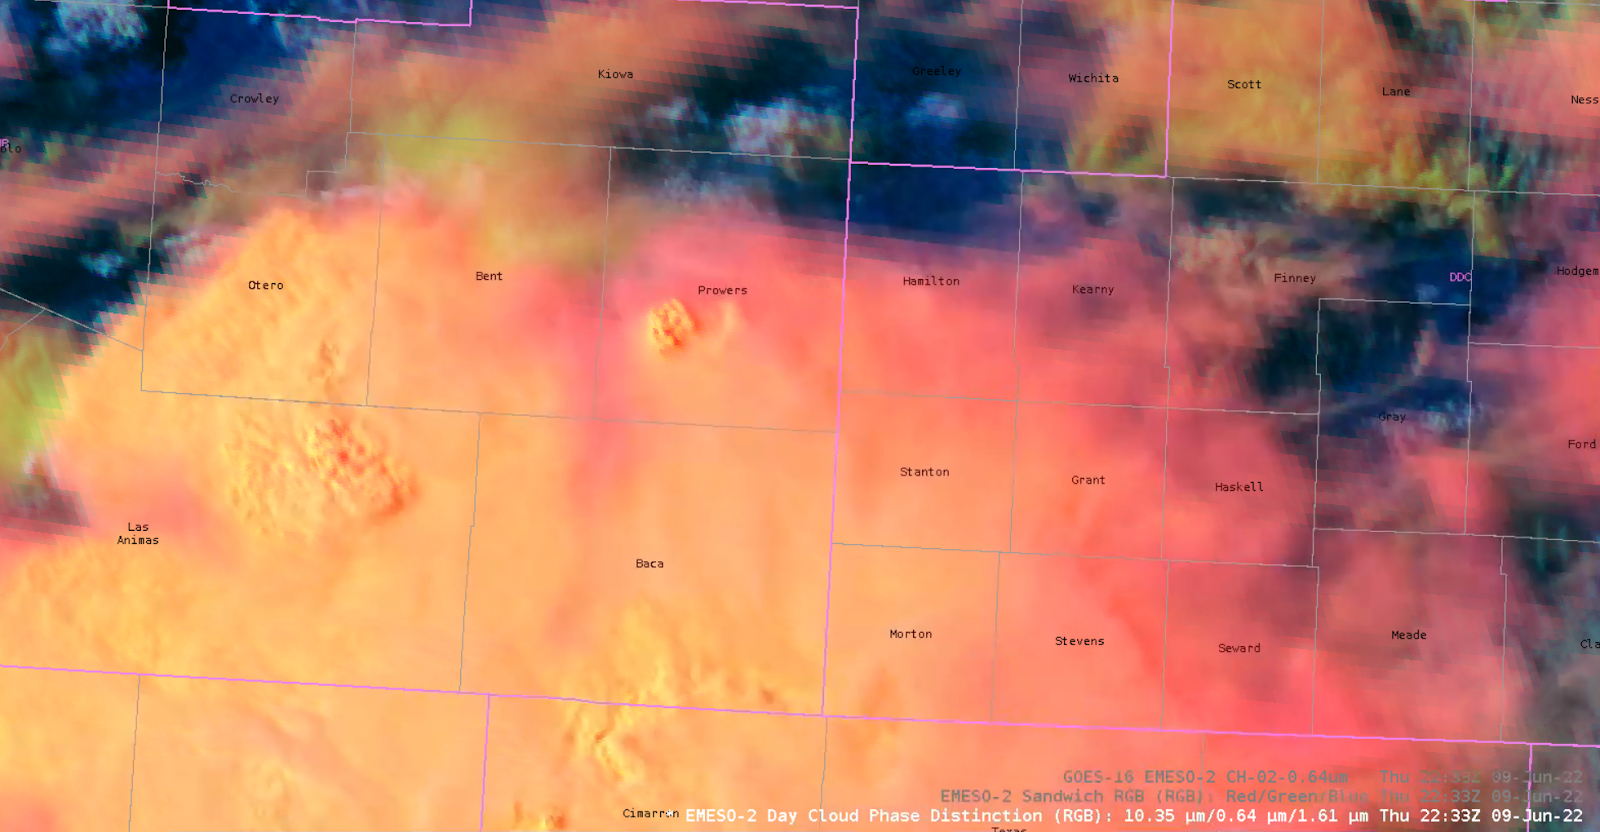
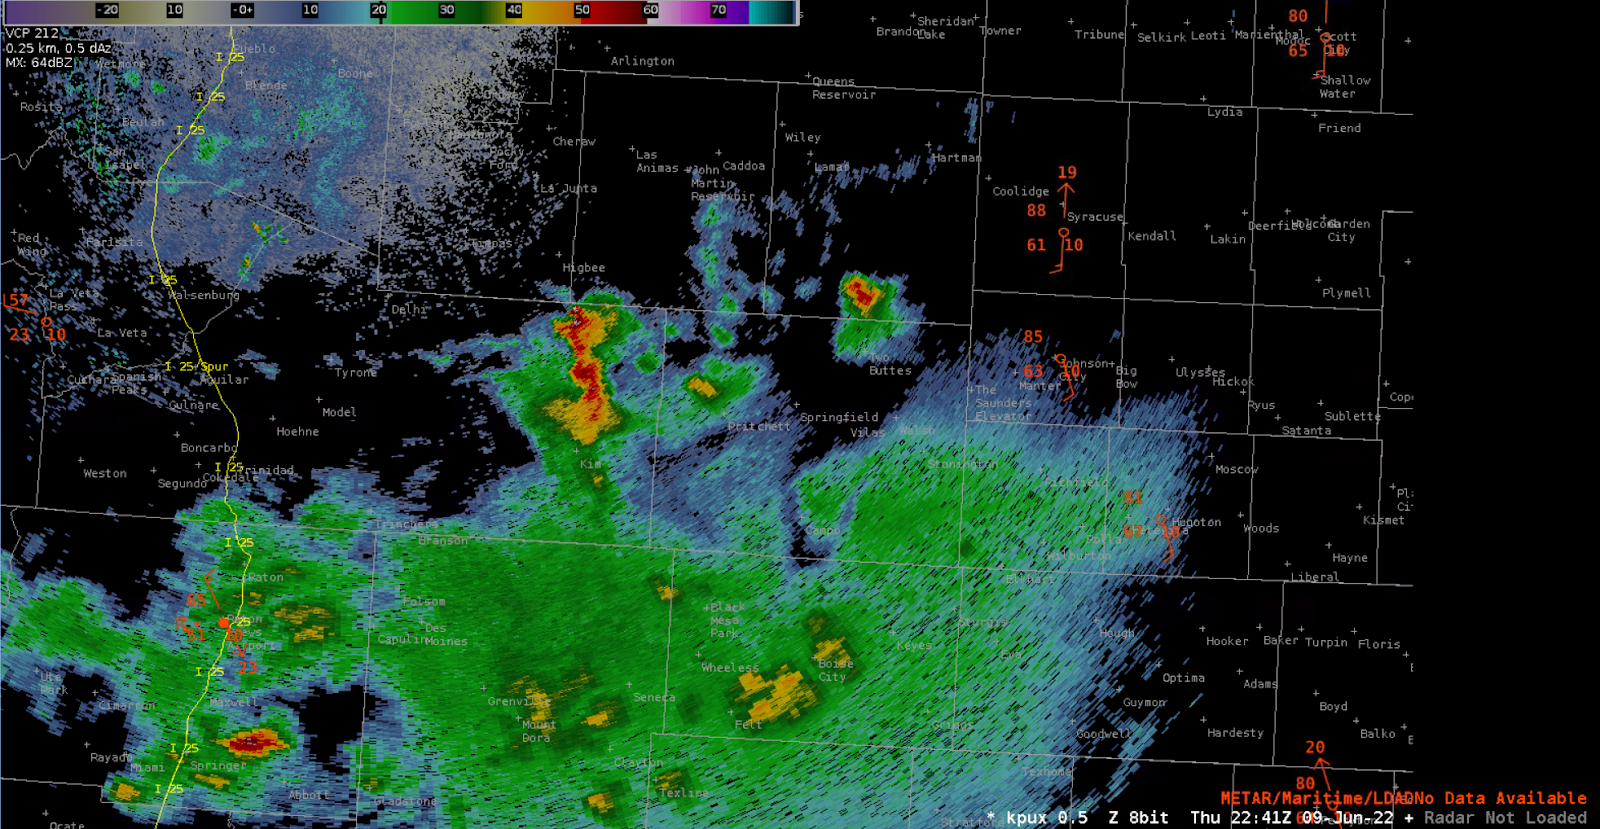
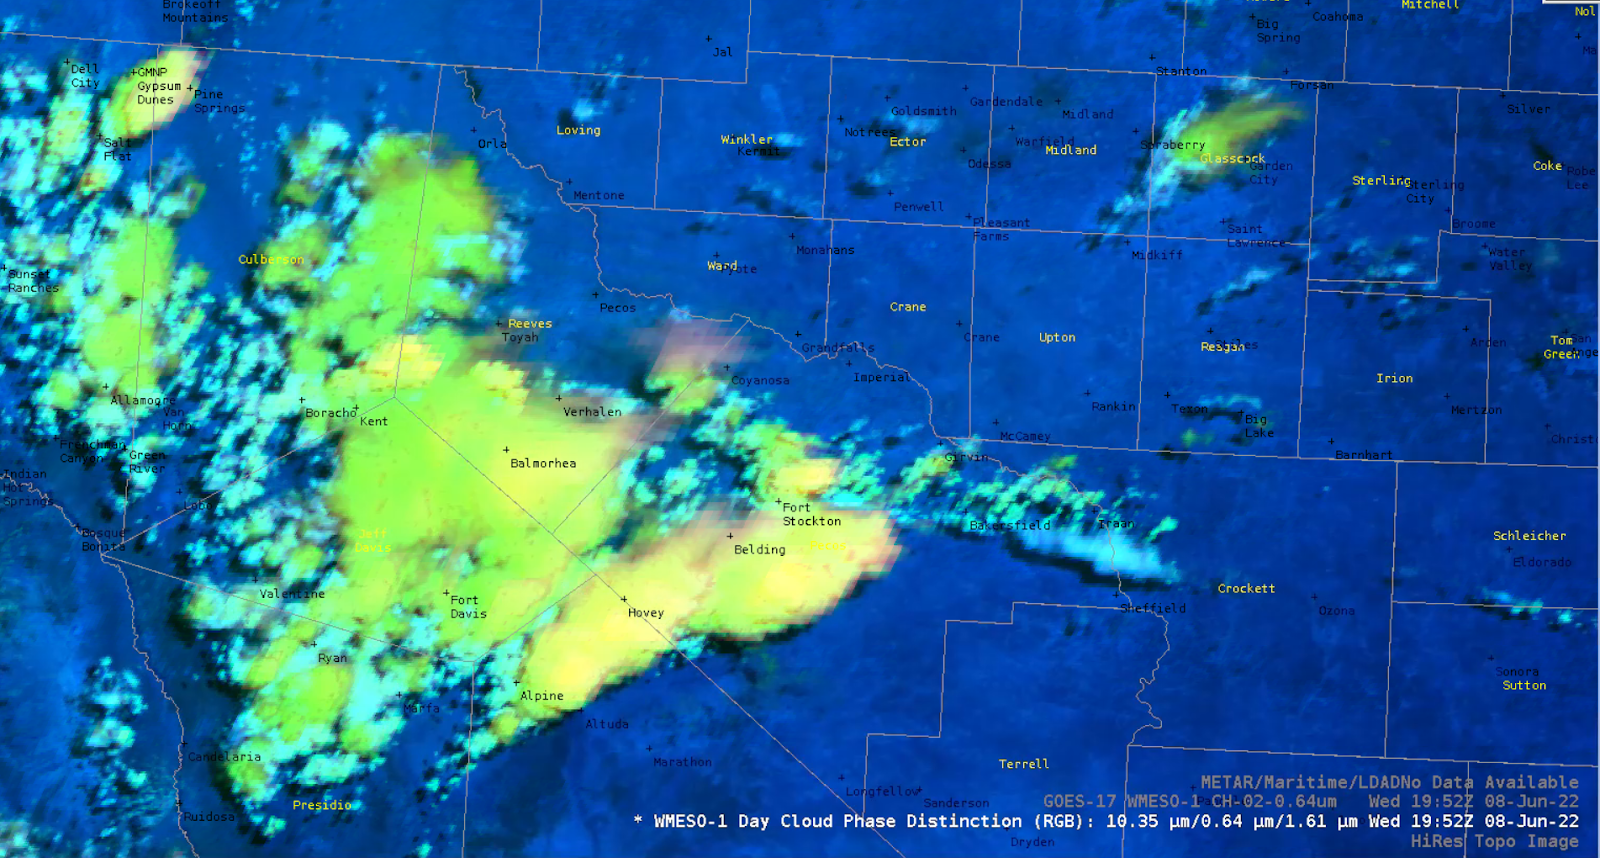
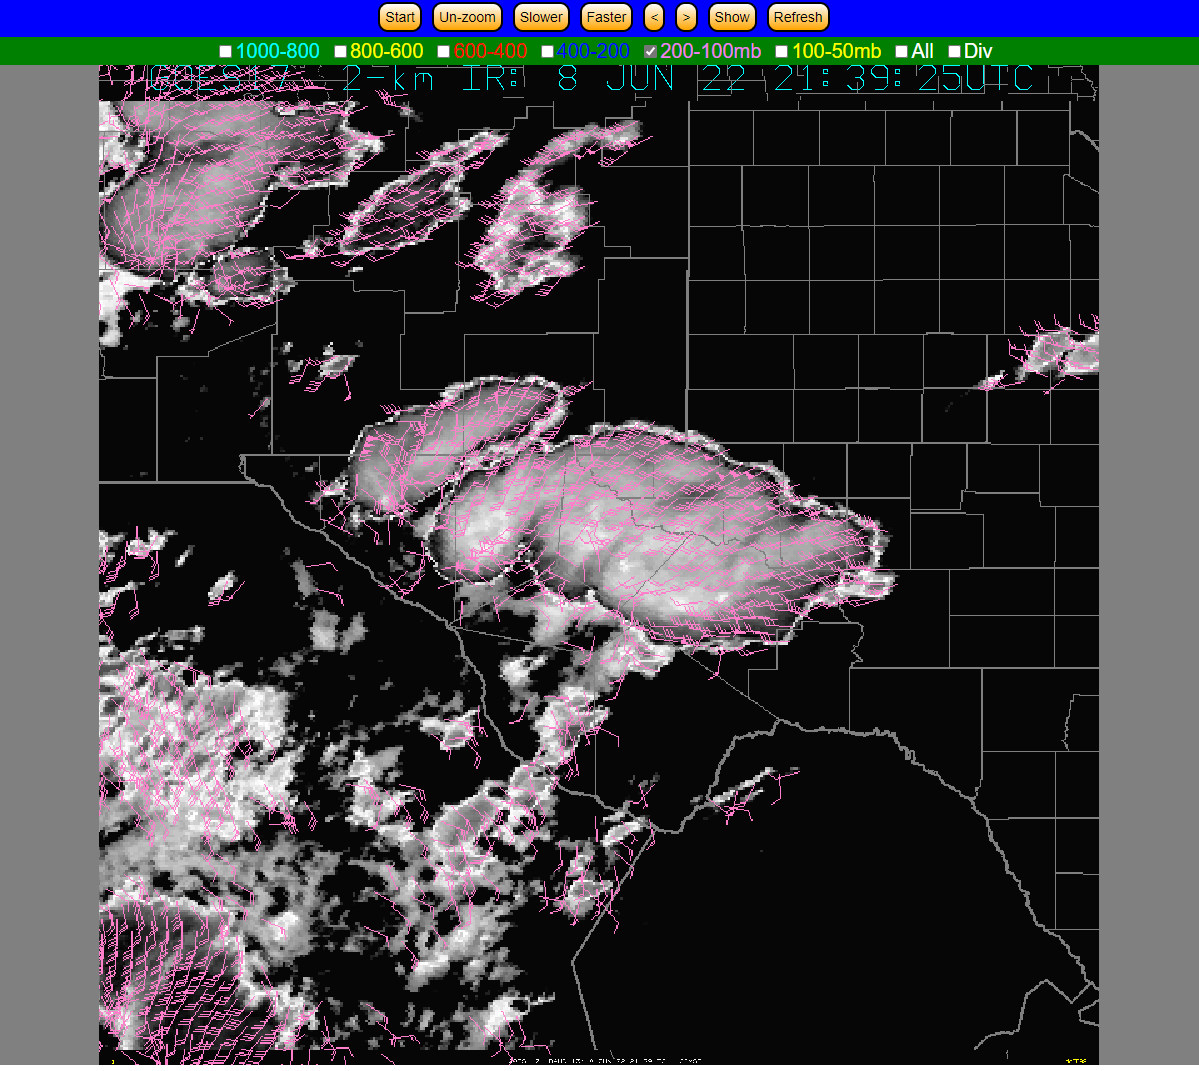
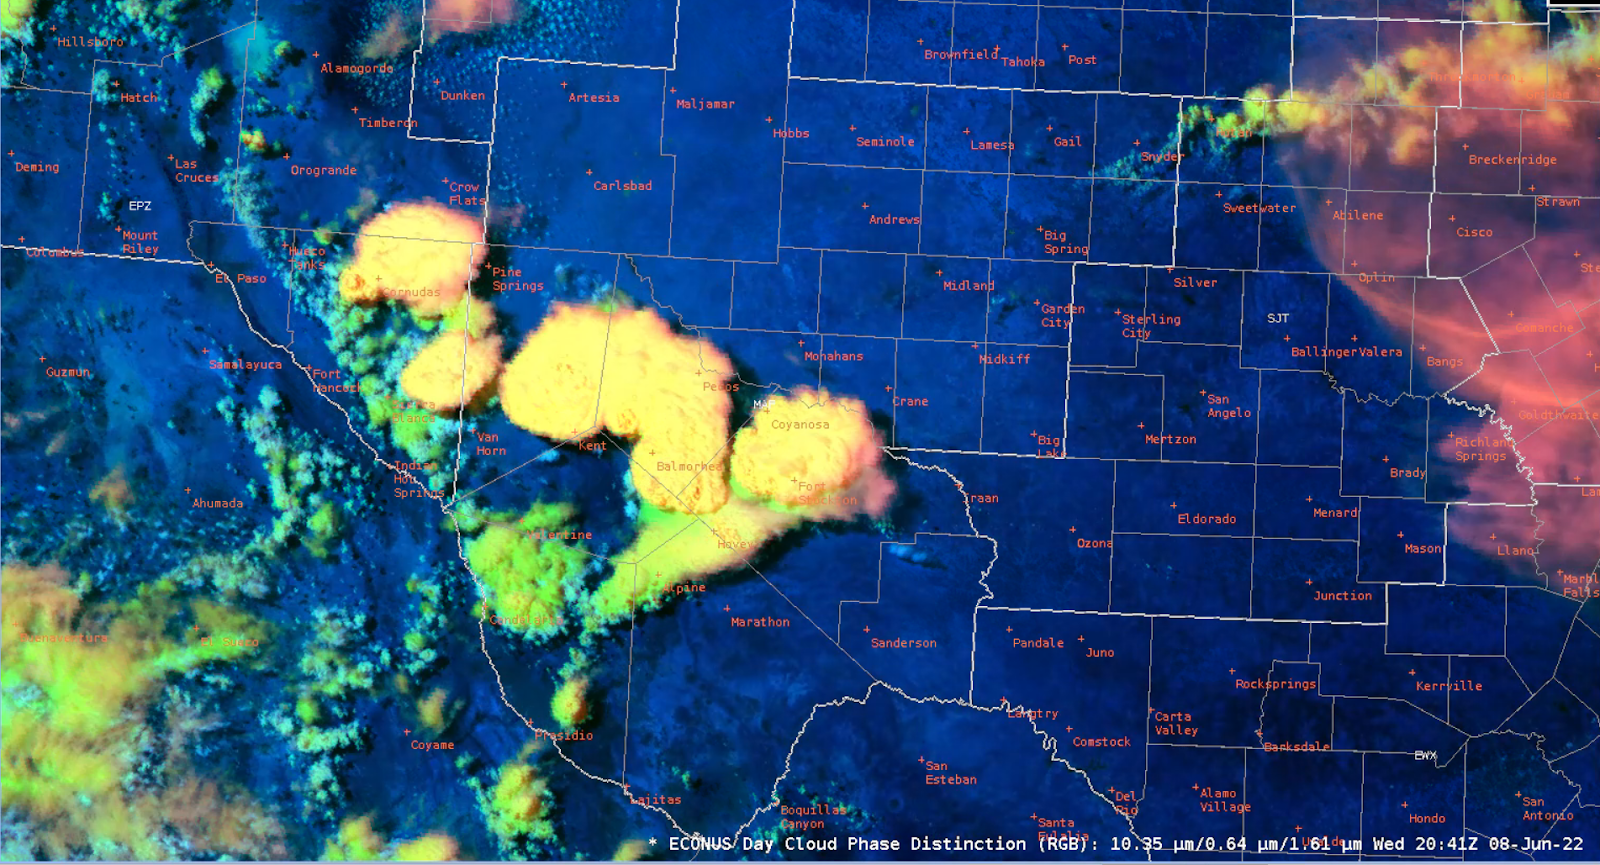
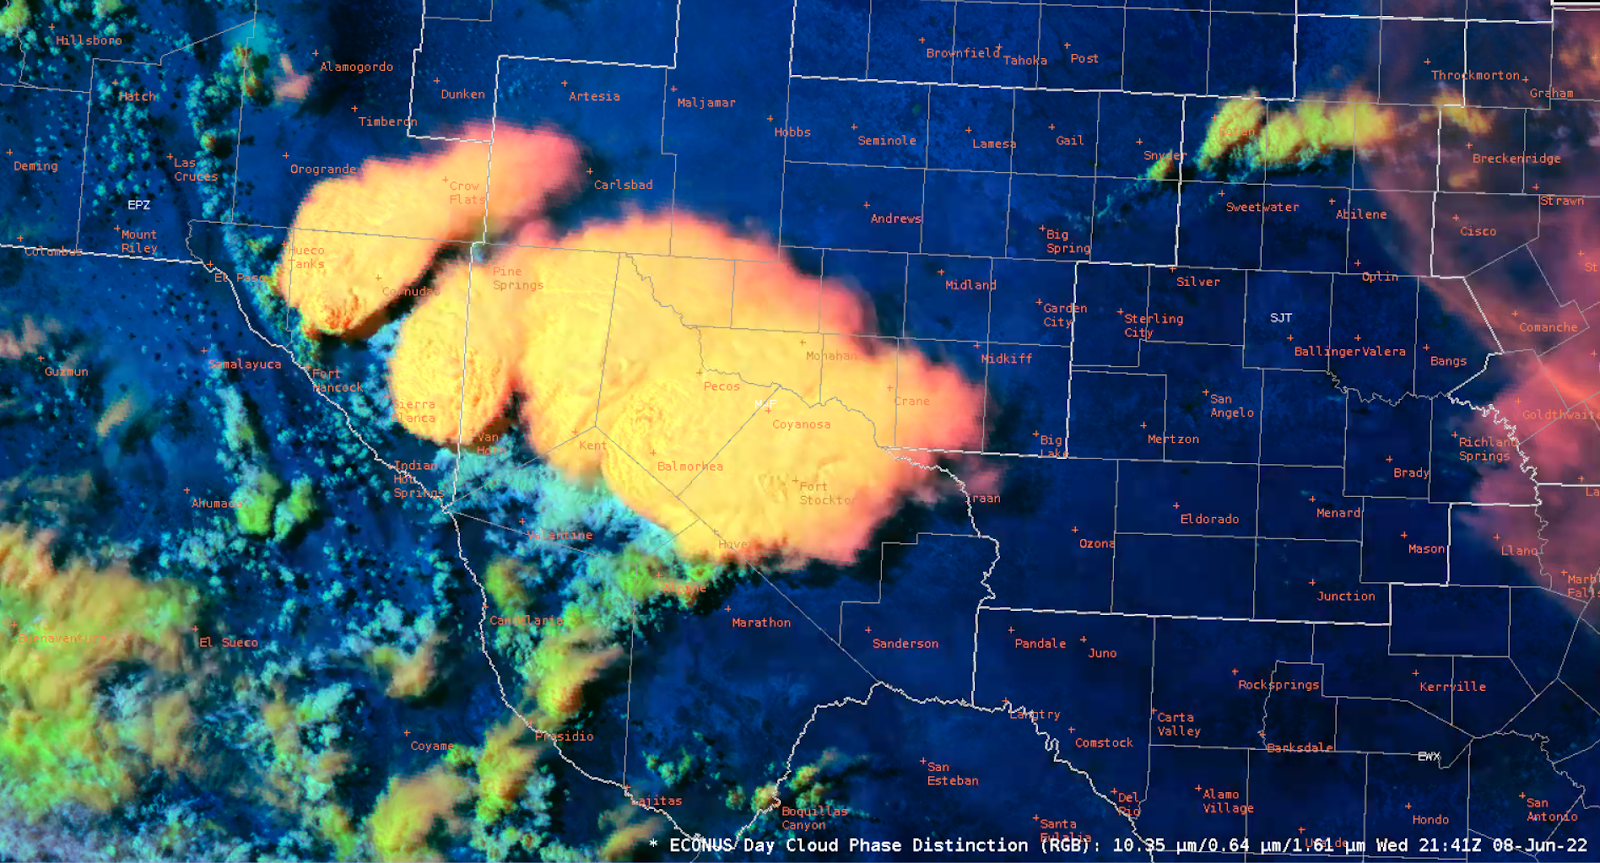
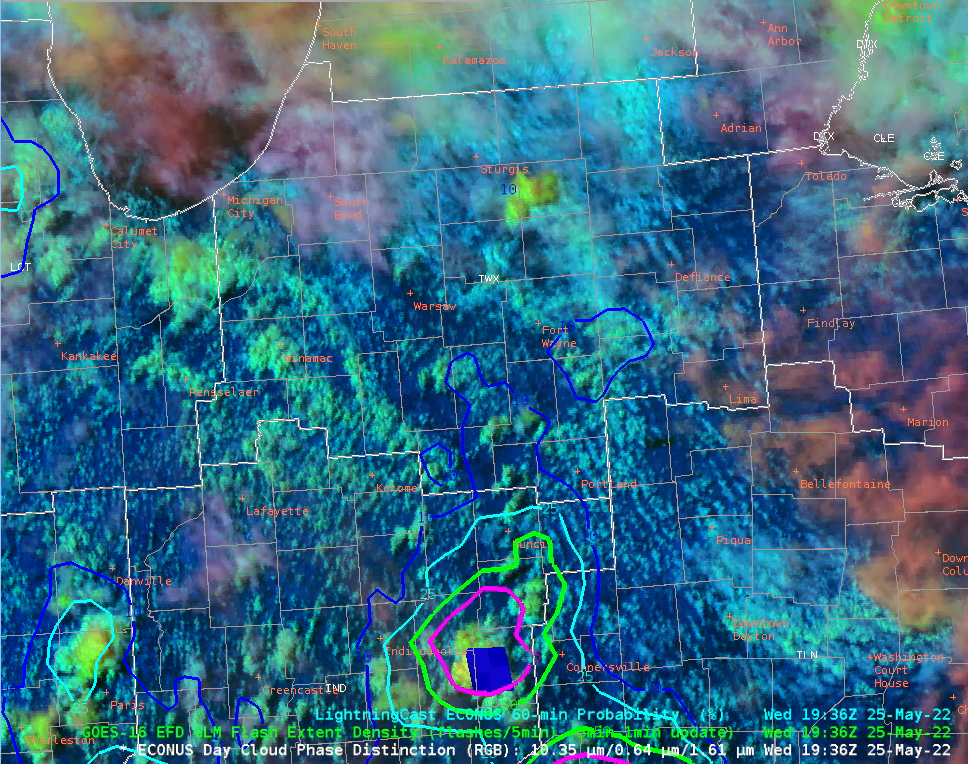
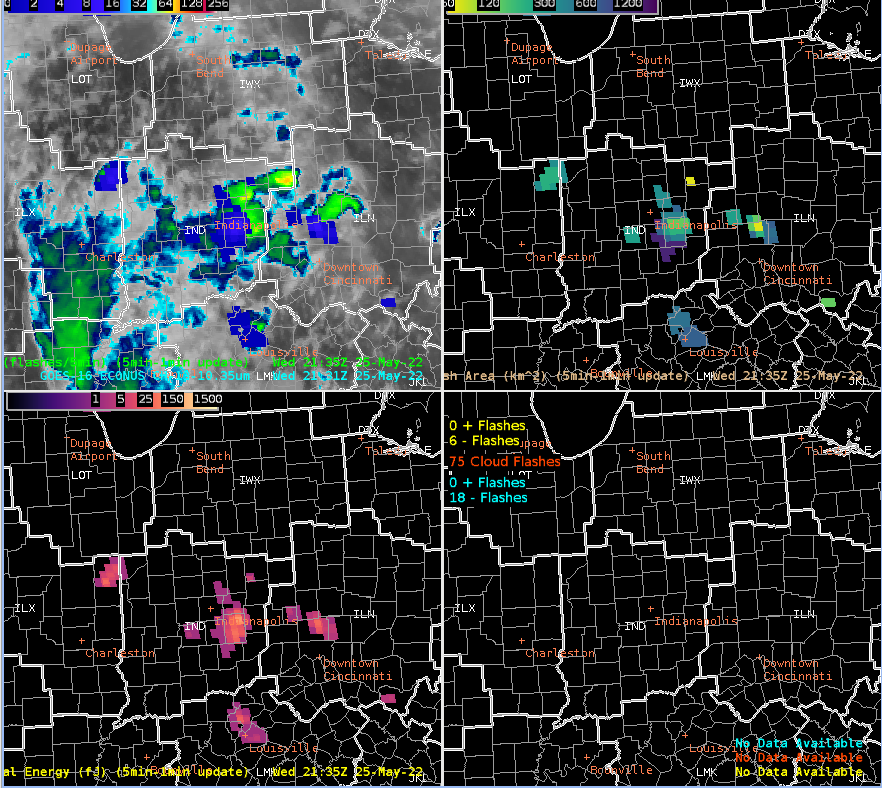
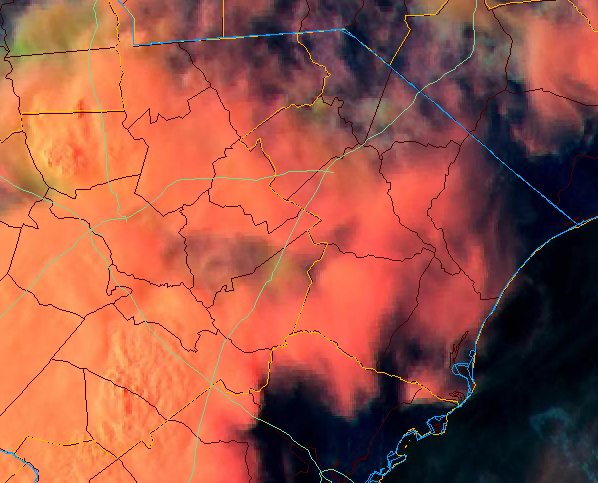
The Day Cloud Phase RGB images below back up the PHS forecast vs the SPC mesoanalysis, as relatively flat Cu field over our area of interest actually dissipated between 20z and 22z.

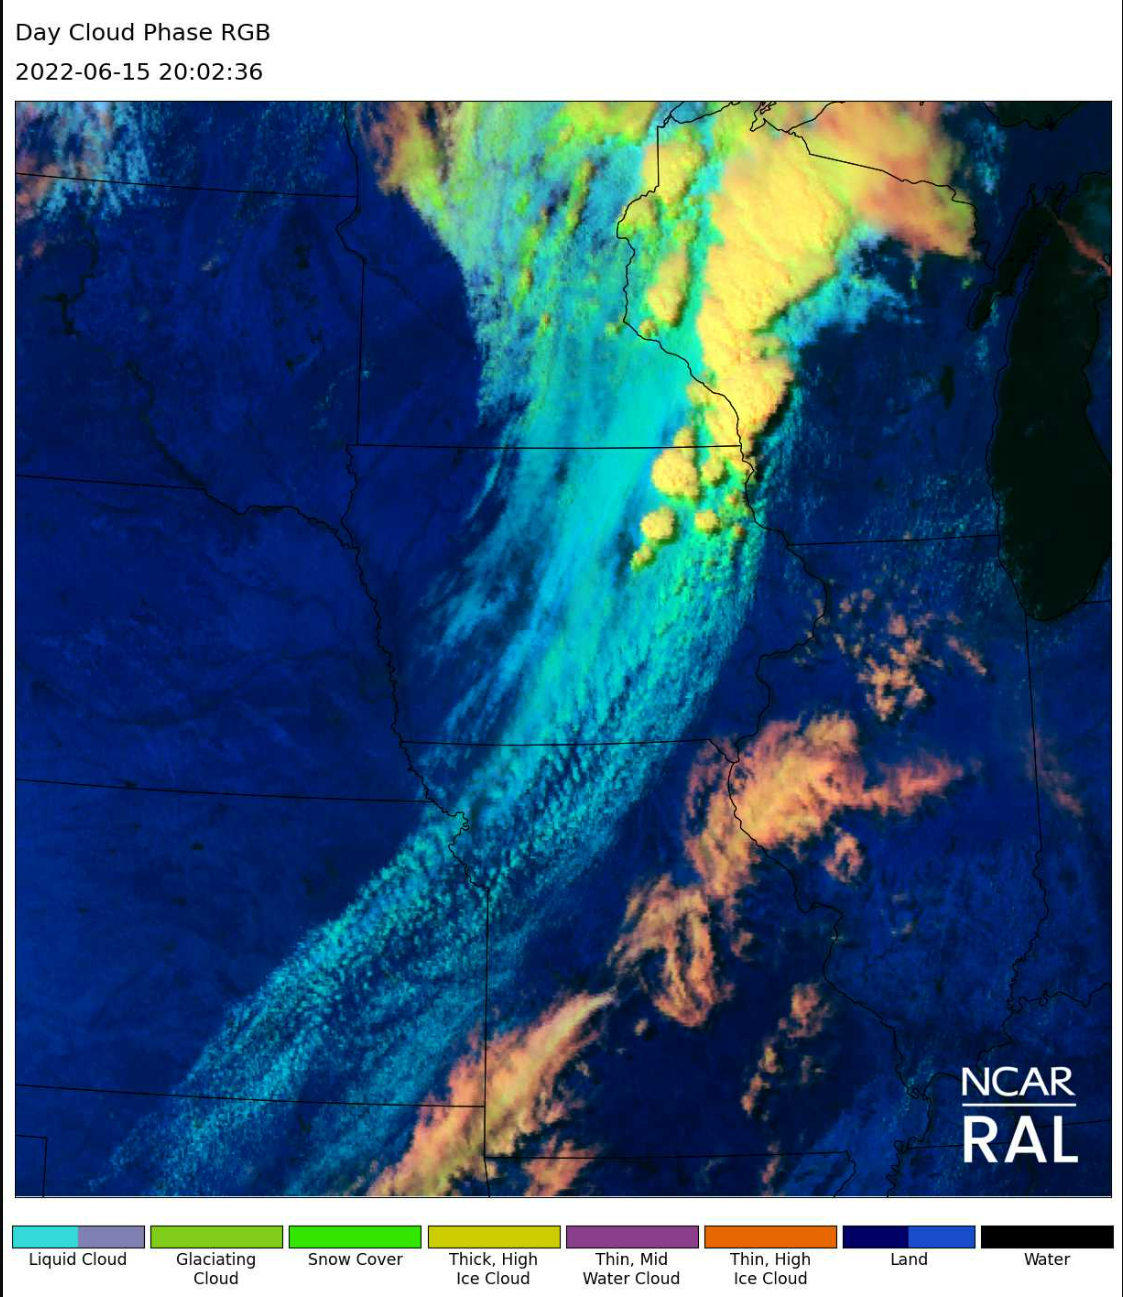
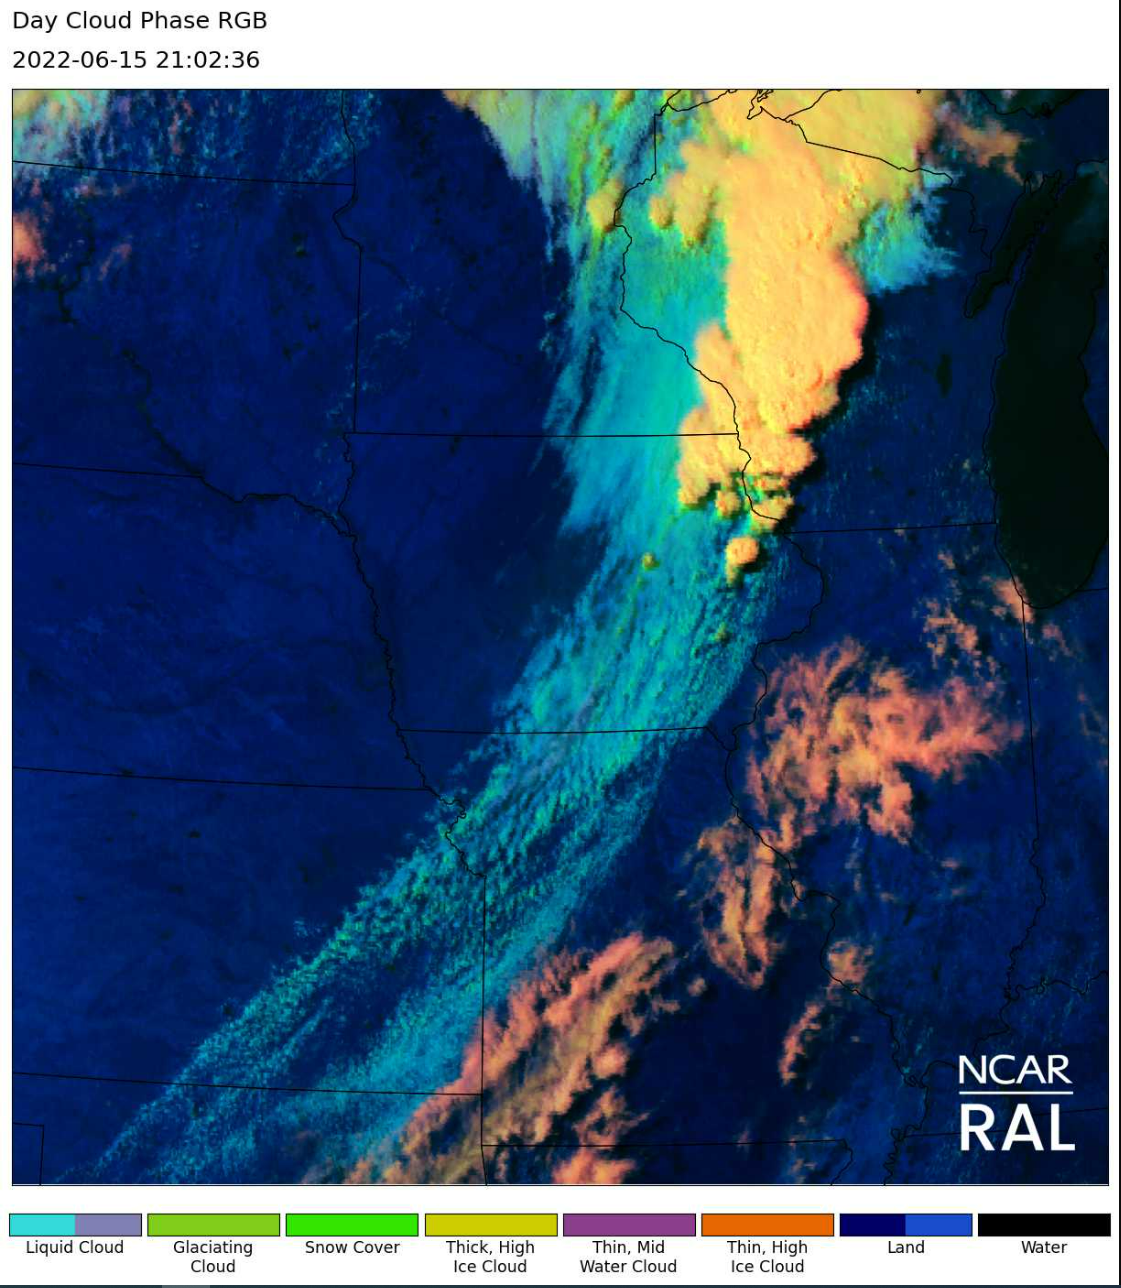
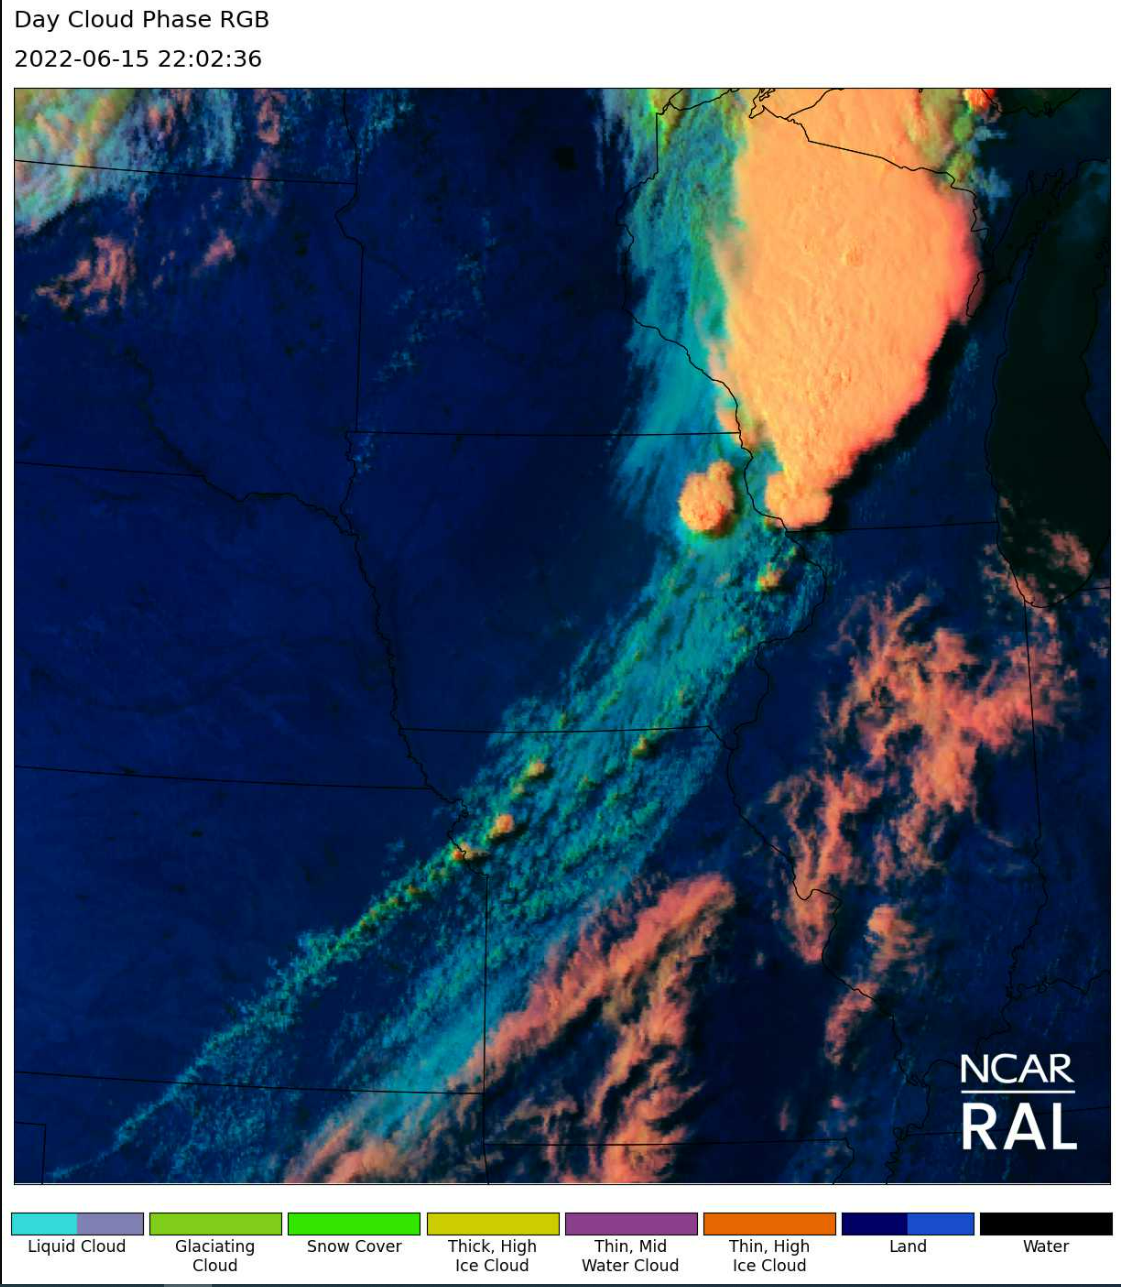
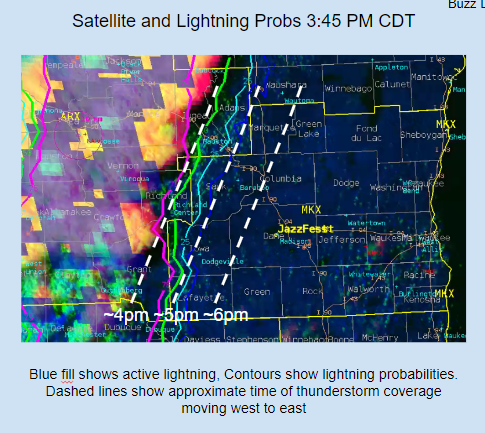
Based on the PHS forecast combined with satellite analysis, we were able to focus the convective threat for the Madison area toward 6PM and onward, tied to the stronger forcing and better moisture arriving from the west where the ongoing convection resided closer to the cold front. It appears that the PHS sampling of moisture in the column applied to the near-term forecast strongly outperformed the SPC/RAP Mesoanalysis model background and OA algorithm.

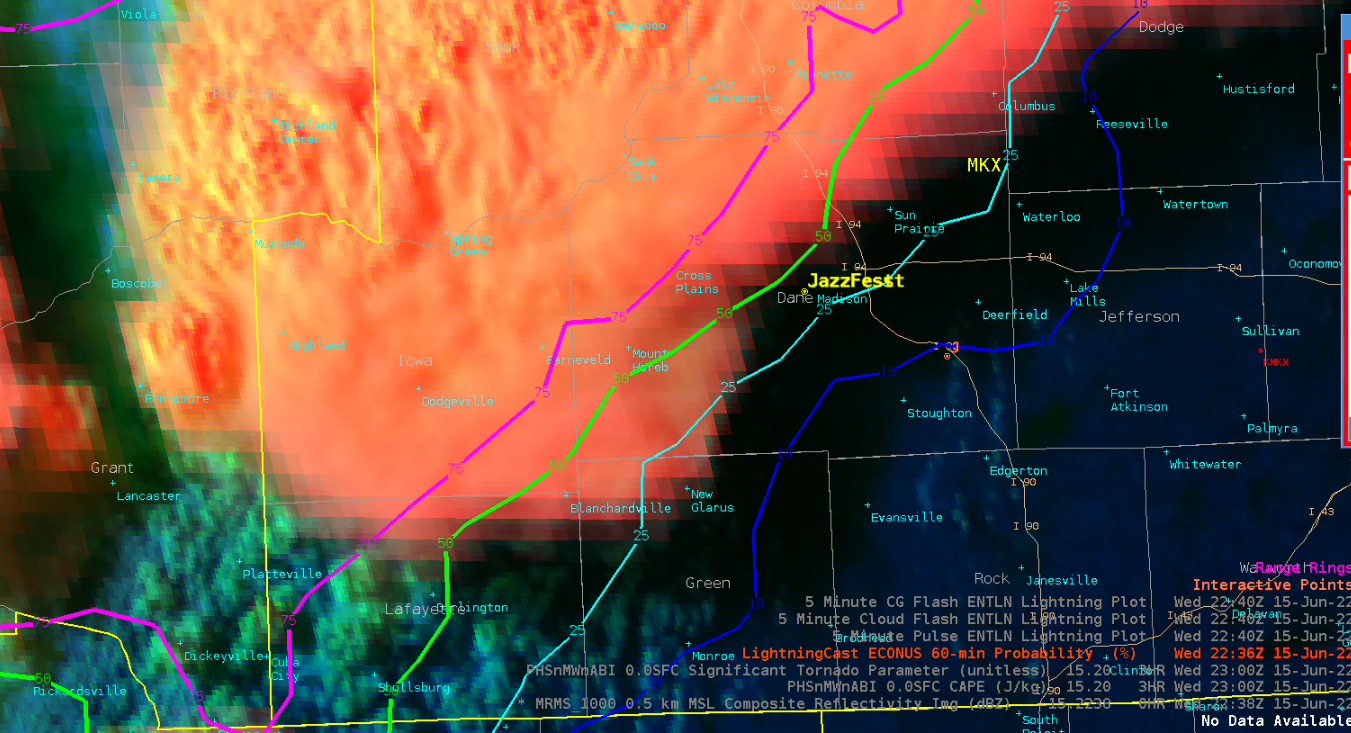
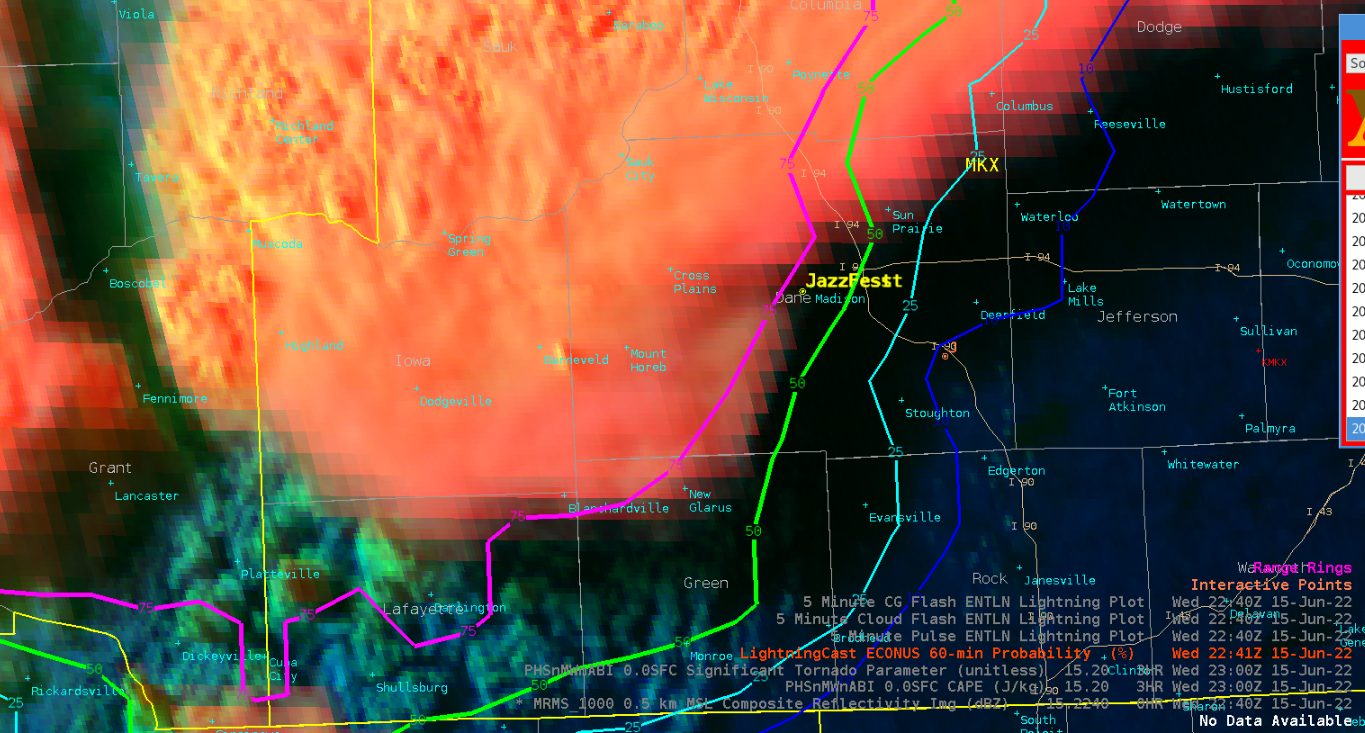
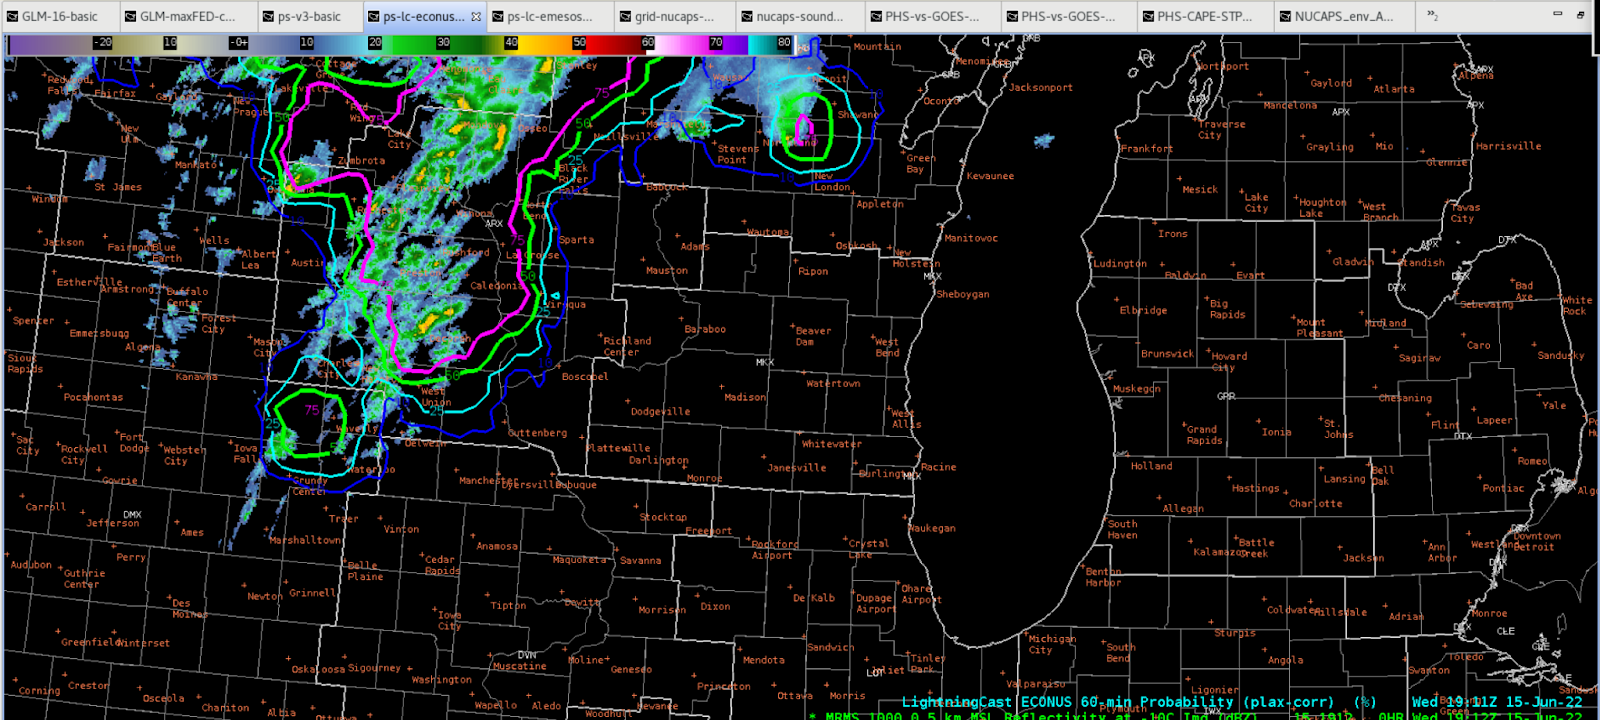
Differences between the LightningCast (LC) CONUS and LC Mesos

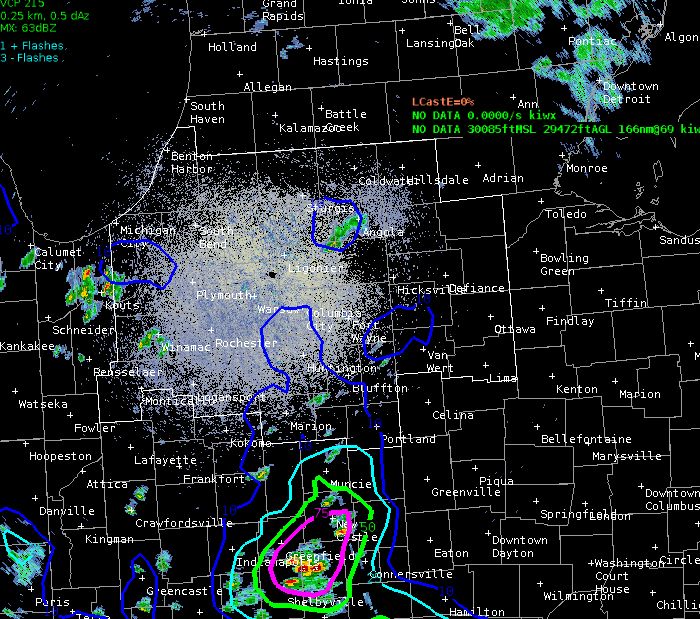
Note below the CONUS scale (1st image) and Mesos (Meso Sector 2 on 6/15) had a different depiction of the lightning probability over northeast Iowa at 1911z 22Jun15. This was due to the time for a CONUS GOES-East scan to complete, vs. the much shorter time for a Meso sector, which in turn affects the LightningCast model. This is something to keep in mind when using the product.

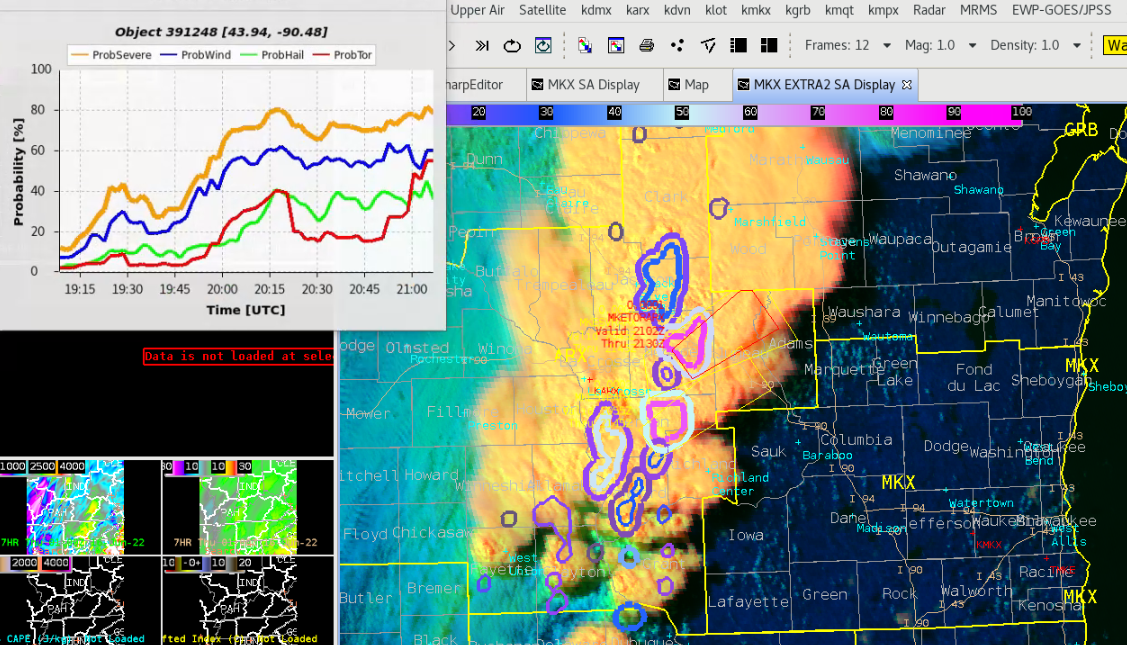
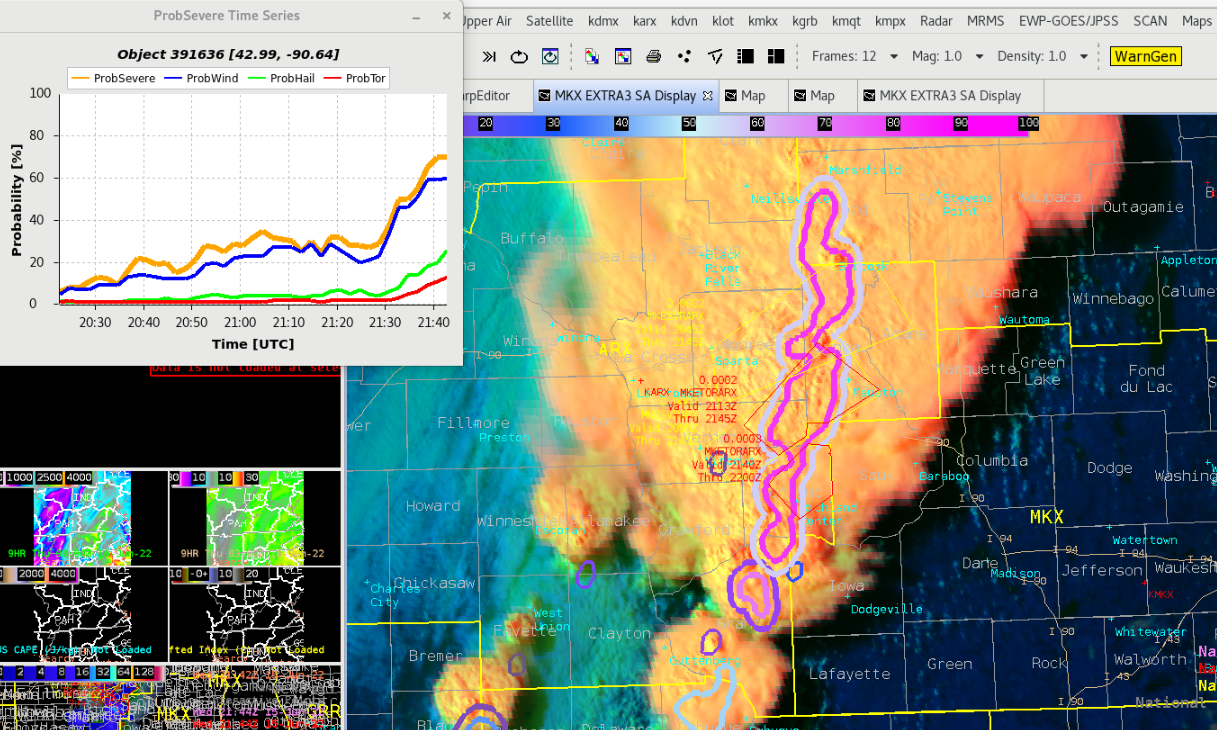
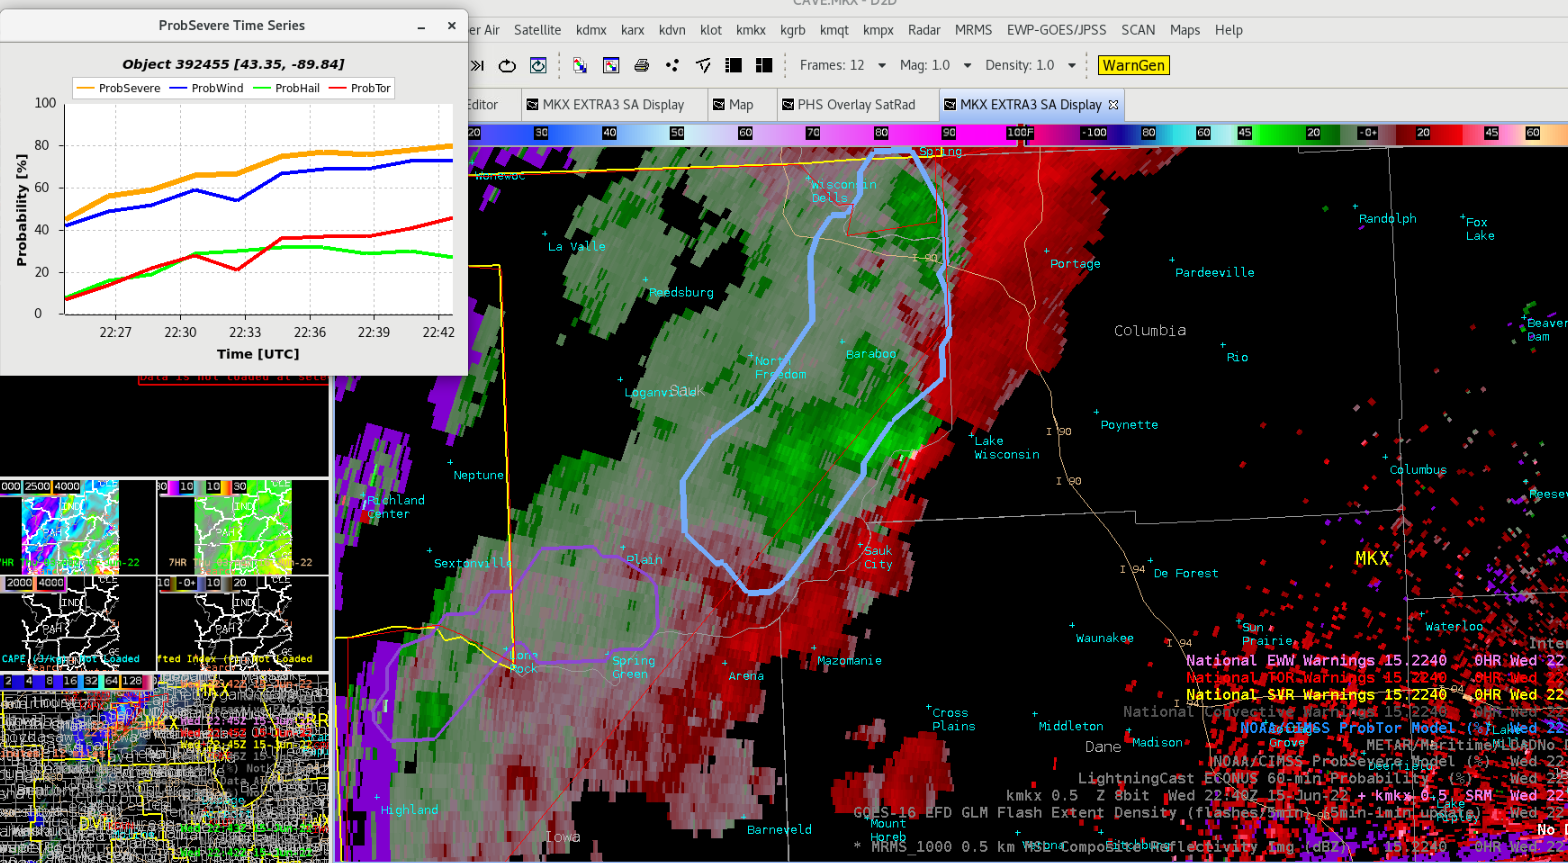
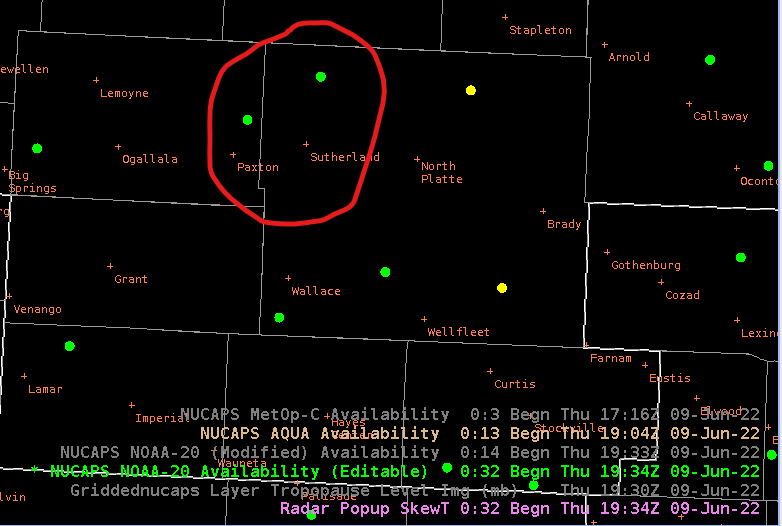
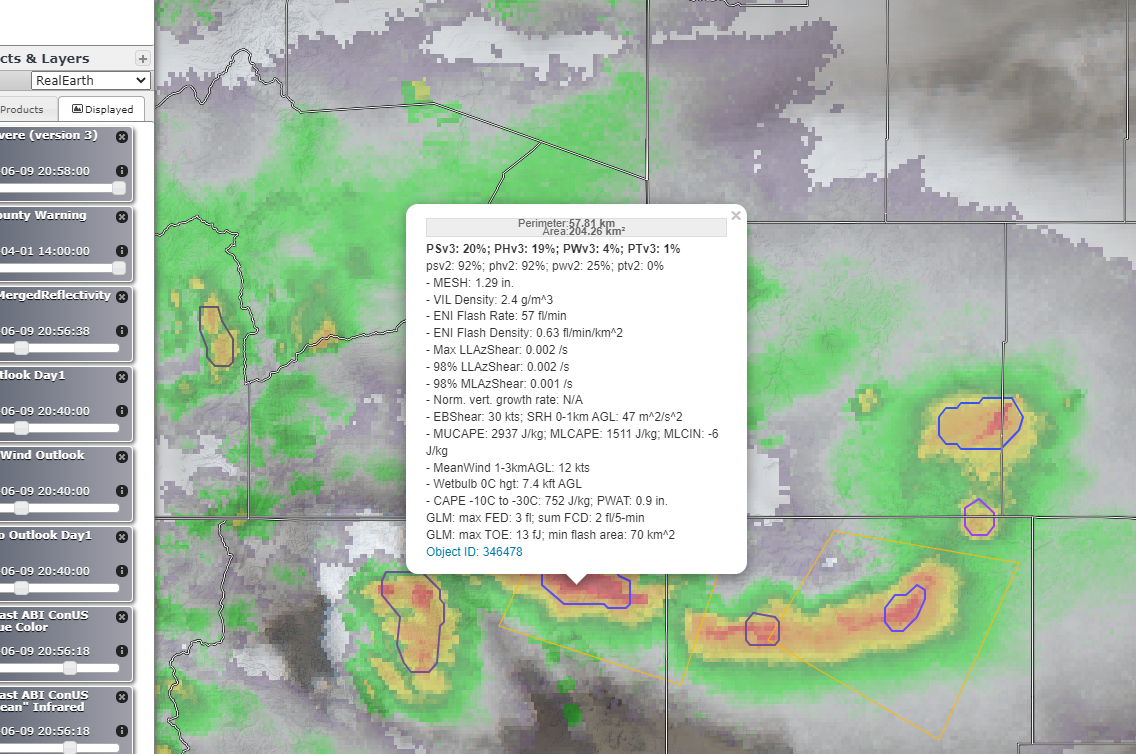
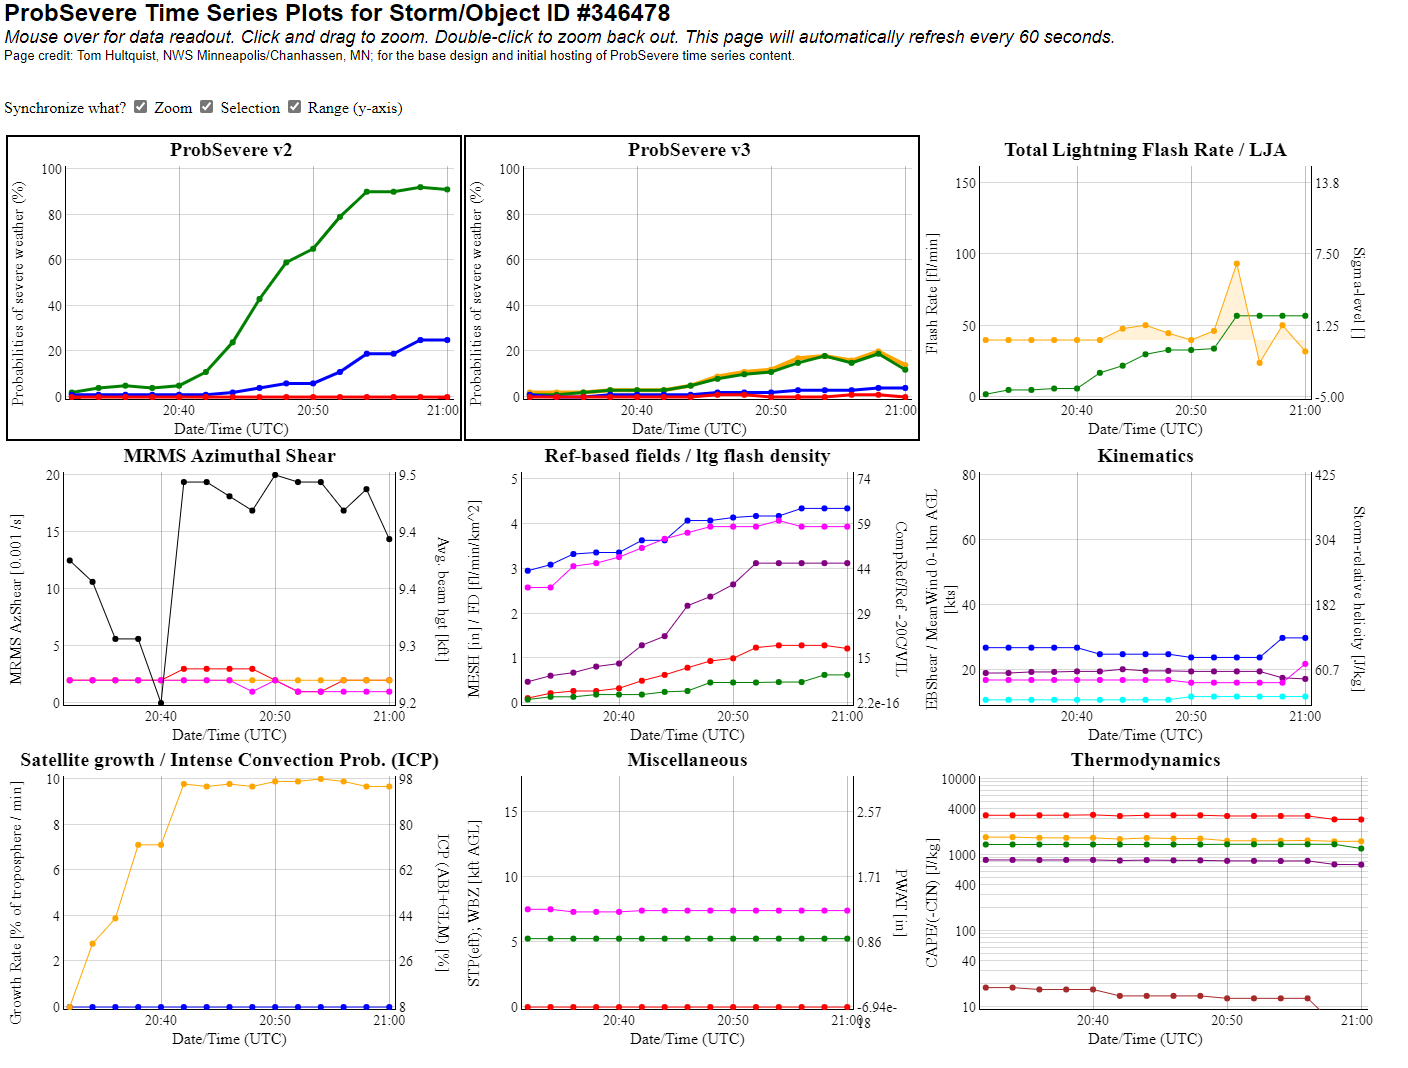
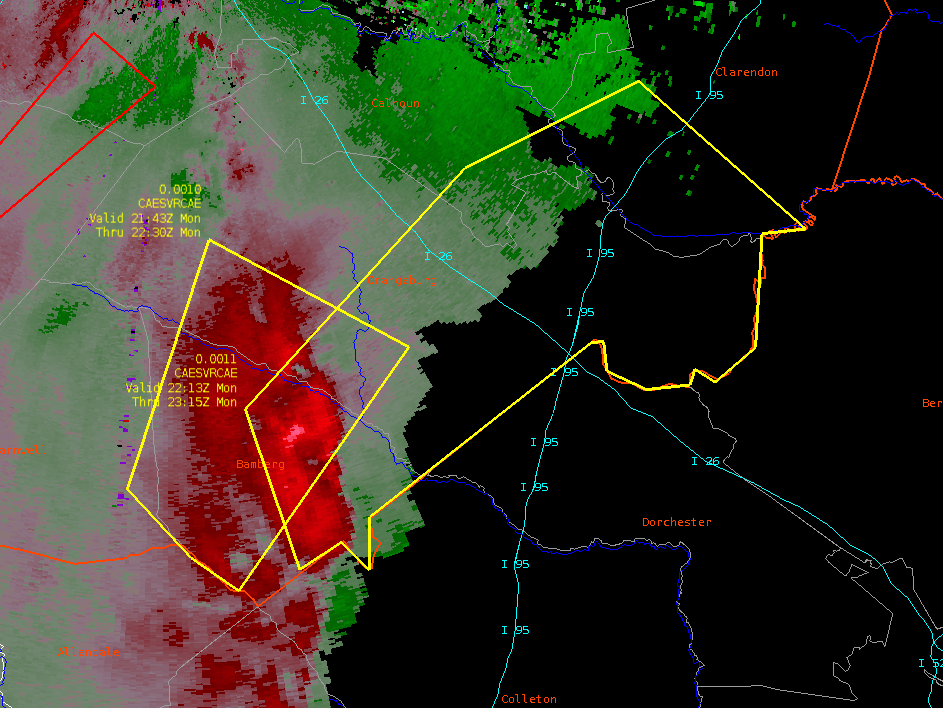
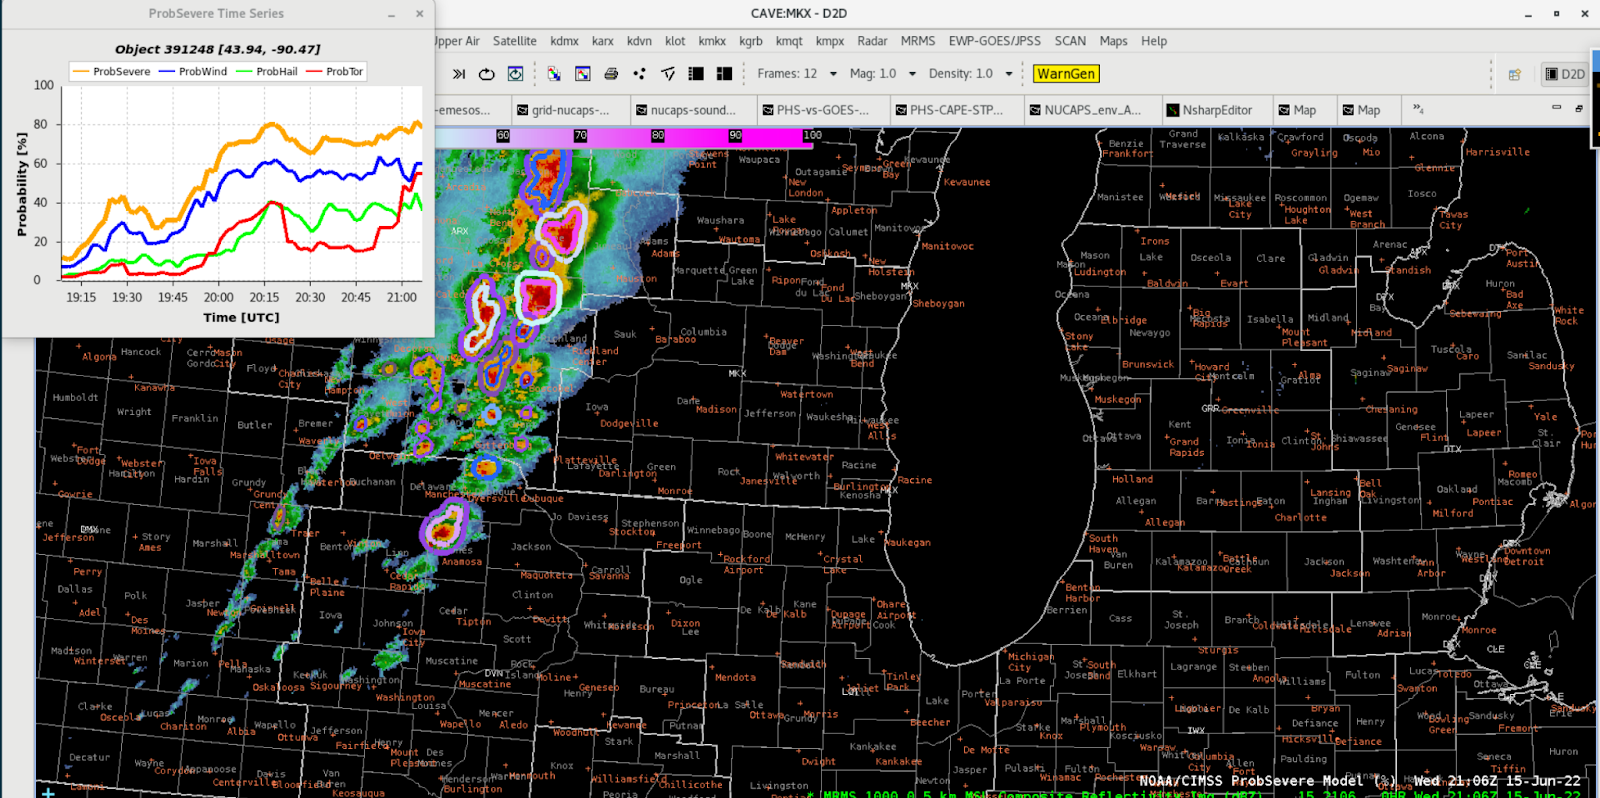
ProbSevereV3 Trends for Severe Convection in Western/Southwestern Wisconsin

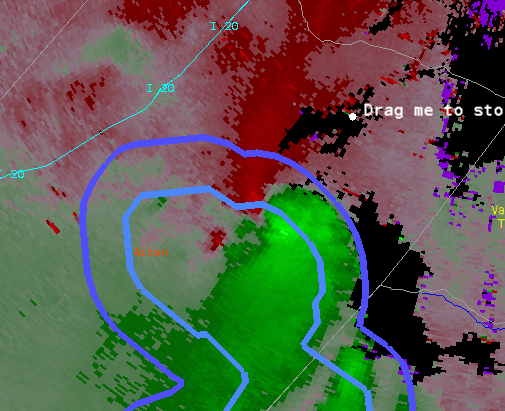
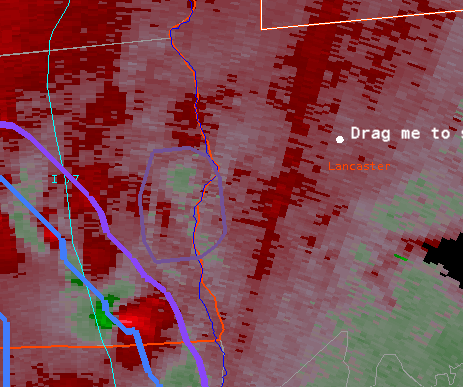
At 2106z, the ARX office had recently issued a Tornado Warning (2102z) for the northern cell with a high % on PSV3 and PTV3, per the noted superior calibration of the updated model vs. the V2. Could the PSV3 and PTV3 trend on this storm have assisted the radar operator in an increased lead time? As you can see below, starting at 2045z, there was a sharp upward trend in the ProbTor, to near 40% prior to 21z. At the least, this tool appears to be an excellent situational awareness tool, and may even be able to help lead time in some cases. It helped us in the MKX CWA regarding downstream warning issuances. In the event of an unexpected radar outage in a sparse radar coverage area, environmental analysis plus satellite interrogation with the utility of PSv3 could support successful radar warning ops in a less than ideal scenario.

– Hurricane84

Situational Awareness and Lead Time with LightningCast and ProbSevere/Tor

Today’s experience landed us in MKX monitoring convective development potential across the western portion of the CWA, with a line of storms ultimately moving in from the west, and some risk of discrete cells persisting even after we ceased the experiment.

I took the opportunity today to set up procedures overlaying PHSnABI indices (CAPE) with satellite imagery (e.g. Day/Cloud Phase or Viz), to see how well it corresponded with convective development. Unfortunately I didn’t grab a screenshot, but it was a nifty display that I hope to use again. PHSnABI suggested that CAPE in some areas of the CWA was not as high as the SPC mesoanalysis or RAP suggested. We tried to investigate this using a combination of NUCAPS and model soundings and RAOB, but couldn’t figure out a reason for the CAPE depression before incoming storms grabbed our attention. Notably, the indices derived only from GOES agreed with PHSnABI about this depression, though we couldn’t figure out if it was correct. It seems likely the GOES ABI was driving the PHSnABI result.

My main takeaway the rest of today is how useful ProbSever, ProbTor, and LightningCast can be with approaching/developing convection.

LightningCast, combined with GLM data, was useful for IDSS imagery to depict position and potential of lightning (example DSS slide using these graphics provided below).  Storms never made it to our decision point prior to leaving the experiment, but lightning threat was usefully communicated to the simulated JazzFest event.

As convection developed, we also practiced relying on probSevere and probTor for lead time in anticipating warnings. The following shows an example where the probTor trends corresponded well with ARX’s actual decision to issue a tornado warning.

SImilarly, intensification of the convective line appeared to be well detected. In fact, depending on what threshold of the probSevere parameters is relied on (probably depends on environment and other factors), the escalating value could have given useful lead time for a severe issuance decision.

Although the main mode appeared to be a line of convection, there were positions along the line where tornado risk seemed to increase (evidenced by radar velocity). It was reassuring to see probTor pick up on the gradually increasing risk of tornadoes as well.

And one final note… lightningCast is fairly impressive in how it produces calibrated estimates of lightning occurrence using only a single time step of satellite imagery (though it uses several bands of the ABI). Naturally lightningCast has difficulty where a developing tower is obscured by an anvil overhead, as we saw in this example. But it was neat to see lightningCast immediately respond with a broader swath of high lightning probabilities the very first time that a tower poked above the anvil that previously obscured it.  The fact that it was hidden probably means lightning could have been occurring below the anvil with lower than ideal lightningCast probabilities (though non-zero, to its credit), but it was neat to see the immediate adjustment to the probability contours with new imagery.

– Buzz Lightyear

LBF HWT Blog Day 4

We didn’t have too many storms occur during operations today, but that allowed us to be able to focus more on CI.

LightningCast for CI

Was able to use LightningCast for convective initiation today as LBF was waiting for storms to fire back up for the afternoon and evening. Initially we were thinking storms would form first over the southern portion of the CWA based off of modeled convective parameters but at 2101Z, a 25% chance of lightning popped up via LC for the north-central portion of the forecast area. This 25% contour appeared a few minutes before radar reflectivity started showing up for the same area. Seeing even the 10% contour show up earlier on, clued me into the fact that we needed to shift our focus further north than we originally thought. These storms seemed to be forming along a shear gradient and weak boundary.
Of note, I am using the parallax corrected LC.
LC, GLM FED, and DCPD at 2100Z
LBF radar at 2109Z
By 2116Z, both GLM and ENTLN showed the first flash of lightning, allowing for around 15 minutes of lead time off of the 25% contour.
For comparison, these storms were forming ahead of the highest PHS CAPE and ahead of any of its stronger gradients.
21Z:
22Z:
As our day was winding down, LC continued to indicate areas to watch before it showed up on radar, but I did not grab additional images.

NUCAPS:

Tried to compare NUCAPS soundings today as we did have an overlap, but unfortunately ran into technical issues within my CAVE so was not able to do much with it. Another limiting factor was that the only “green” soundings from Aqua within our CWA fell within the far western scans which we were told by one of the developers they would next expect good data from, being on the limb. But for comparison, here are Aqua (1911Z) and NOAA-20 (1953Z) sounding from points NW of North Platte.
Points selected were both NW of the town of North Platte, circled below. The NE point of the two is Aqua and SW point is NOAA-20
– Matador

Differences in Prob Severe v2 vs v3

Some significant differences in probabilities for v2 vs v3. Noted on this storm in northern New Mexico. Not quite sure the reasoning for this large discrepancy.

Storm ID: 346478 in Northern New Mexico June 9, 2022.

Notable Differences in ProbSevere in the time series.

Storms going up right along forecasted boundary from PHS CAPE

Storms developing in Prowers County in southeastern Colorado.

– David Spritz

PHS CAPE localized maximum compared with storms developing in the area

PHS CAPE values increase from north to south over Fort Stockton. This correlated well with RAP mesoanalyzed SB CAPE on SPC webpage. Storms actively going up along this gradient as an outflow boundary pushed south during the early afternoon from overnight convection over Oklahoma.

PHS CAPE 18Z 1 hour forecast for 19Z

PHS CAPE 18Z 2 hour forecast for 20Z.

Storms developing over Fort Stockton via Day Cloud Phase Distinction on GOES 17 Mesosector

We showed above that the north side of the outflow would contain more instability – which is directly related to the moisture from the morning MCS outflow. The Gridded NUCAPS provides additional insight using the 850mb moisture fields from both AQUA and NOAA20 respectively – validating our hypothesis.

We double checked since there was a dust advisory/dust in the forecast and yes – Dust

Don’t warn if pop = 0

Convection was skirting the northeast portion of the CWA so we’ll use the recent pass of NOAA-20 to view the potential for convection redevelopment to the west and affecting the forecast in our CWA. Here are the Modified NUCAPS soundings:

The top image is for the sounding in Jones county, below is Scurry – which shows a capping inversion still in place.

Storm Motion

Weak winds aloft and throughout the atmosphere have contributed to very little in the way of storm motion. Hence, locally heavy rainfall may begin to evolve, even over an area that has received very little rainfall in the last 6 months.

Optical Flow Winds in the 200-100 mb level.

Day Cloud Phase valid 2041Z.

Day Cloud Phase valid 2141Z.

PHS depicts this plume of moisture and associated instability will back into New Mexico this evening. Could it play a part in tomorrow’s severe weather risk?

Here is what happened at El Paso when the front backed into the area – Dewpoint jumped from 30F to 50F

– David Spritz

– Mr. Bean

Day Cloud Phase Boundary noted on PHS CAPE forecast

A notable boundary seen over the southern CWA of LBF on GOES 16 Day Cloud Phase Distinction is also evident in the PHS CAPE forecast for 19-21Z over the same area. The evolution of this boundary could be key in determining future convective development later this afternoon/evening.

Day Cloud Phase Distinction 20Z

SFC CAPE PHS for 21Z forecast, top left panel.

Meteorologist David Spritz

Monitoring Scattered Convection in northern IN & Tin Caps DSS

I decided to submit a quick DSS briefing for the Fort Wayne Tin Caps with DCPD indicating glaciation and weak echoes on radar. LightningCast was starting to increase over northern IN for that weak developing convection. Additional convection is spreading in from the south, and higher LightningCast contours are also spreading in. PHS shows increased CAPE over the next hour.

Left: DCPD with GLM and LC. Right: Base reflectivity with LC

Loop of base reflectivity and LC from 1938 to 2014Z:

Left: PHS forecast CAPE at 20Z. Right: PHS LI at 20Z

First GOES flashes a little after 20Z. DCPD with GLM FED and LC

However, by 21Z, lightning is limited pretty much to cells to the northwest and E/NE of Fort Wayne.

Happily, LightningCast called the lightning flash east of Fort Wayne about 10 minutes out (small pink circle east of Fort Wayne)

Why is barely anything happening? Convection looks to be “firing” now on an instability gradient. Indicated by PHS at 21Z:

Am I confident that things will ramp up at all for our area within the next couple of hours? So-so. Here is PHS CAPE and LI for 21Z.

And gridded NUCAPS 850-500mb lapse rates at 1730Z, ranging from around 4.5-6C/km

However, zooming out, there is an area of convection across central IN that should begin approaching our southern CWA boundary within the next half hour. Here is the GLM 4 panel with GOES clean IR underlaid with the FED, at 2130Z.

– PoppyTheSmooch

Severe wind across SC with isolated tornado/hail

This was the lone tornado warning I issued. It was borderline but a nice MCV wrapped up after this. Likely contributed to some severe winds at times.

This helped lead to a warning at 2146 UTC. This cell was near our southern CWA border. This looked good for hail.

Here is the same storm a bit later when it’s more of a wind threat. 40 kt winds showing up even with a poor radar angle.

Good overshooting top with that same storm showing up nicely in the DCP.

Other notes. I liked the idea of the micro wind product but it’s too hard to read. Needs work to be usable.

One last minute tornado warning…

  • Some Random Guy