An official website of the United States government
Here’s how you know
Official websites use .gov A
.gov website belongs to an official government
organization in the United States.
Secure .gov websites use HTTPS A
lock (
) or https:// means you’ve safely connected to
the .gov website. Share sensitive information only on official,
secure websites.
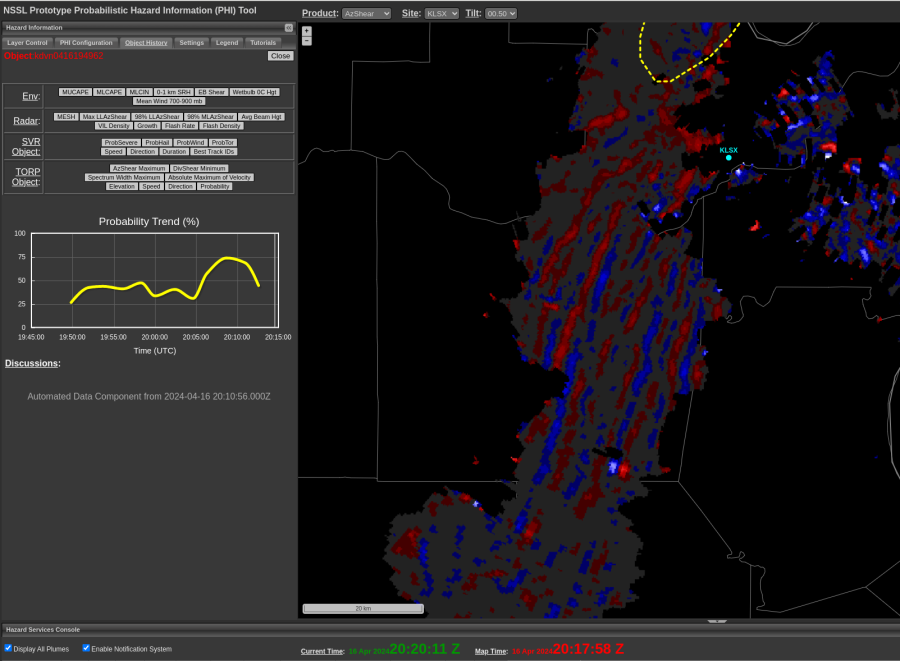
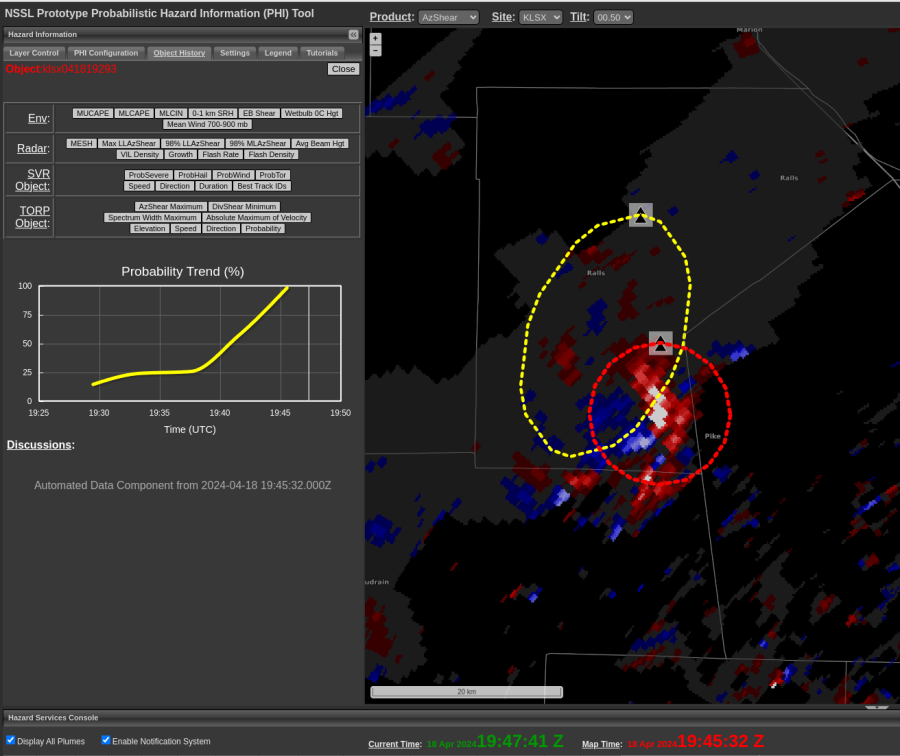
A case of sidelobe contaminated velocity fields occurred around 1945 UTC (Thursday) in Ralls County, Missouri. TORP/AzShear algorithms were quick to initiate an object and jump towards near certain (>90%) values. The object remained for multiple volume scans until sidelobes disappeared. When “real” velocities emerged, TORP magnitudes dropped/went below threshold quickly. -QLCS
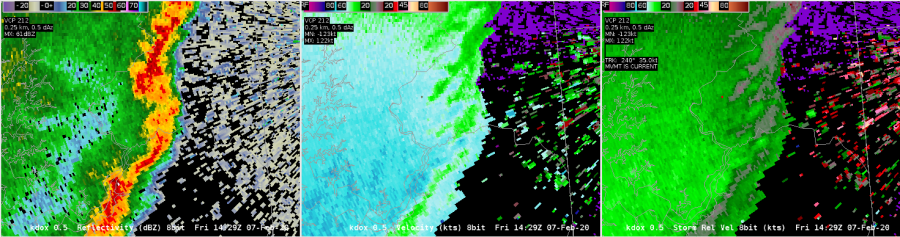
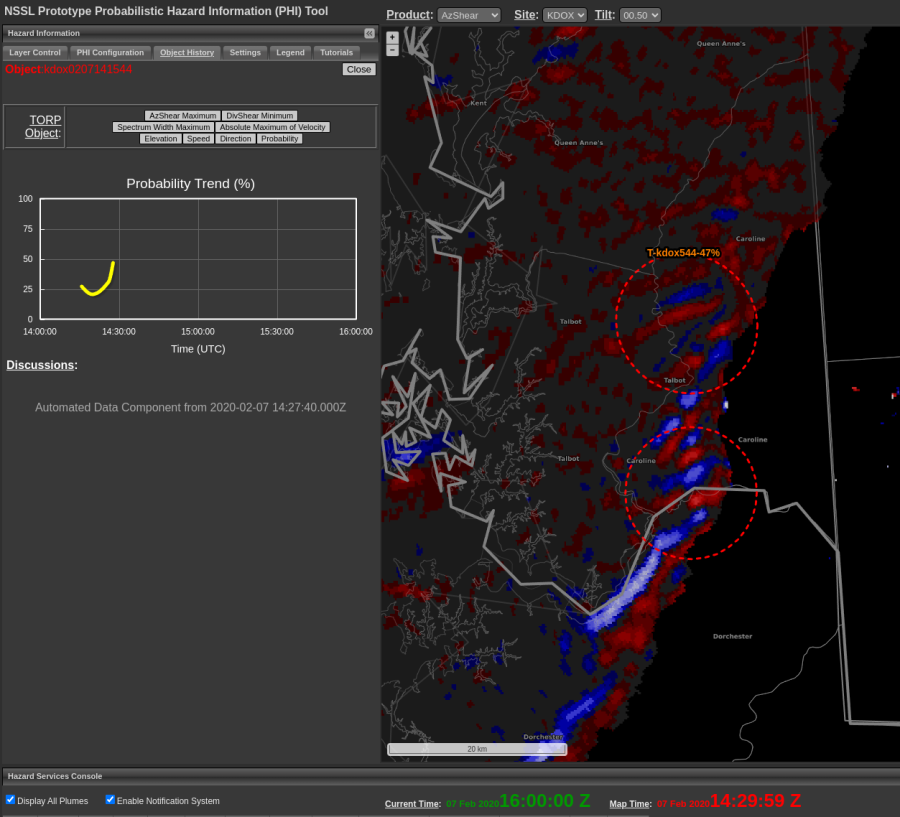
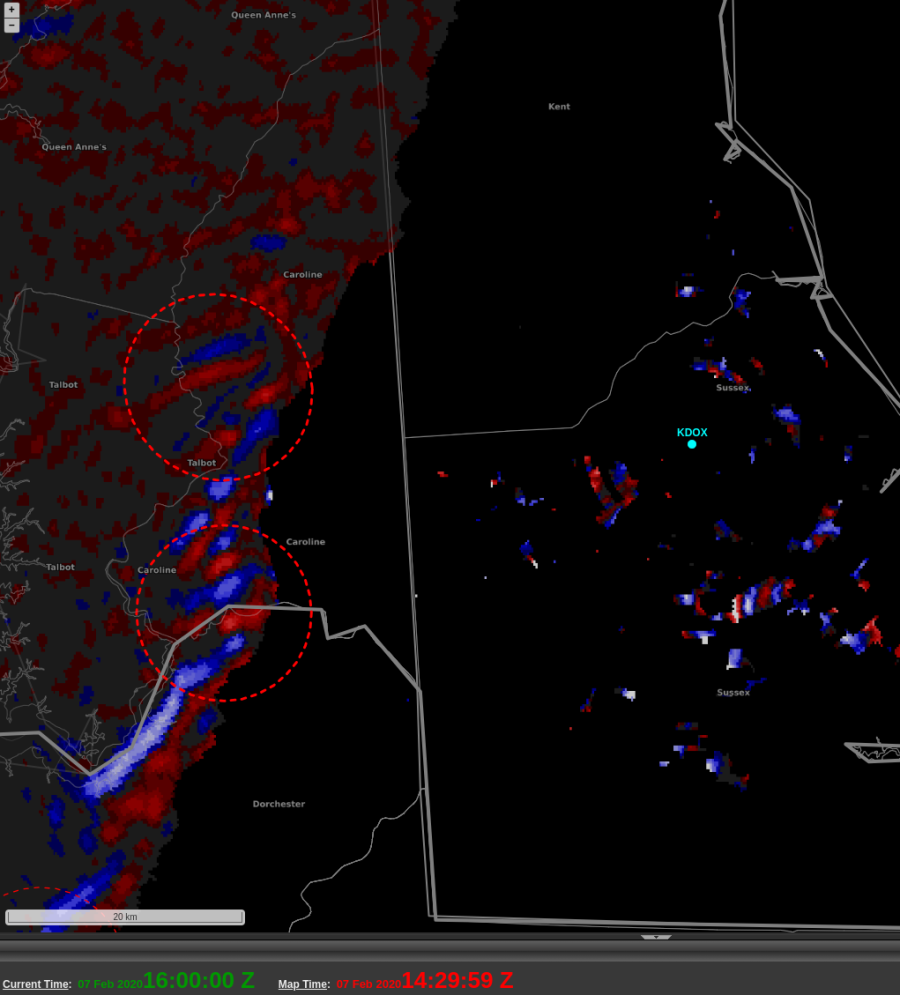
A short observation. Looking at an incoming QLCS line from KDOX creates two different regimes of AzShear patterns depending upon how parallel to the radial it’s aligned. We see groups of couplets on the more perpendicular side and a long stretch of convergence/divergence paired on the parallel side.
Meanwhile, TORP still isn’t really sure how to handle this…
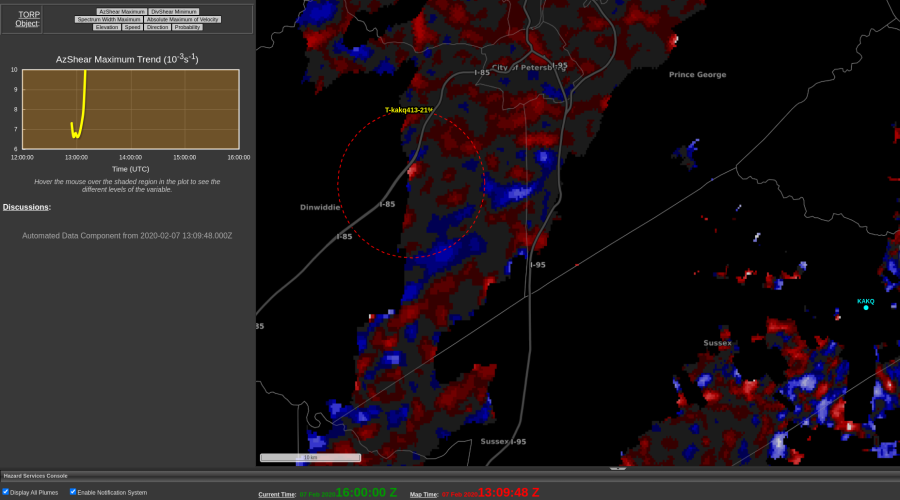
Interesting output from AzShear/TORP along leading edge of advancing QLCS. Environmental analysis (and velocity pattern) would indicate some stability of the boundary layer. Yet, TORP initiated two objects (>40%) near this feature with very little concern in viewing base data analysis. -QLCS
Found a questionable TORP object while skimming through a case this afternoon. A few broken lines of convection are approaching the KAKQ radar on an early February morning. I had yet to see many TORP objects as the case is a bit of a slow start, but suddenly noticed this pop up centering on the west side of an oncoming line.
Indication of TORP on the west side of the convective line suspiciously pinging along I-85.
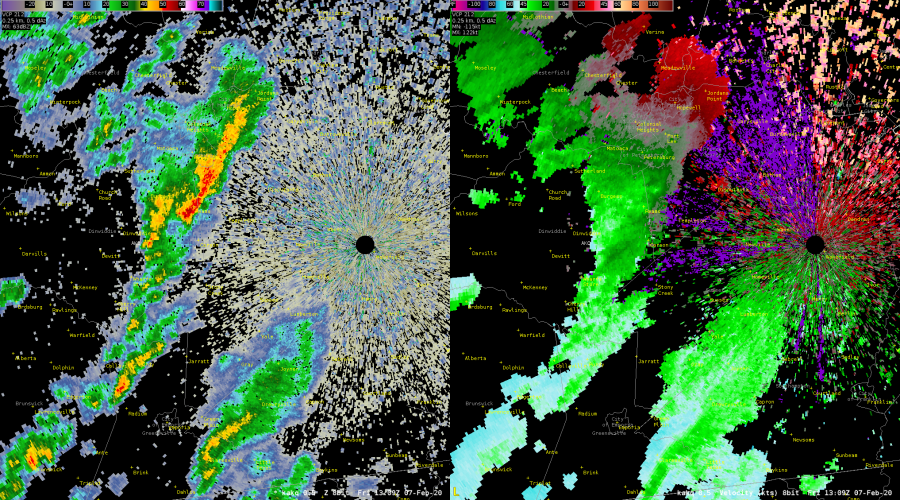
I found this strange, as I not would expect AzShear values to hug that close to the west side of a line. So I went to investigate with reflectivity and velocity data and didn’t find anything I was impressed with.
A normal looking convective line approaches KAKQ.
What I did see, is that the TORP object is centered about a section of I-85 in a section of fairly low reflectivity. In my home office, we’ve seen cars and boats via radar and this could be a similar event, but with a convective line in the way there’s no real way to be sure.
As has been noted, TORP lead time is nearly non-existent when it comes to QLCS events. This is especially true when applying a threshold filter >40-50%. However, in this case and others assessed so far this week, FAR with TORP is relatively low for even these marginal/transient cases. The example above displays nearly zero lead time to confirmed event (~1244 UTC), though would be eye-catching should a TOR warning not yet be in place. -QLCS
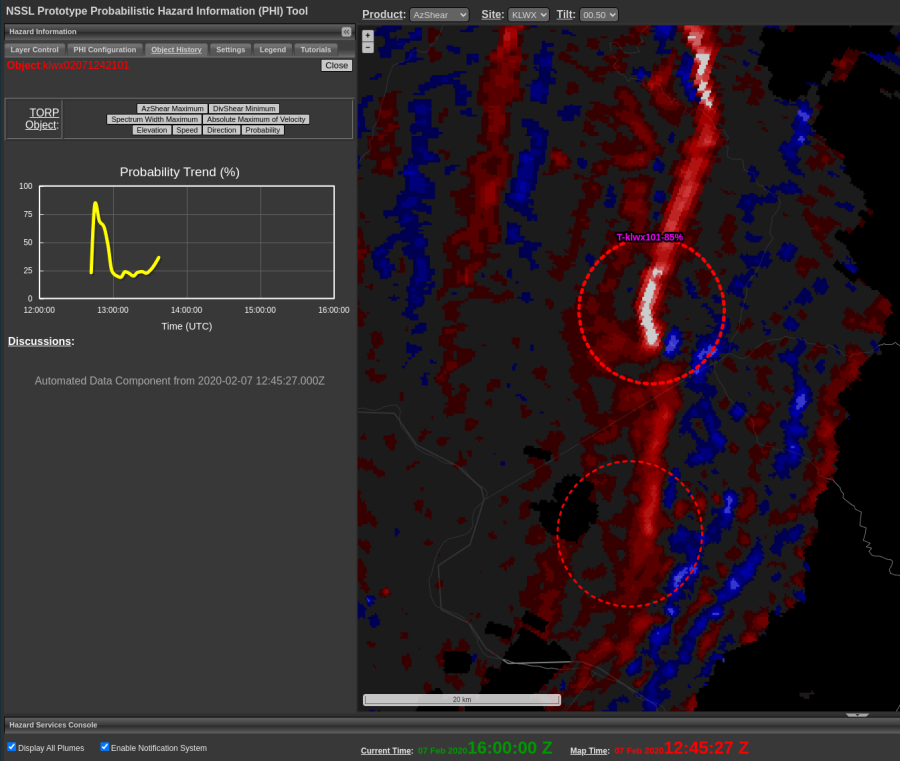
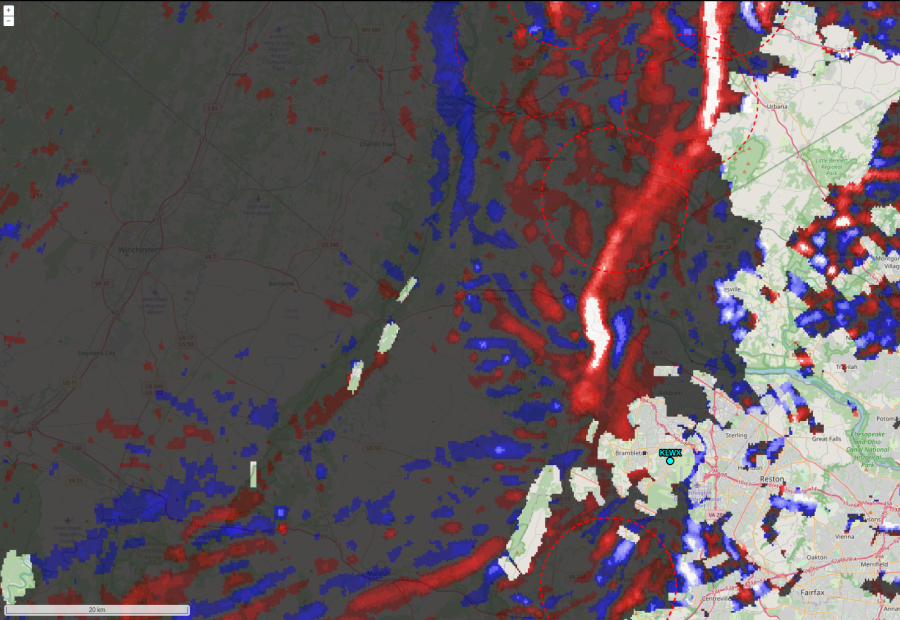
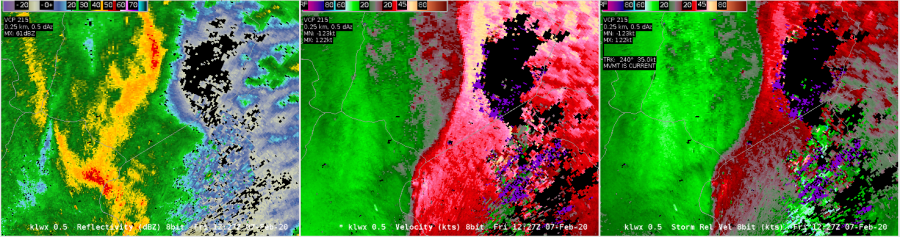
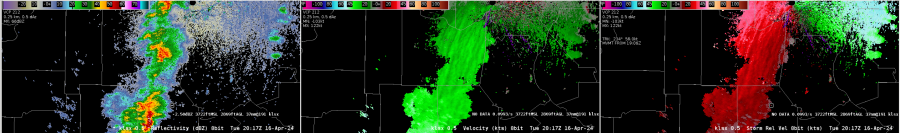
An area of higher AzShear moved close to the KLWX radar at 1221z and TORP struggled to pick up on this. TORP has a known QC to filter out data within a certain range (30km) from the radar, but even when that was turned off, TORP did not have anything.
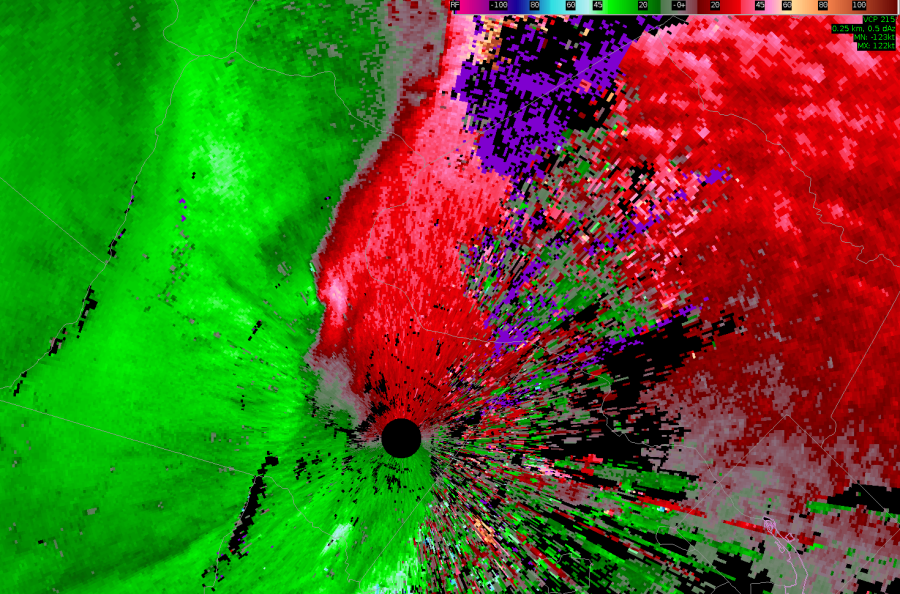
Looking at the velocity data, there is a couplet there just to the northwest of the radar where AzShear is maximized. So, even though AzShear responded well to the couplet, TORP struggled due to the close proximity to the KLWX radar.
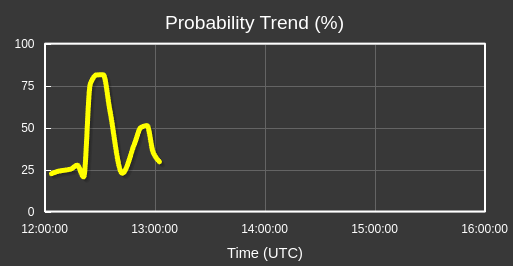
The TORP graph shows that when the couplet with the high AzShear moved farther away from the radar, the probabilities shot up from 25% to 80%. And this couplet did produce a tornado.
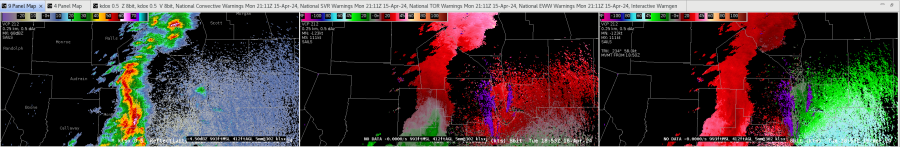
Despite the known limitations/DA issues with AzShear as lines/convergence zones move orthogonal to radar radials, TORP was able to correctly identify (with high confidence) a tornadic signature near the RDA. -QLCS
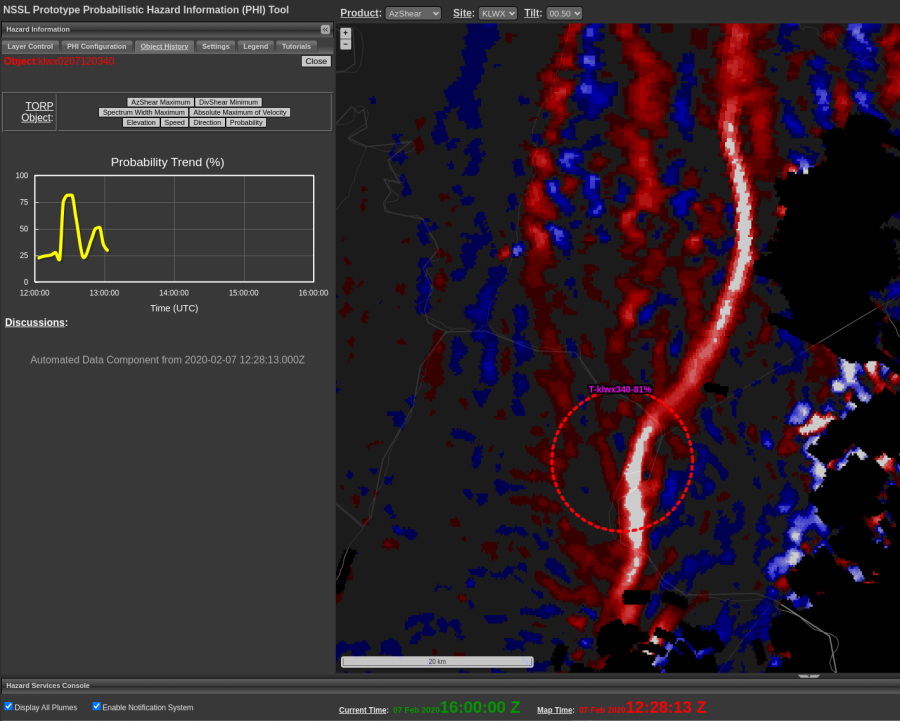
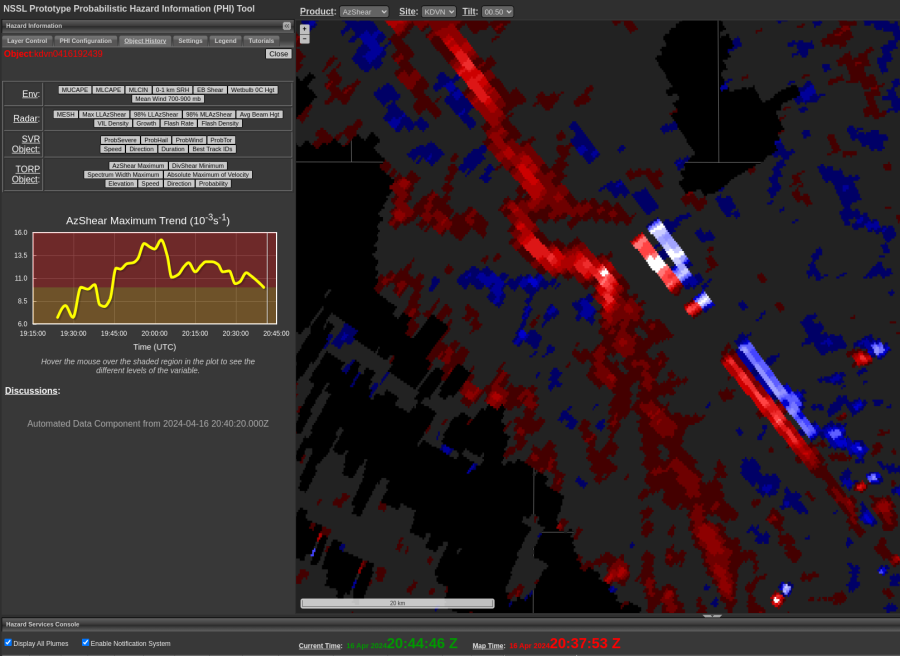
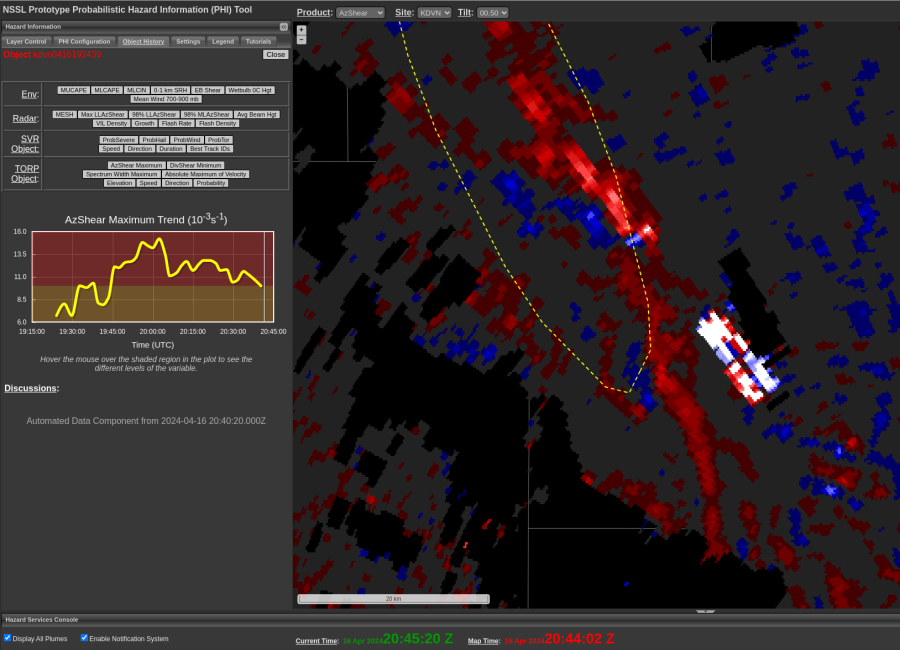
Had a line of semi-organized storms cross multiple radials of beam blockage (as evident from KDVN radar). As this occurred, AzShear pattern associated with storms maintained character (bottom image/2044 UTC). No TORP object was created as I hypothesized (i.e. as real/artifact “combined”). -QLCS
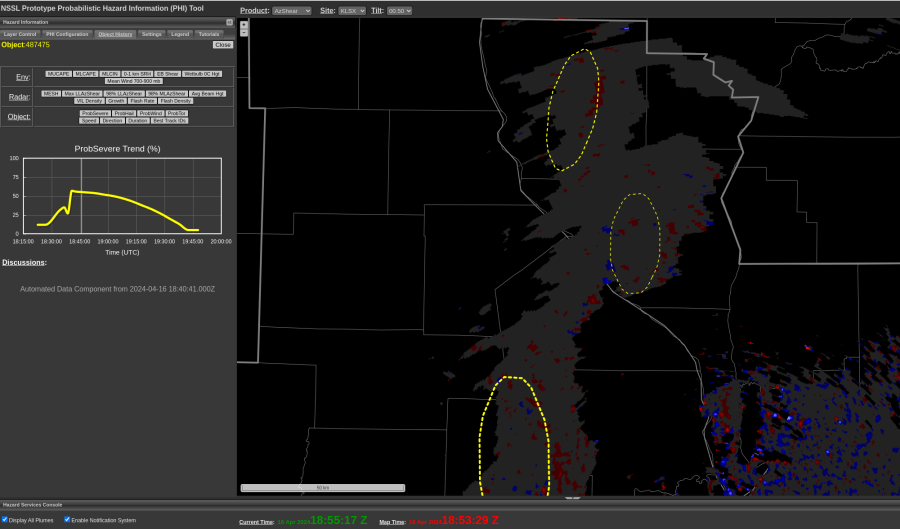
Concurrent with nebulous V/SRM data (~1850-1855 UTC), AzShear shows very low output/readings for the cluster of convection shown. Combined with assessment of environmental data, this convection appears to be slightly elevated in nature and AzShear confirms little concern for rotating outcomes in the interim. -QLCS


 Meanwhile, TORP still isn’t really sure how to handle this…