Lightning, and GOES-East vs. GOES-West
Observation 1: GLM discrepancies between satellites
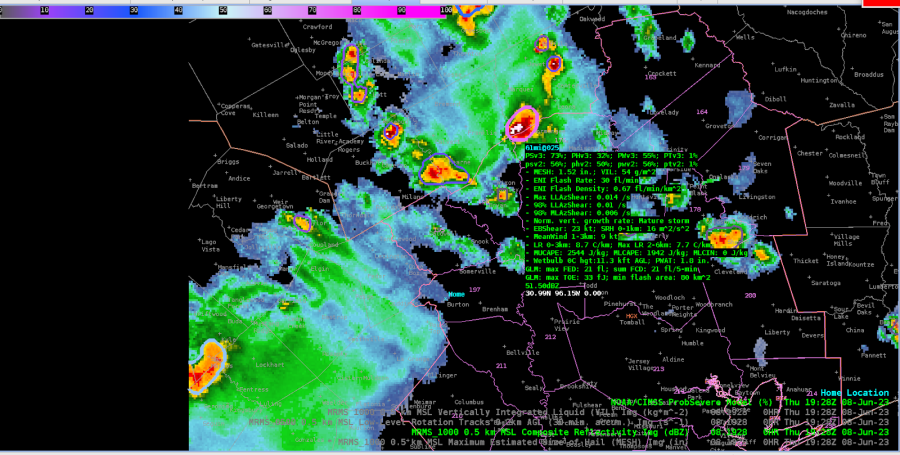
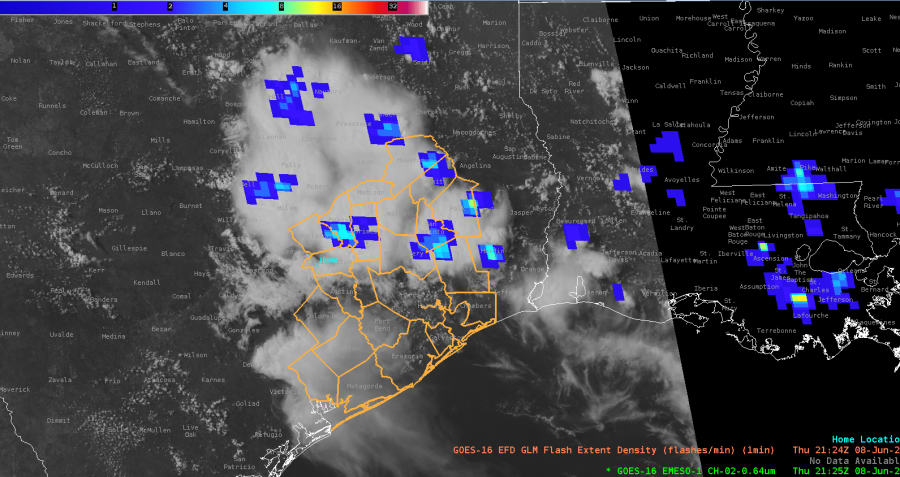
Left: GOES-East LightningCast v1 & GLM FED Right: GOES-East LightningCast v2 & GLM FED 1836 UTC – 1931 UTC 5 June 2025 in southwest Texas
GOES-West GLM 1911 UTC – 1933 UTC 5 June 2025 in southwest Texas (LightningCast outside the domain)
The Midland-Odessa (MAF) forecast area (and nearby upstream areas in Mexico) sits in a weird position where it is well within the GOES-East CONUS domain, but on the edge of the GOES-West CONUS domain (and thus outside the CONUS LightningCast domain), yet within the GOES-West full disk domain. The above images show GLM observations in southwest Texas from both satellites, where GOES-East shows far less lightning (and a downward trend) while GOES-West showed significantly more lightning at the same time (also with a downward trend, but still indicating a stronger storm).
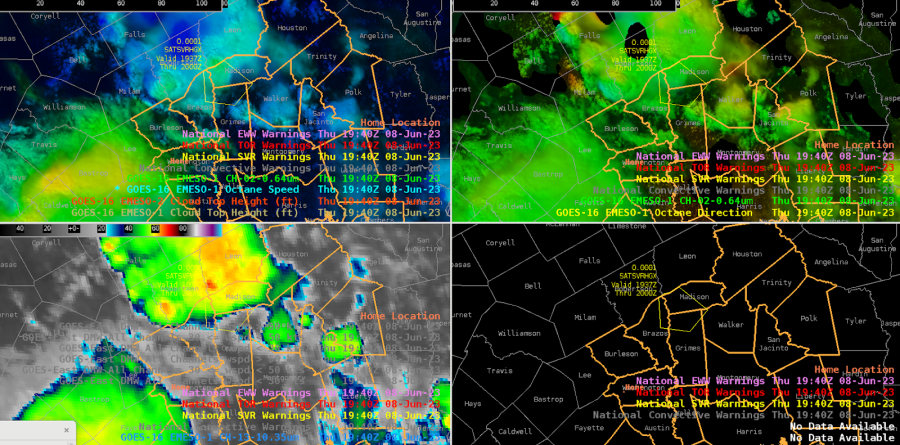
Observation 2: GOES-East LightningCast performance within areas where GLM FED is underestimating
While LightningCast data is not available from GOES-West in this portion of southwest Texas to compare GOES-West v1 vs. v2 as well as East vs. West, the quality of the GOES-East LightningCast product in areas with potentially degraded GLM observations raises an interesting question about how the models perform in this situation.
In the first GOES-East LightningCast loop shown above, version 1 and version 2 generally seem to perform very similarly, likely because of poor radar coverage and data availability. (See RQI image for the area below). Version 1 picks up on a contour of 70% ProbLightning for a developing storm to the northwest of our main cell at 1856 UTC, roughly the same time as Version 2, giving roughly a 20 minute lead time, with the first strike via GLM around 1916 UTC. Version 1’s 70% contour is larger and remains larger than version 2 for the first 10 minutes or so, before both products begin matching closely around the time of first lightning detection. Version 2 then quickly begins downtrending on that cell, seeming to pick up on lightning cessation prior to version 1 does.
Observation 2.5: GOES-East LightningCast DSS Dashboard
This storm impacted our DSS event. At 1955 UTC, DSS was provided to the partner that “lightning will be within 10 miles of the event within the next 30 minutes (by 2030Z) from a storm roughly 30 miles south-southwest of the location (the larger, southernmost storm in the GOES-East loop), a Severe Thunderstorm Warning has been issued for that storm just south of them but the warning doesn’t encompass the event, and that additional convection is going up north of the event, which may also bring lightning within the 10 mile range of the event.”
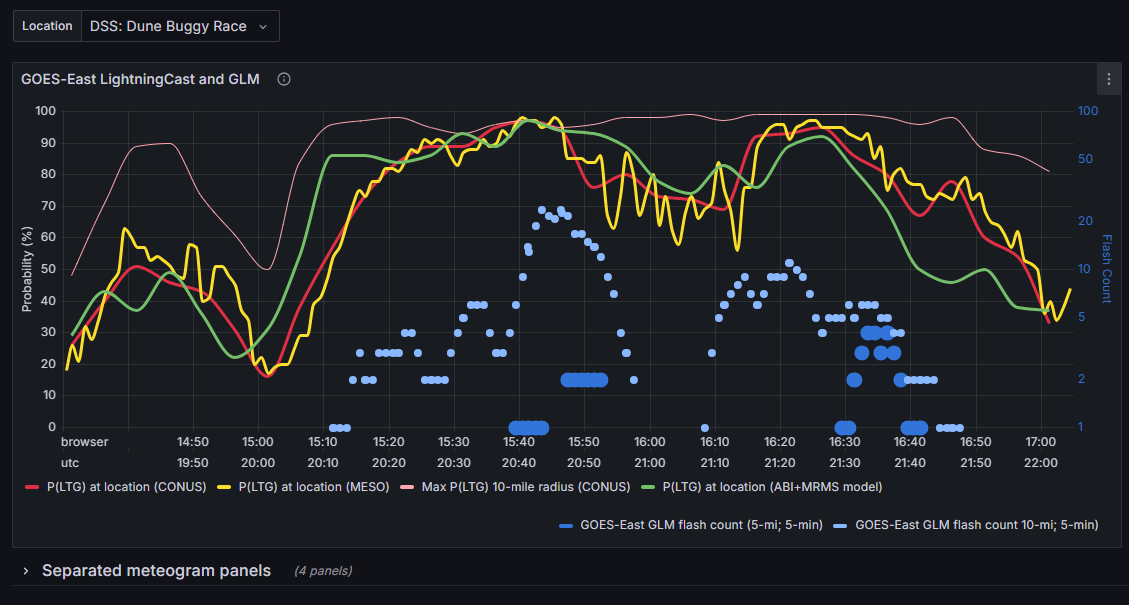
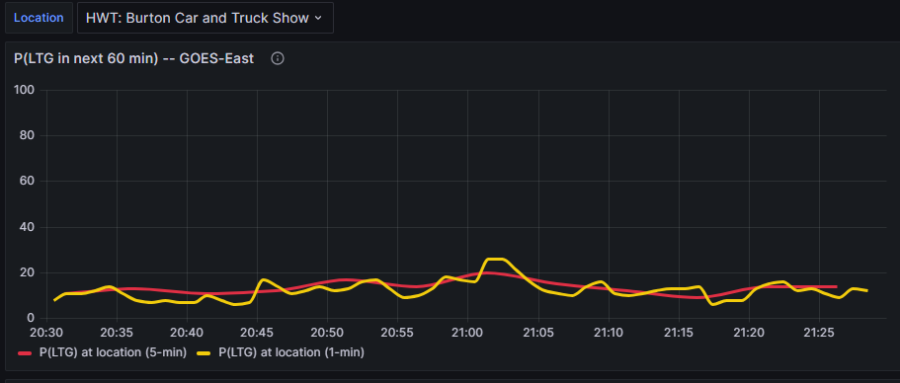
GOES-East LightningCast DSS Dashboard.
The decision to contact the partner about the DSS event at 1955 UTC was made with the help of the LightningCast DSS Dashboard, which had a max probability of lightning within the 10 mile radius of the event at 90% at the time of the contact. They were told they had less than 30 minutes before lightning was within 10 miles, and 20 minutes after that call, the first GLM strike was observed in that radius. Negating the time it took to fill out the DSS form online in comparison to picking up the phone, the DSS provided to the partner based on the dashboard output was 10 minutes late on onset, but could have been spot-on if the DSS call was provided immediately after the 10-mile radius probability reached 90% instead of waiting to see persistence before calling the partner.
Back to observation 2: GOES-East LightningCast performance within areas where GLM FED is underestimating
Also in the GOES-East LightningCast loop, there is a lower probability contour in the farthest northwest corner of the image at the beginning of the loop. Both versions pick up on it, and both versions go back and forth between characterizing this small bullseye area as continuous/connected to the two storms to its southeast and discrete. Version 2 indicates 50% probabilities briefly, while Version 1 does not. Both have probabilities dropping <10% at the same time, and lightning was never observed.
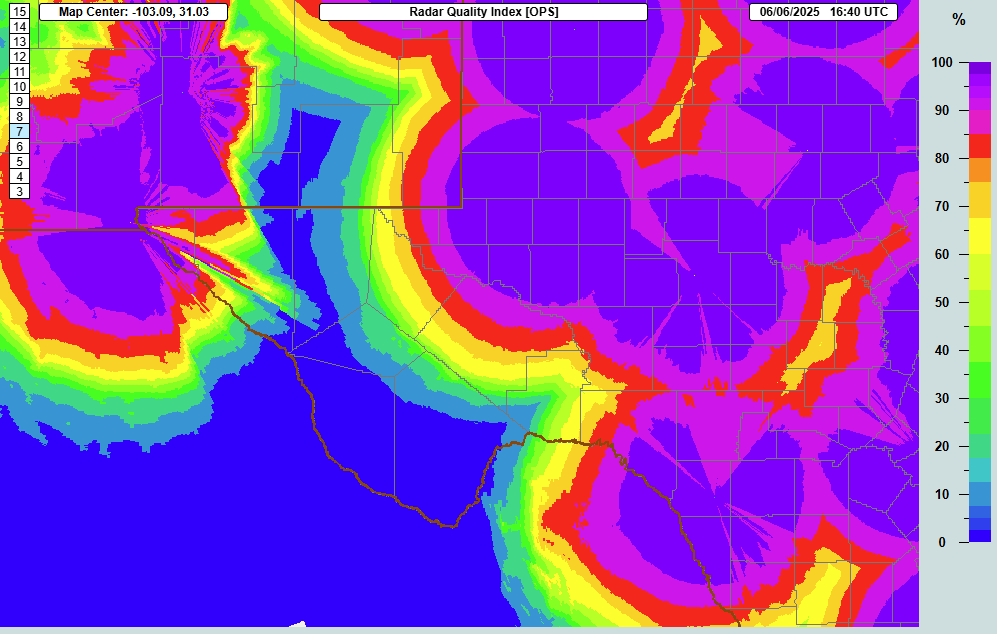
MRMS radar quality index
– prob30