Situational Awareness Graphics

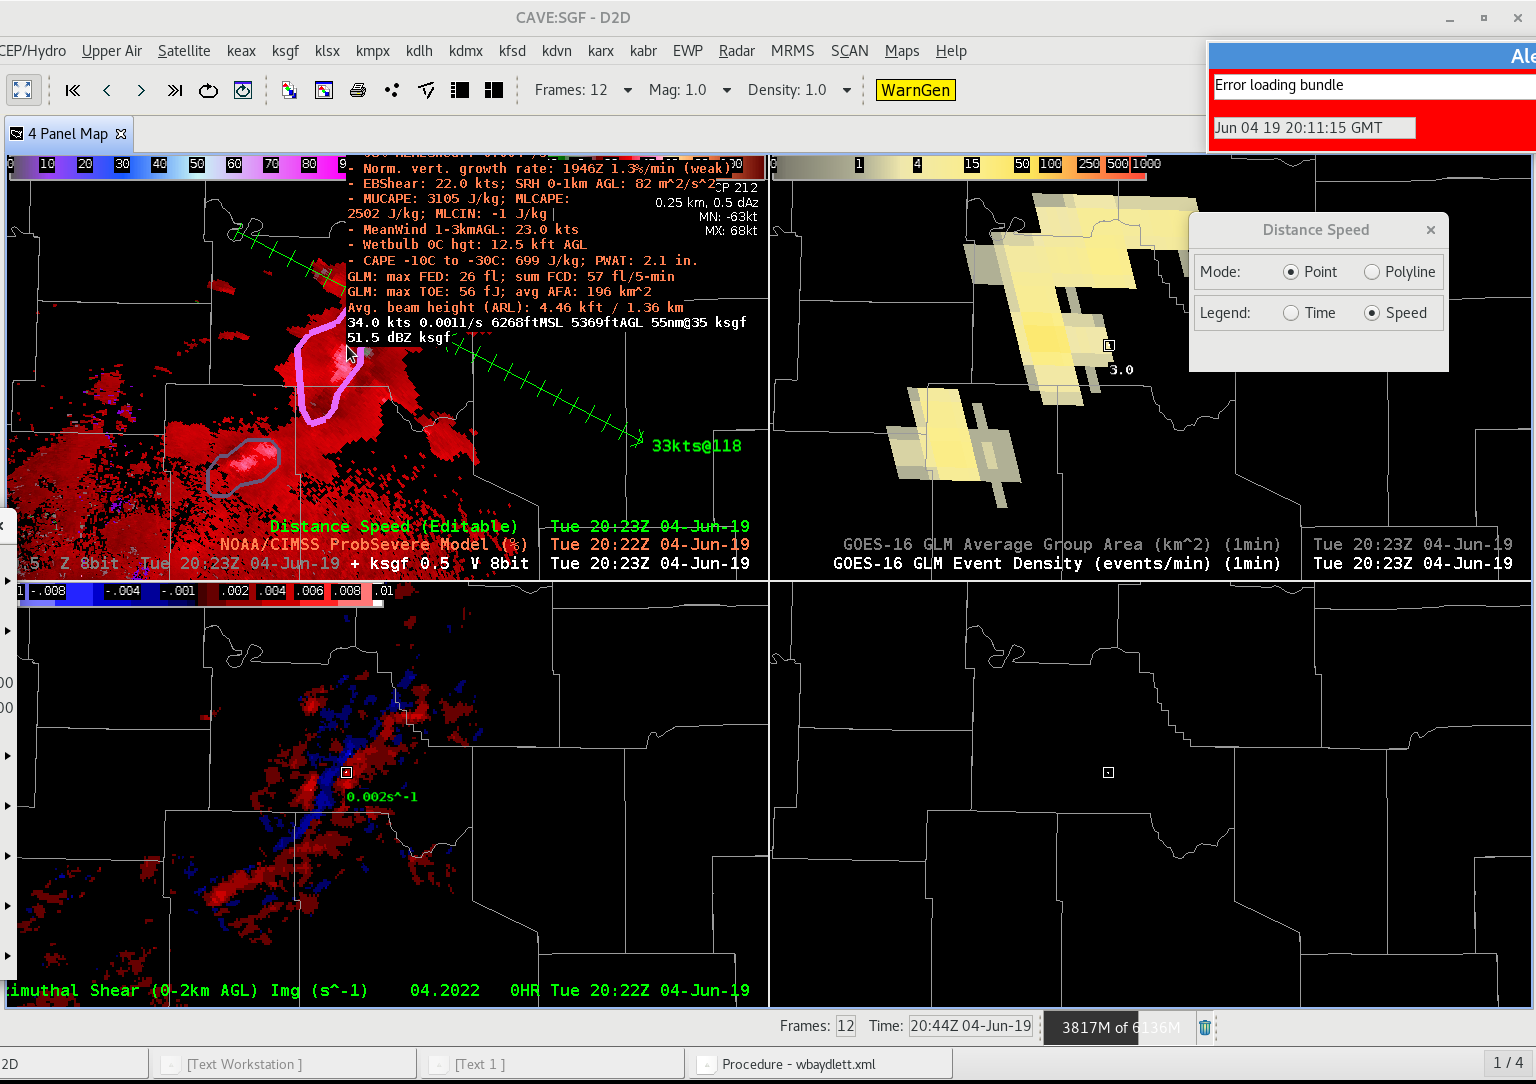
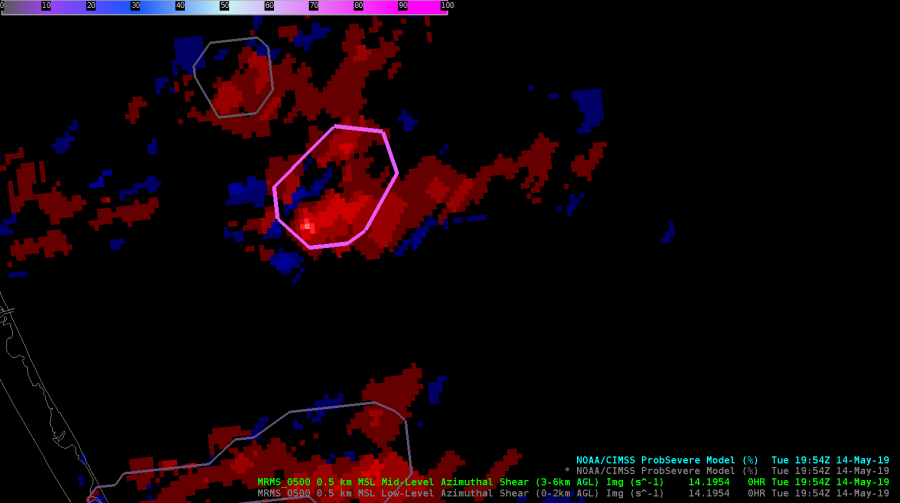
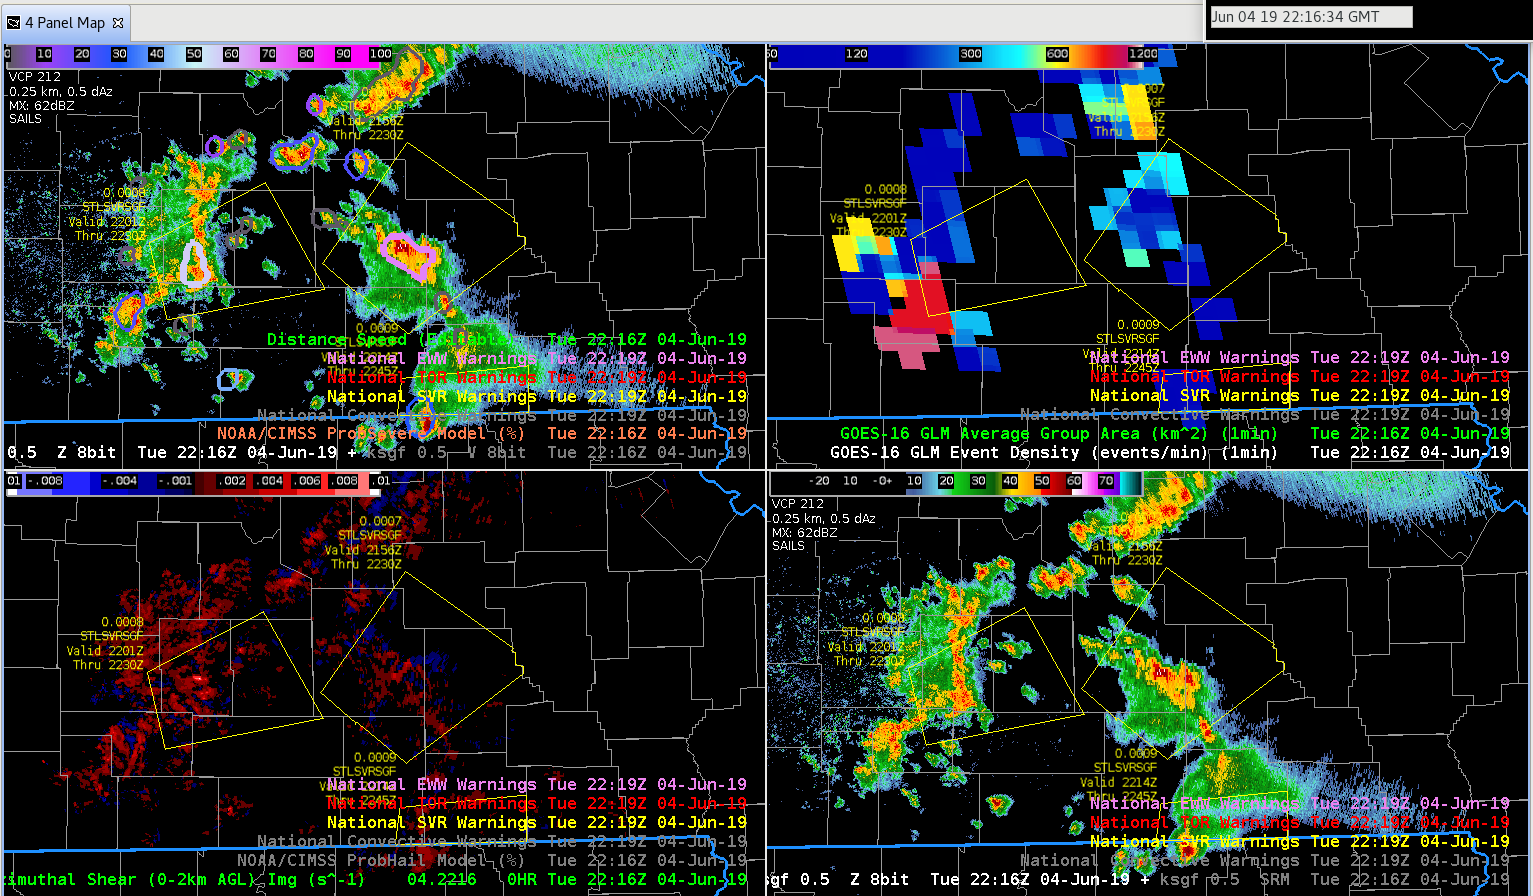
While monitoring convection across southern Missouri, the merged AzShear and ProbSevere have been great tools in diagnosing the primary severe threats: wind and hail.

AzShear has shown a few areas higher in shear, yet the ProbTor has been very low and V data has been unconvincing of the presence or threat of a tornado. ProbSevere has been useful in indicating the severe storm hazards that would be the most probable, and when compared with other data: GLM event density / avg group area, and V data, I’ve been able to issued warnings with higher confidence. GLM data will be increasingly useful with better understanding of what the different data sets mean in relation to convective development or decay.

Tags: None

-82 C Overshooting Top Precedes FED Lightning Jump

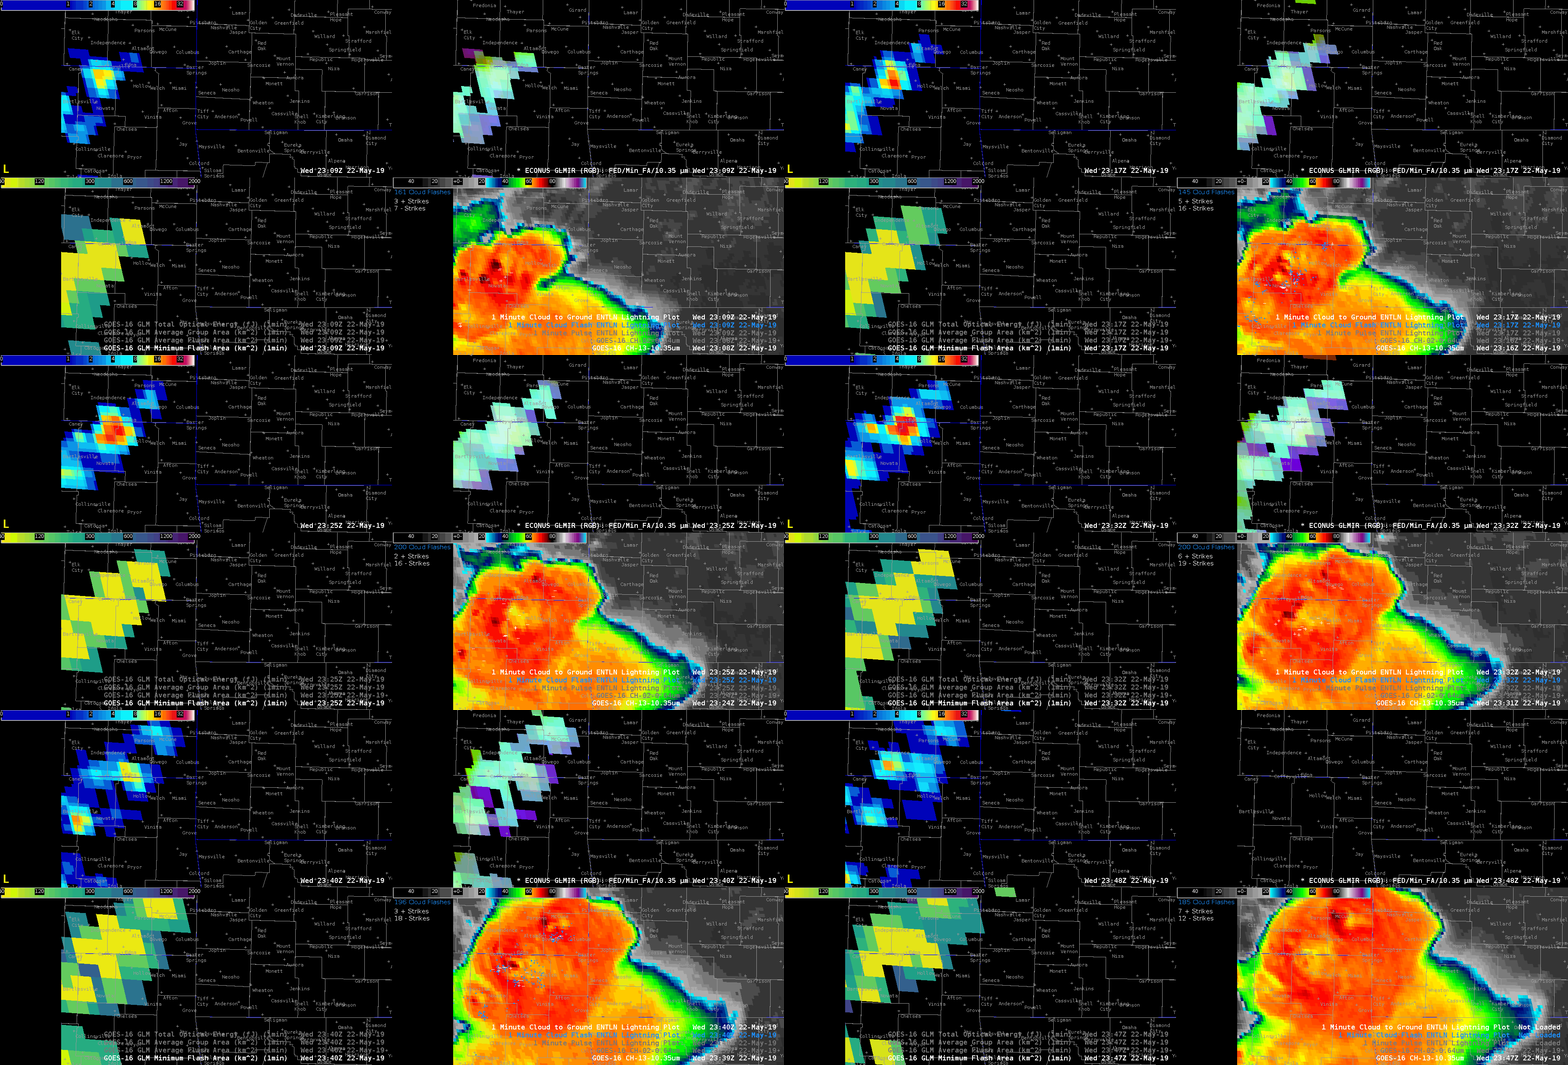
GOES-16 10.3 um IR channel in the lower right panel captured an exceptionally cold overshooting top at -82 C.  This occurred toward the beginning of the animation at 2311Z in far northern Oklahoma (south of Coffeyville, KS) and preceded a large jump in the flash extend density (upper left).  The minimum flash area did not change much during this loop, so it may be advantageous for this component of GLM to have a higher spatial resolution than what is currently used. The GLM RGB product (upper right) merges the flash extent density, minimum flash area, and 10.3 um cloud top temperatures.  A group of bright cyan and white pixels helped highlight where all three of the aforementioned components were maximized.  In addition to a substantial increase in the flash extent density 5-10 min following the -82 C cloud top temp., ENTLN ground based lightning flash counts doubled during the same time. 

Although the environmental conditions already supported warning on this storm prior to the overshooting top (OT), seeing the FED and ground based lightning double, likely  in response to the intense OT, may push a forecaster to upgrade the severity of the warning (larger hail, higher winds etc.) -Roy

Using AzShear to Forecast for Large Areas

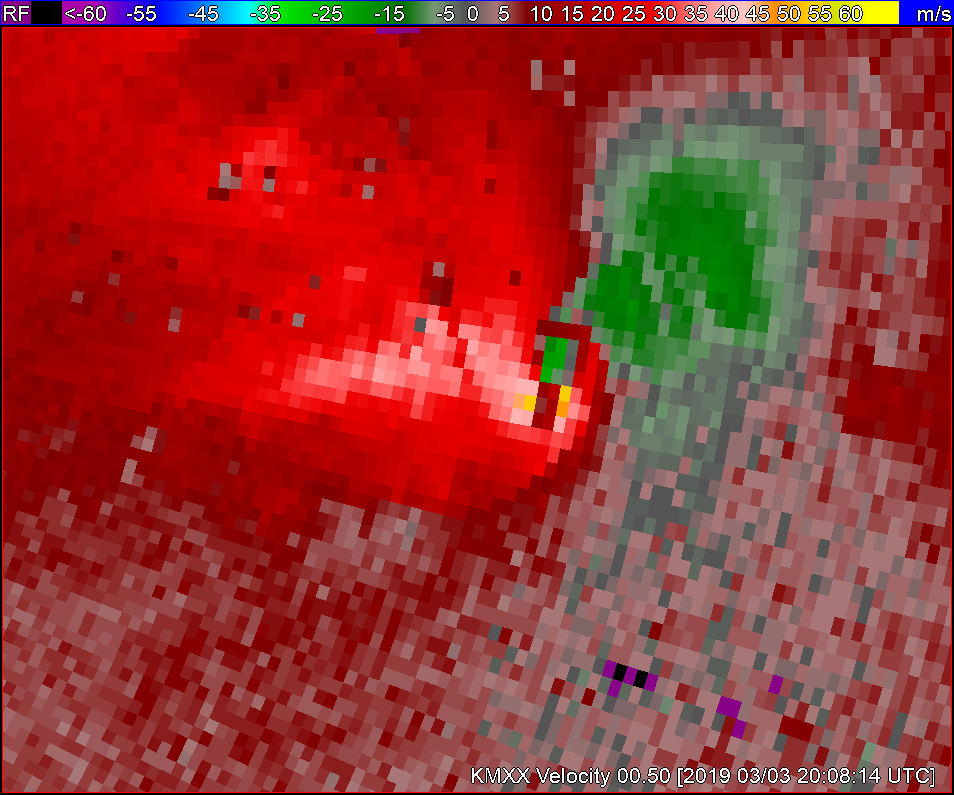
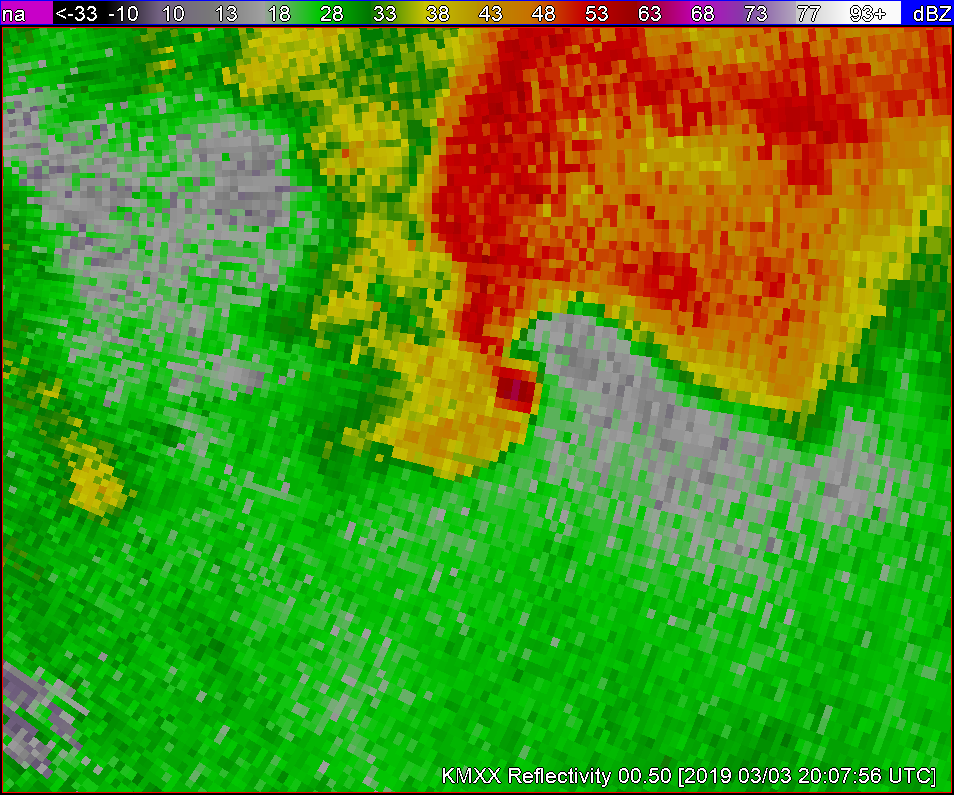
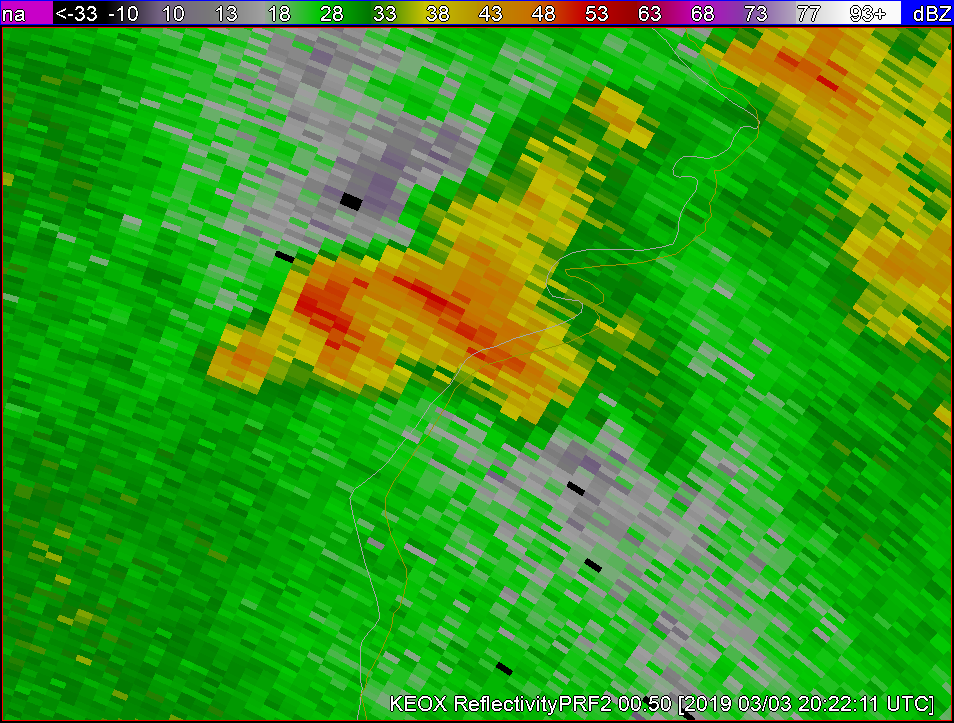
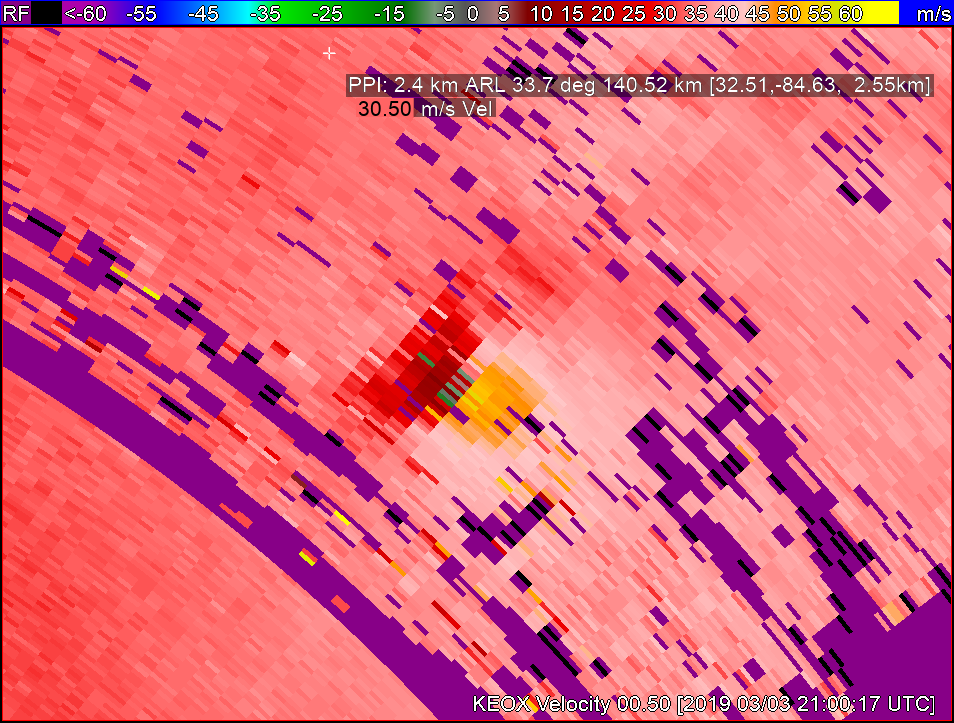
Analyzing the tornadic signatures on the KMXX RDA. This storm is quite obviously already tornadic with an apparent hook echo on reflectivity as well as very strong gate to gate velocity couplets through multiple levels. If I were to use AzShear in conjunction with the plethora of other available tools I would want the product to help me identify areas that are not as well developed as others.

In a case like this I’m not sure how much AzShear would help me forecast what is an obvious tornado. But as I am usually responsible for a very large area to METWATCH I decided to switch to the KEOX radar and zoom out to see if AzShear would help to identify areas that aren’t such a ‘slam-dunk’.

This storm to the NE of the RDA doesnt appear to be anything more than a lower threat general thunderstorm on first glance, especially when compared to other storms in the area.

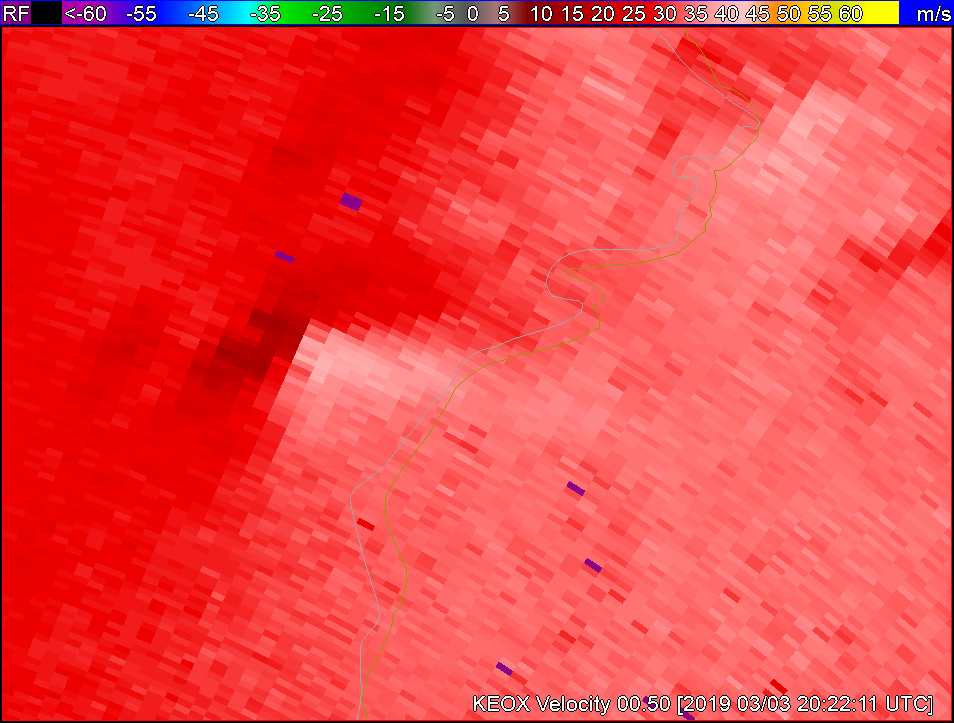
Velocity doesn’t show anything too crazy either.

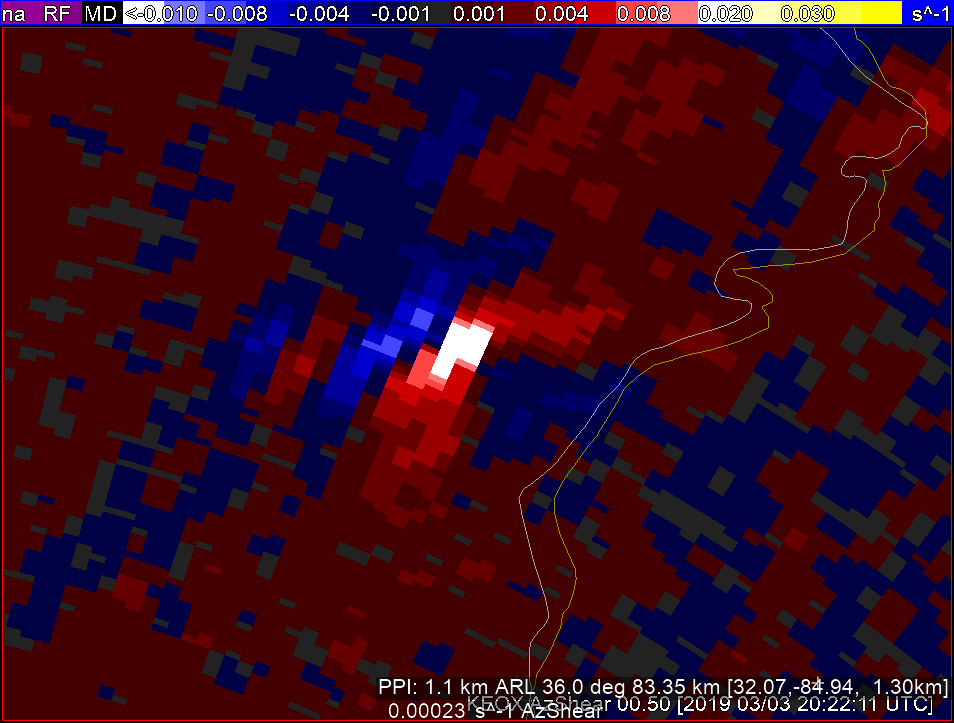
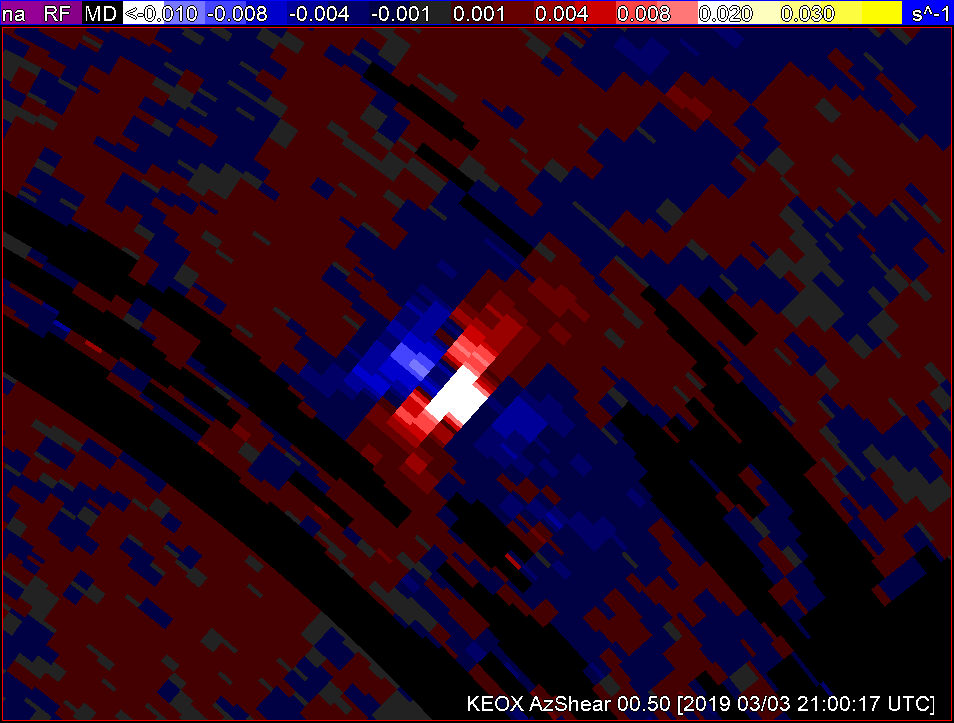
BUT when I look at KEOX AzShear  there seems to be an area of shear that may lead to something…Lets see…

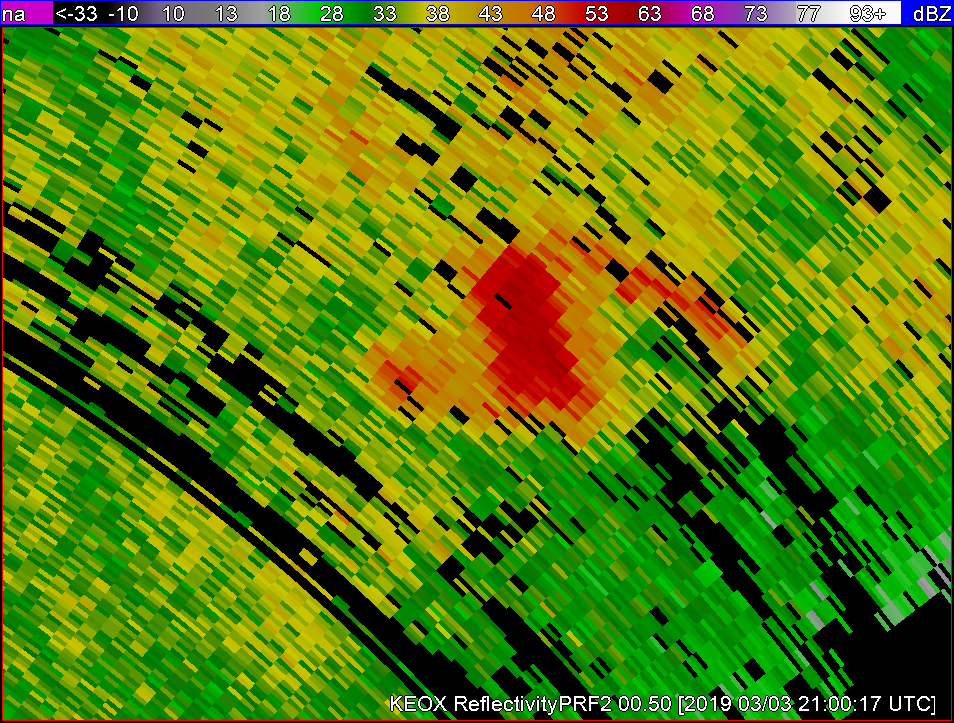
Following the same storm for 40 minutes  I noticed the following: The storm developed into a possibly severe thunderstorm with reflectivity dBzs in the low to mid 60s, significant velocity couplets as well as continued higher AzShear.

For the purposes of how I am required to warn customers, generally 1.5hr required lead time icelyfor a hit within 5nm, this 40 min advanced notice of a storm that has increased severity significantly would be invaluable when added to my stable of available tools to use.

***Desmond***

Area Discussion Prior to Severe Wx Kickoff

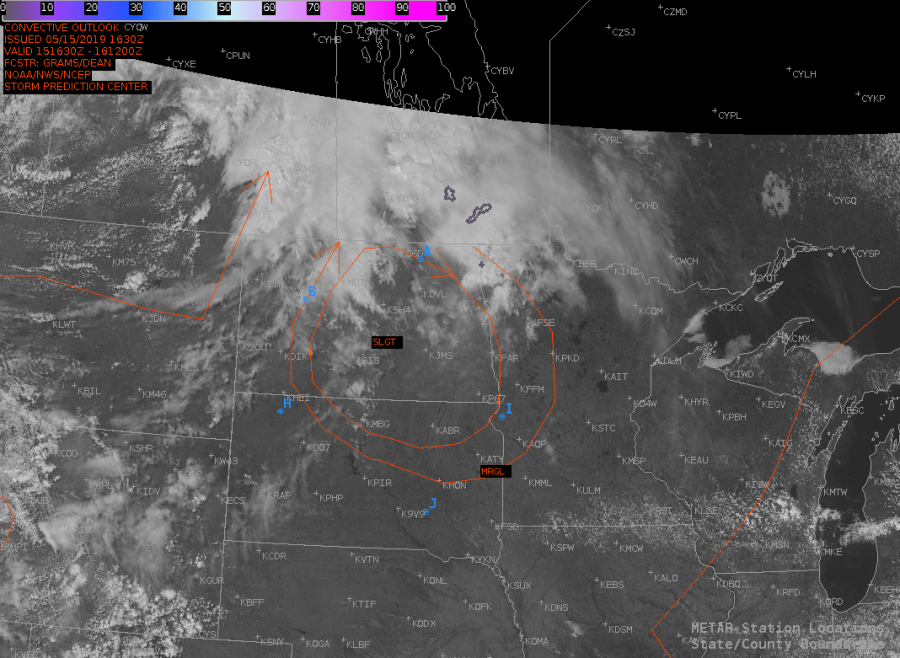
Area discussion for the Dakotas: Lower heights area located over western S Dakota and stacks from 700-500mb and will make its way easterly throughout the day. 850mb winds from the south at 30Kts.

METSAT shows low/mid clouds moving into ND from the west with clearing over the center of the states where wx is expected. Upstream surface observations support this clearing as they show dry air advecting into the area from the south.

Radar shows weak convective activity to the north moving into Canada. Models and the SREF are in agreement that the majority of thunderstorm development happen around 1-3z.

Merged TPW Composite total PW values over the center of the N/S Dakota states where convection is expected according to SPC outlook is less than 1” with values between .80-.95” and AllSkyLAP 900mb PW is even lower at .30”.

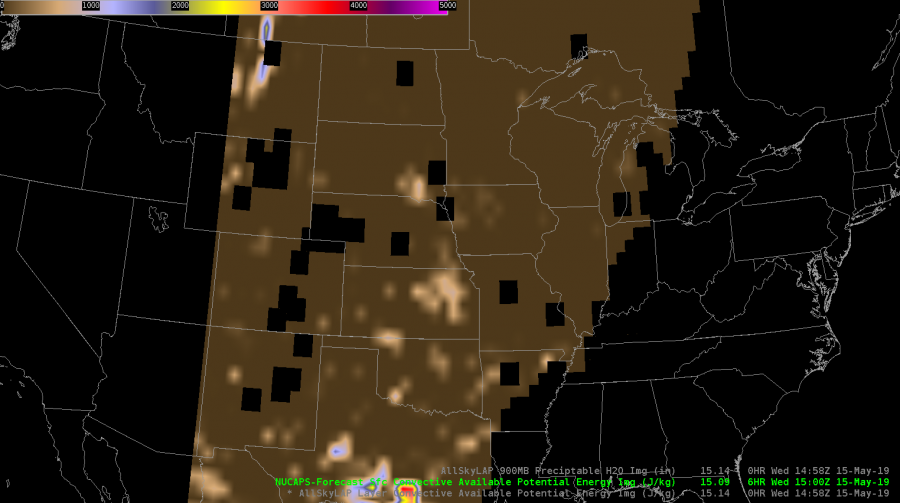
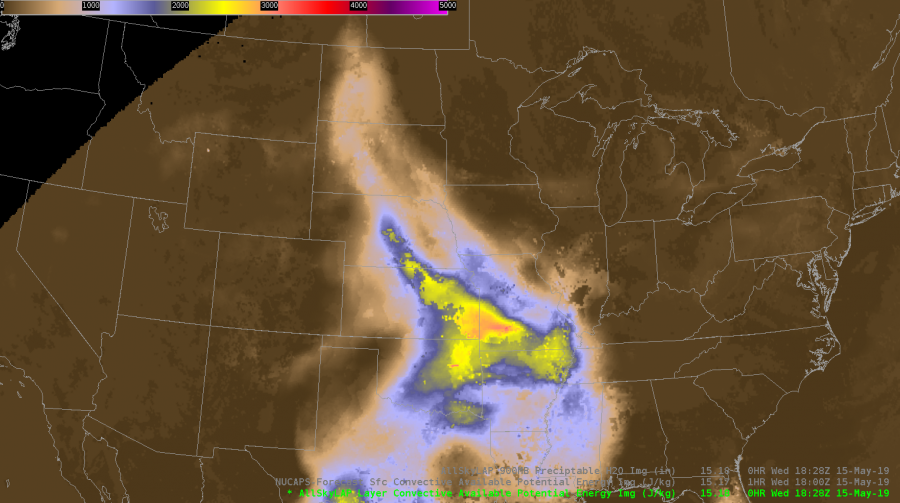
NUCAPS fcst Sfc CAPE overlay CAPE values range between 400-500/kg but there are quite a few gaps in coverage.

Meanwhile AllskyLAP CAPE shows 900-1500J/kg, and NAM models show extremely high CAPE values of 3000-4500J/kg.

Local TAFs show no thunderstorms or even rain while the SPC continues to carry SLGT over the Dakotas. It’ll be interesting to see how this scenario plays out as the day progresses.

–DESMOND–

Fun 30 minutes of storms in Florida

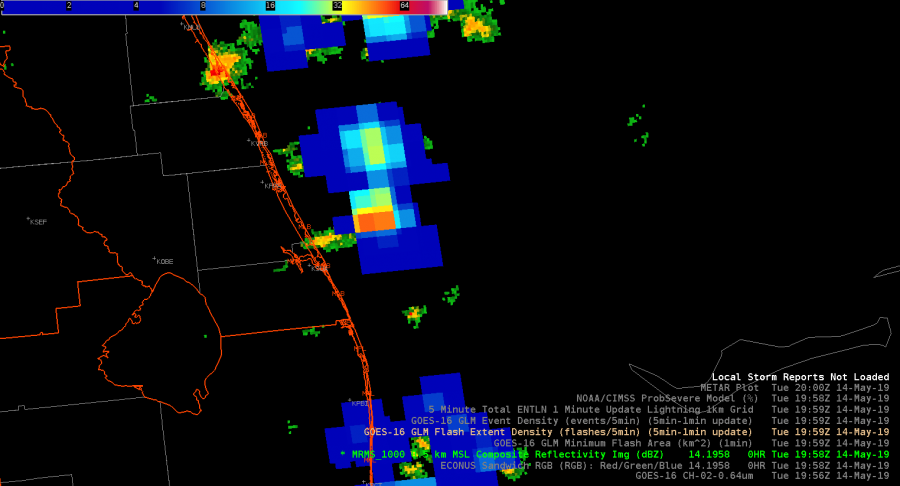
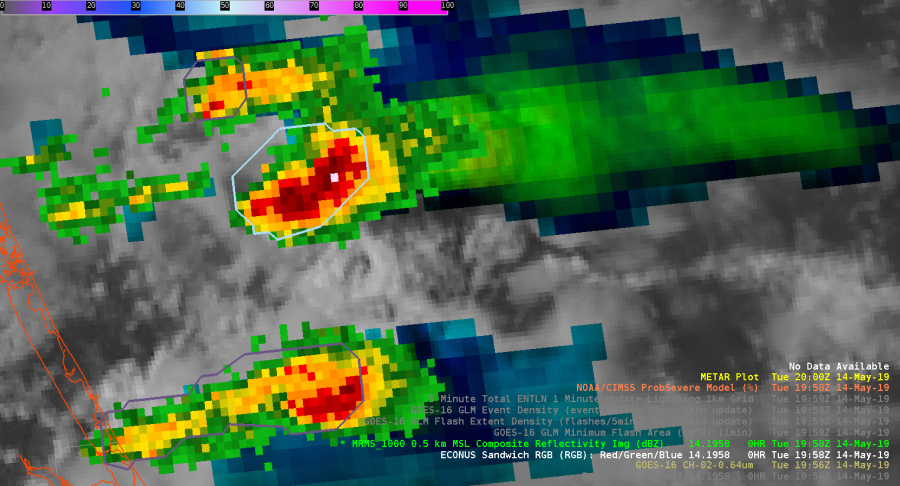
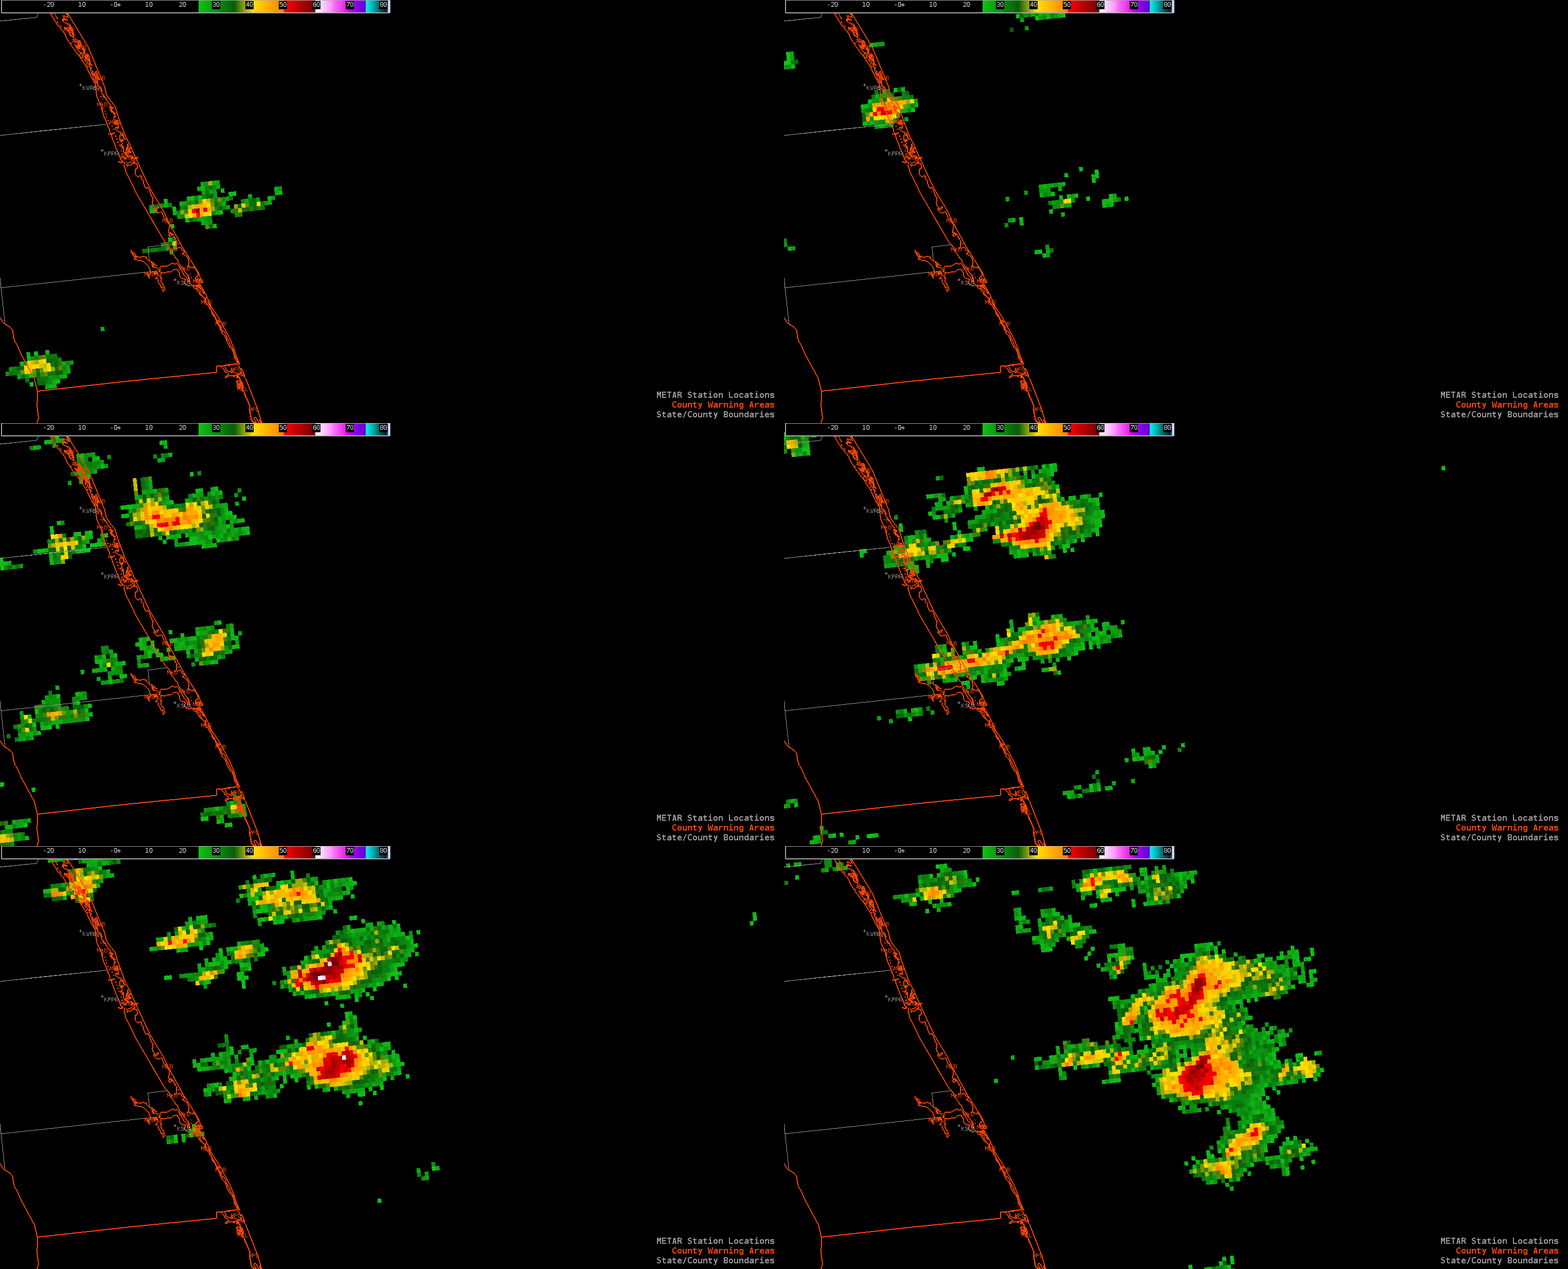
There was a nice area of convection moving off the east coast of Florida with storms forming off an apparent outflow boundary moving to the south. As the storms moved off the coast they increased intensity exponentially. Focusing on these storms as they moved over water reflectivity showed max dBzs in the low to mid 60s with tops 45-50k ft high. GOES-16 Event density (5min-1min update) showed a value of 247 suggesting a nice updraft, which AzShear seems to further support with a bright white color and value of .007s^-1 exactly where the max dBzs/echo tops/GLM data is. In addition,prob severe did a good job of tracking the storms…but with the storms moving off the coast it is impossible to get any storm reports to verify its accuracy.

Utilizing all of this data I would most definitely want to issue a localized small craft or some sort of marine advisory or warning…if there was one for this are. -Desmond

AzShear .007s^-1

GOES-16 Event density (5min-1min update)

Max dBzs in the low to mid 60s


GOES 16 – Full Disclosure

Ok, last post….honesty time.

I didn’t make this a secret in my application that I had been out of meteorology for about 4 years between 2014-2018. During that time, GOES-16 launched. As I returned to broadcasting, I didn’t adequately spin-up on the new capabilities of this new generation of satellites. I was aware of the spatial and temporal resolution improvements of course – what meteorologist – currently working in or out of the field, didn’t get excited about 1 minute imagery?

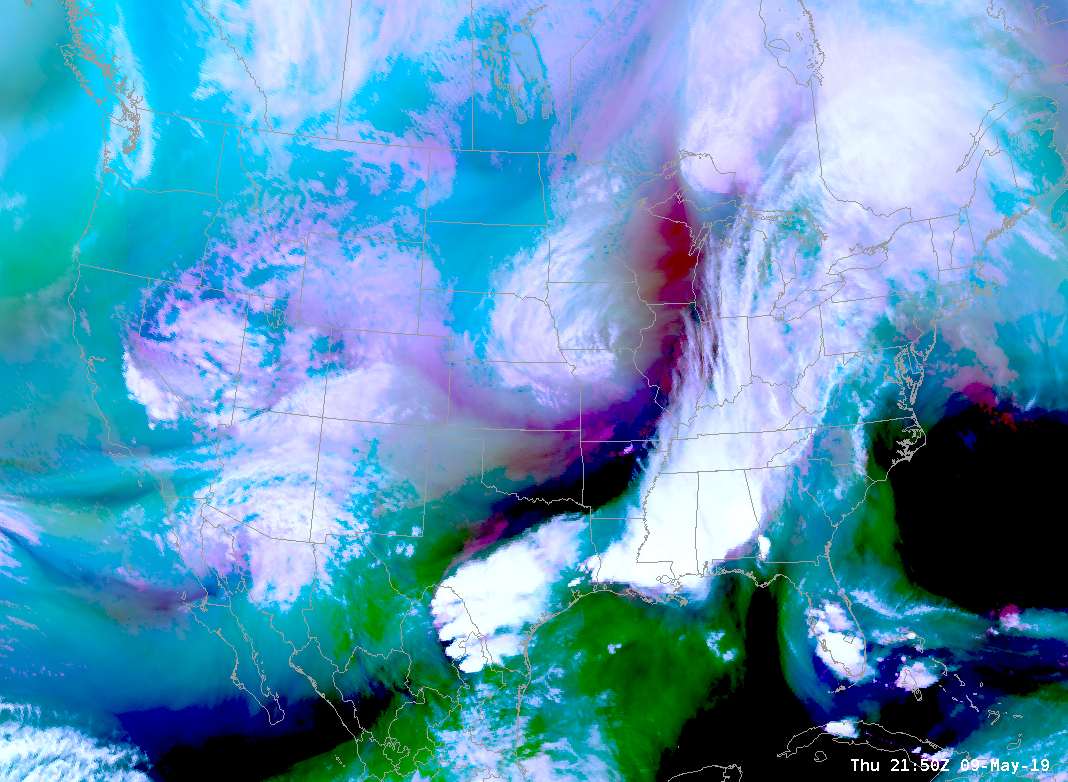
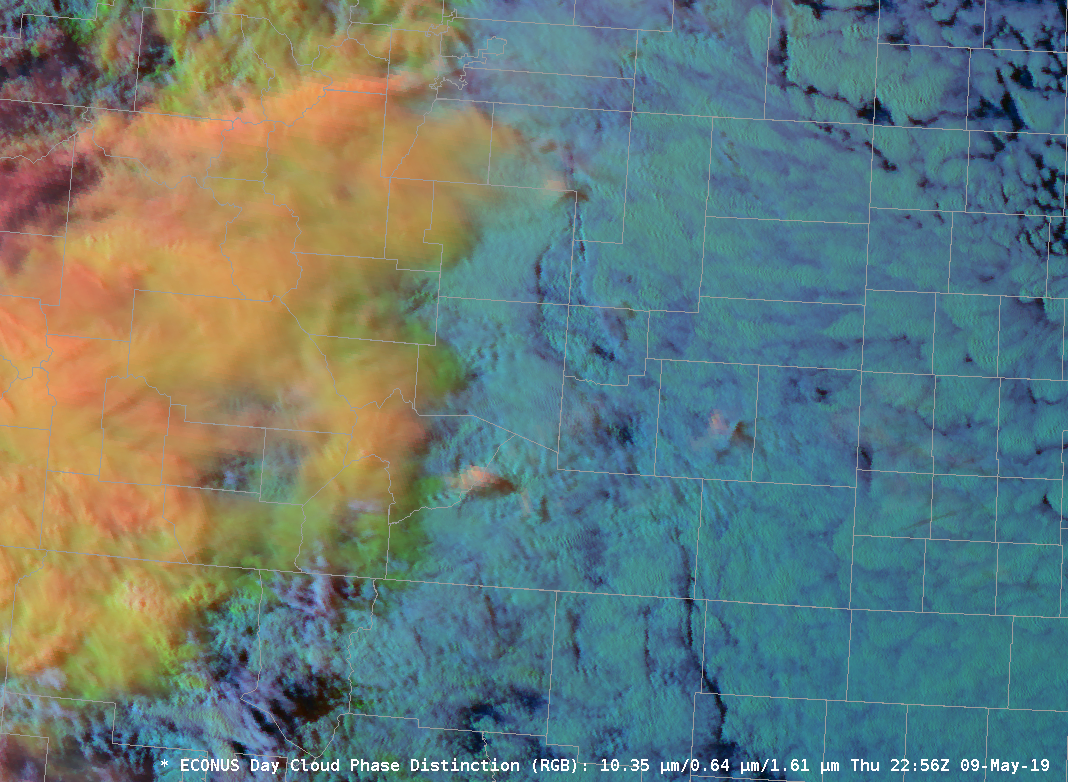
However, I wasn’t aware of some of the RGB combinations that I’ve been exposed to here at the HWT. The features that can be picked out by applying coordinating colortables to multiple channel views is simply astounding. I’ve used the simple water vapor, day cloud phase distinction, day convection, differential water vapor RGBs this week….I’ll be making a phone call to my broadcast weather vendor. I know I’ll need to get some other broadcasters on board with me to lead a charge, but count me in. Until then, I’ll be livin on the CIRA RMMB Slider site!

Color (RGB) Me A Fan!

-icafunnel

Minimum Flash Area Shows all the Features

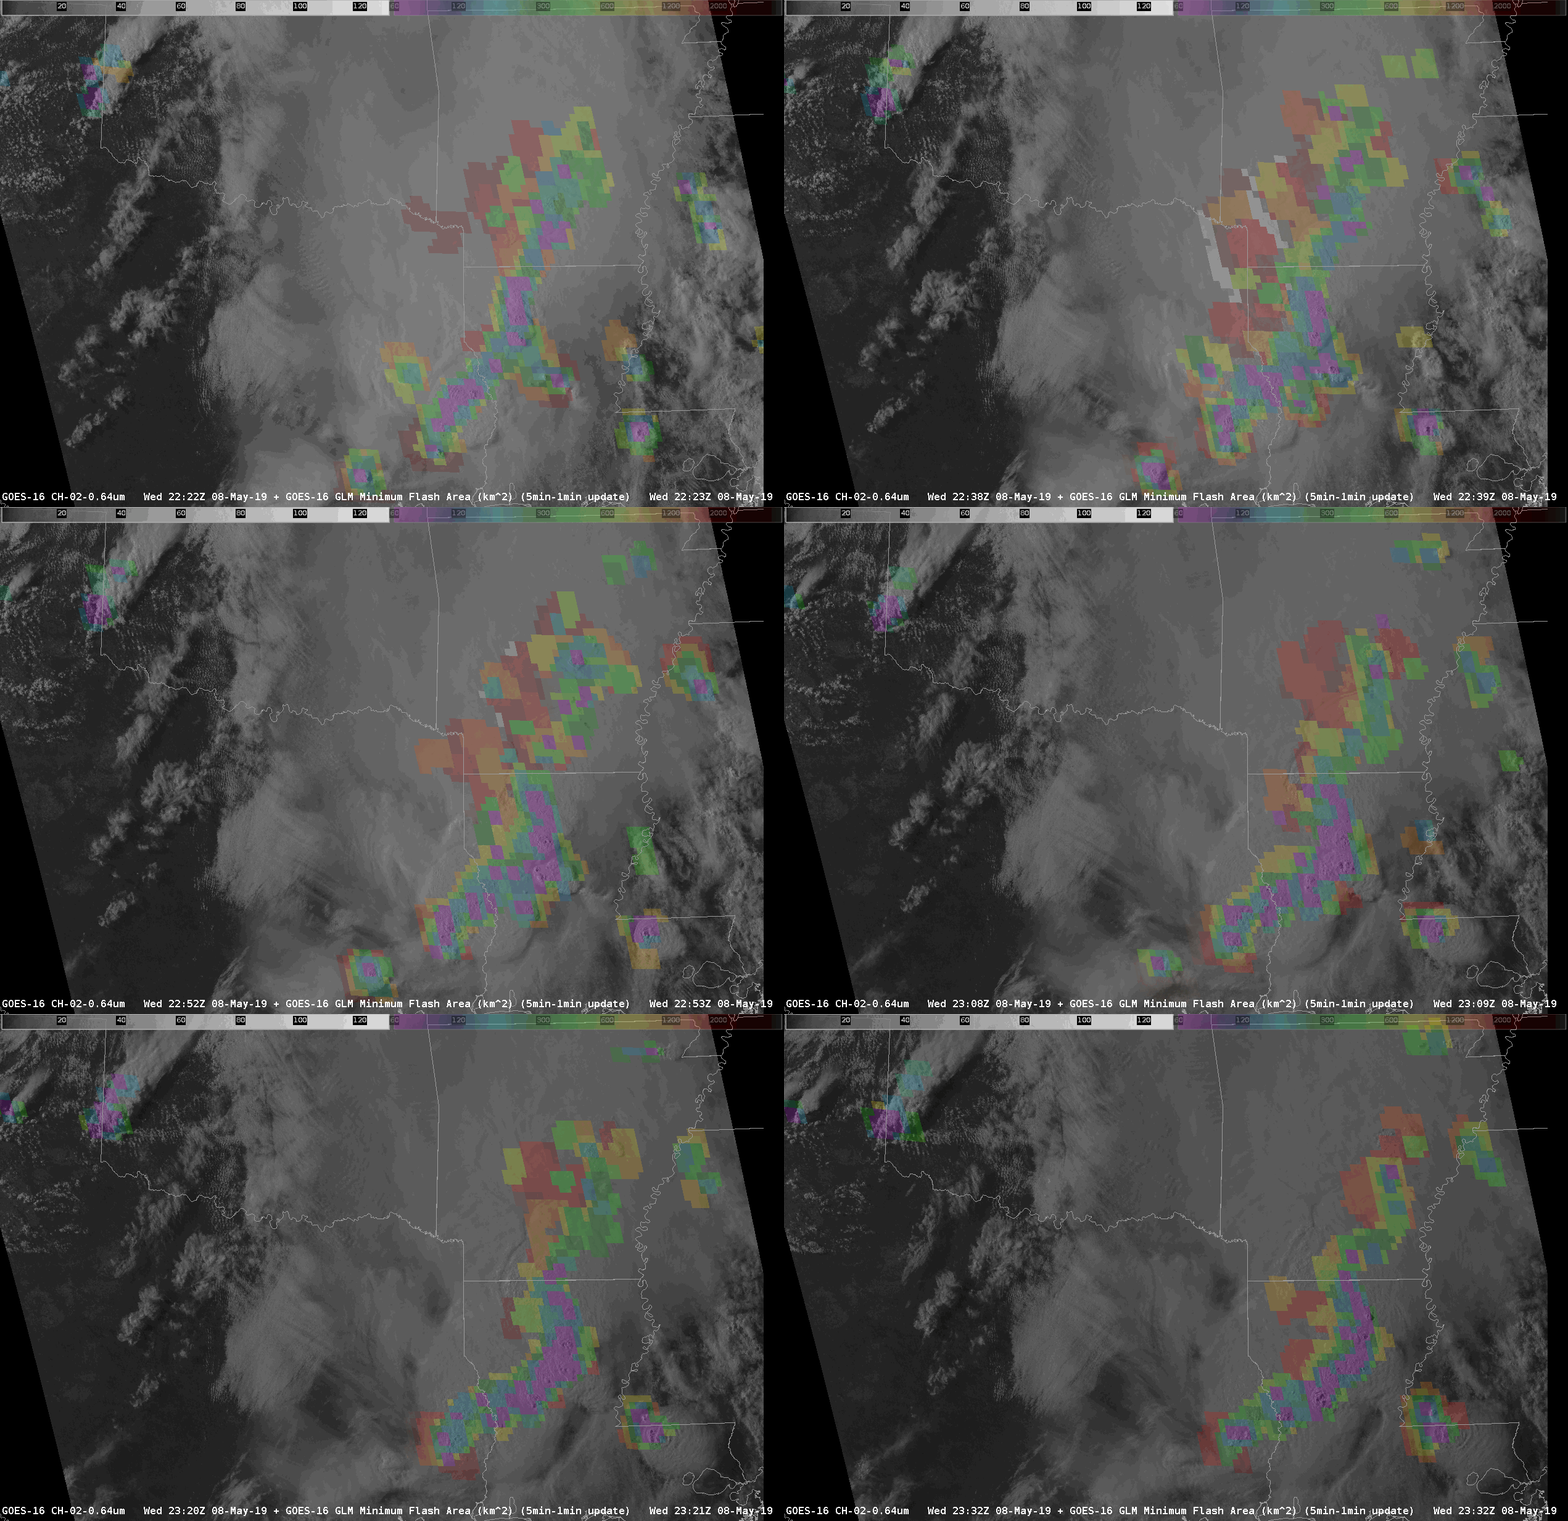
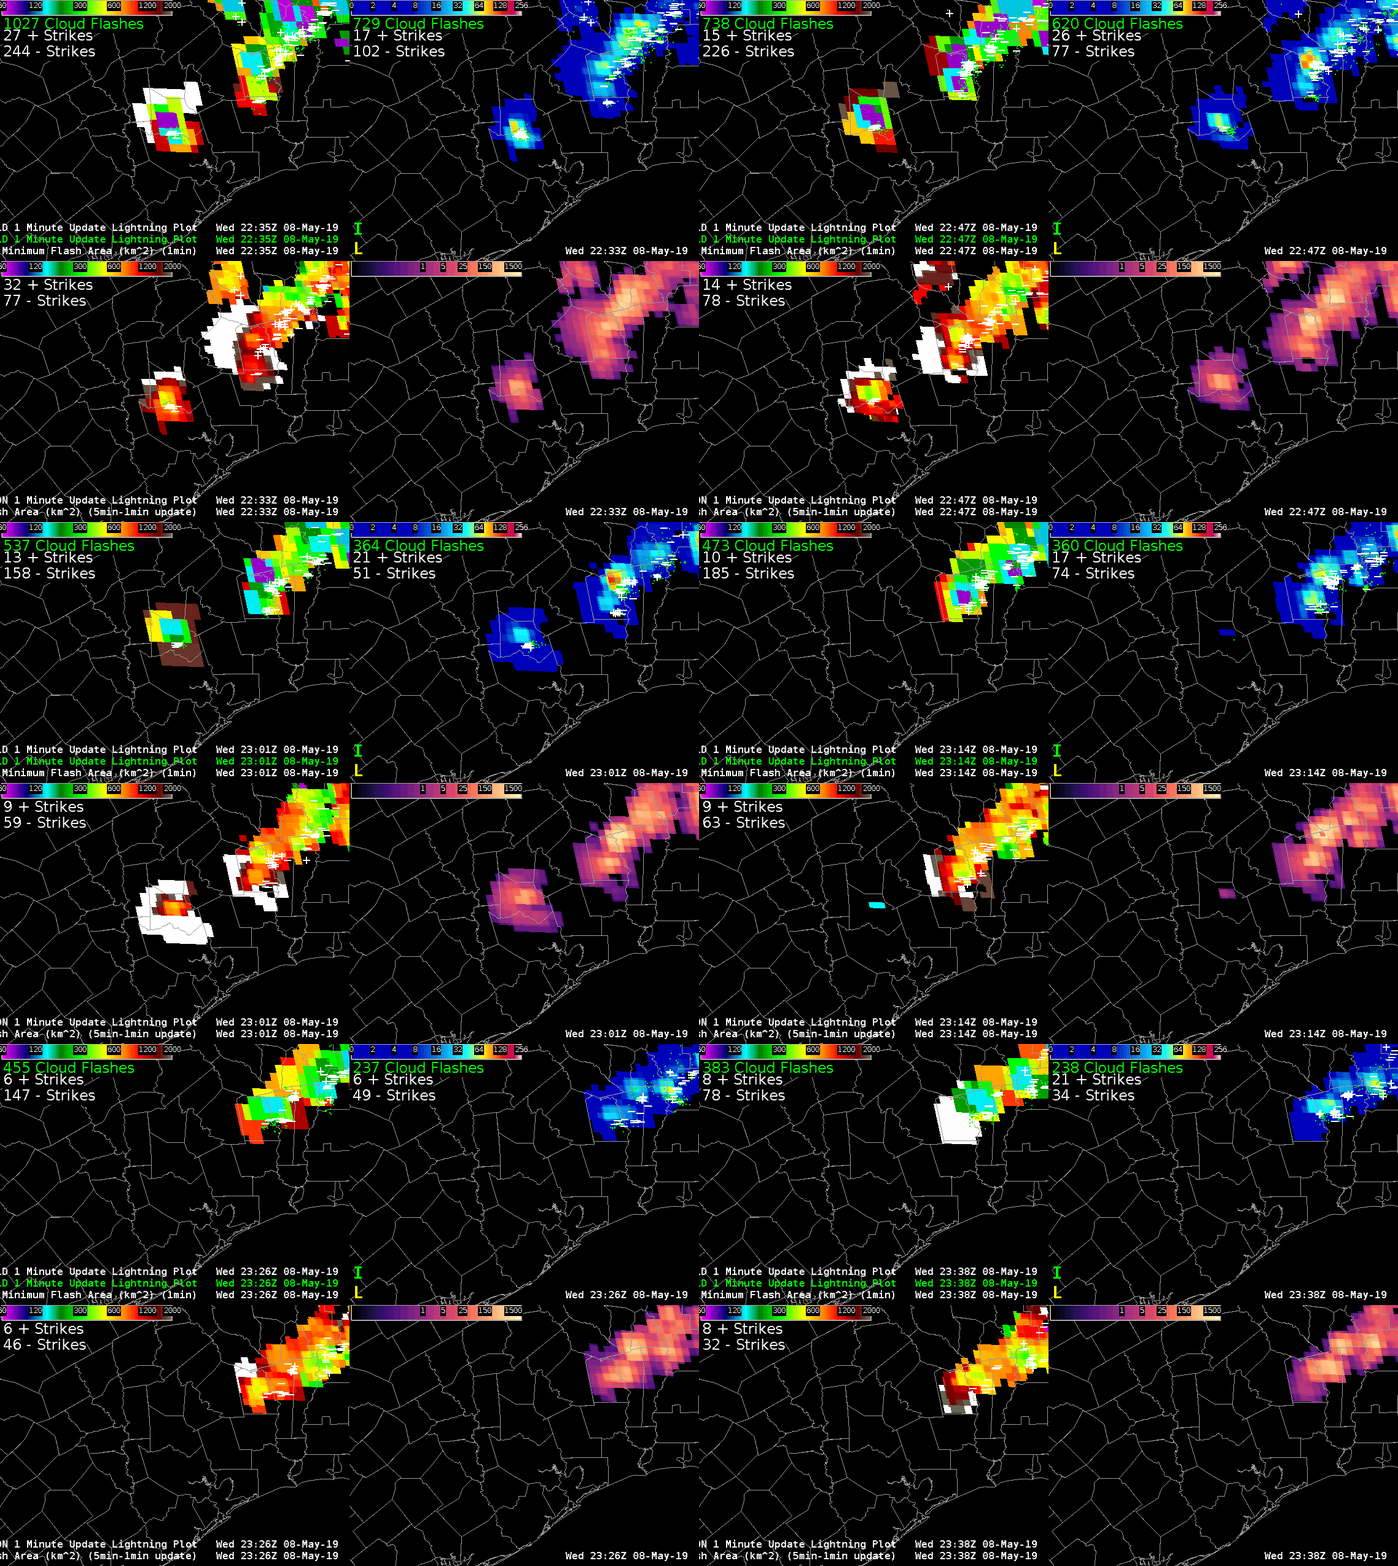
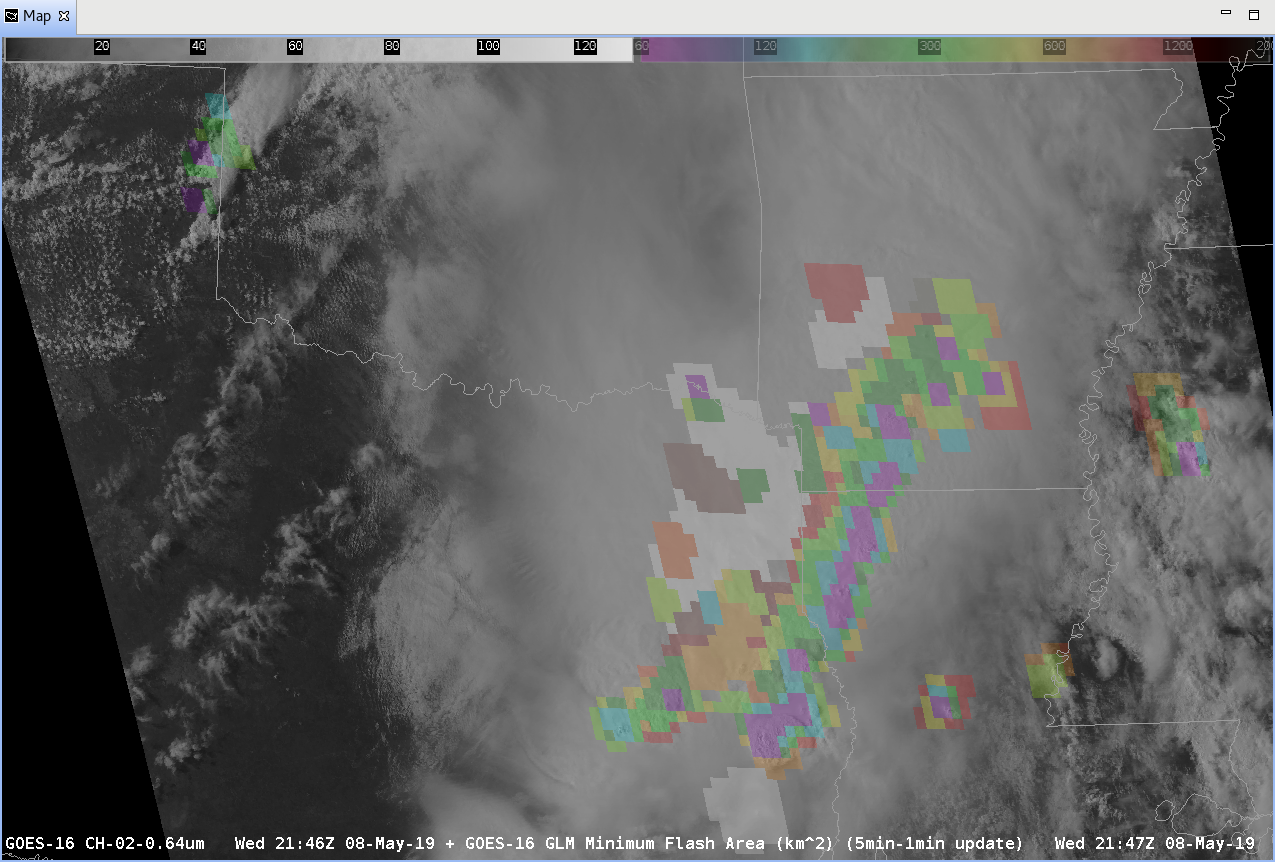
As we move towards sunset, the MCS continues to munch across the southeast Tejas, Louisiana, and portions of Arkansas.  There is alos a strong storm developing ahead of the MCS in SE Louisiana.  Add in some storms across Northwest OK and there is whole spectrum of flash sizes is showing up now:

What is neat about this image is that the small flashes (purple) are concentrated near the overshooting tops of the storms.  The  large area flashes (red to white) are in the trailing stratiform area.

One other cool tidbit I just saw in this loop; watch the southwestern part of the line where a storm weakens and dissipates; flash area basically shows that all electrical activity ceases along with the storm.  Looking closer:

-Dusty

NUCAPS in the Forecast Process

I know, I know; a lot of posts about the GLM.  What can I say…I’m a lightning person.  ANYWAY, let’s look at some other things that we are testing; today it is NUCAPS soundings.  Pretty handy when you don’t have a sounding station nearby and if skies are clear (well, mostly clear…it works with clouds in some situations); you can get a sounding profile for your area.  Nice!  The caveat is that you need to have a satellite overpass across your area and that is the tricky part.  There are only a few satellite overpasses on any given day and you have to be right under the overpass to get the best data but we can make it work.  Here is one from today and we’ll look at the point right on the TX/OK state line.

With a possibility of storms across western Oklahoma along the cold front as it moves east, we need a point somewhere in the warm sector with a close enough METAR site that we can adjust to if needed.  That point along the TX/OK state line should work…
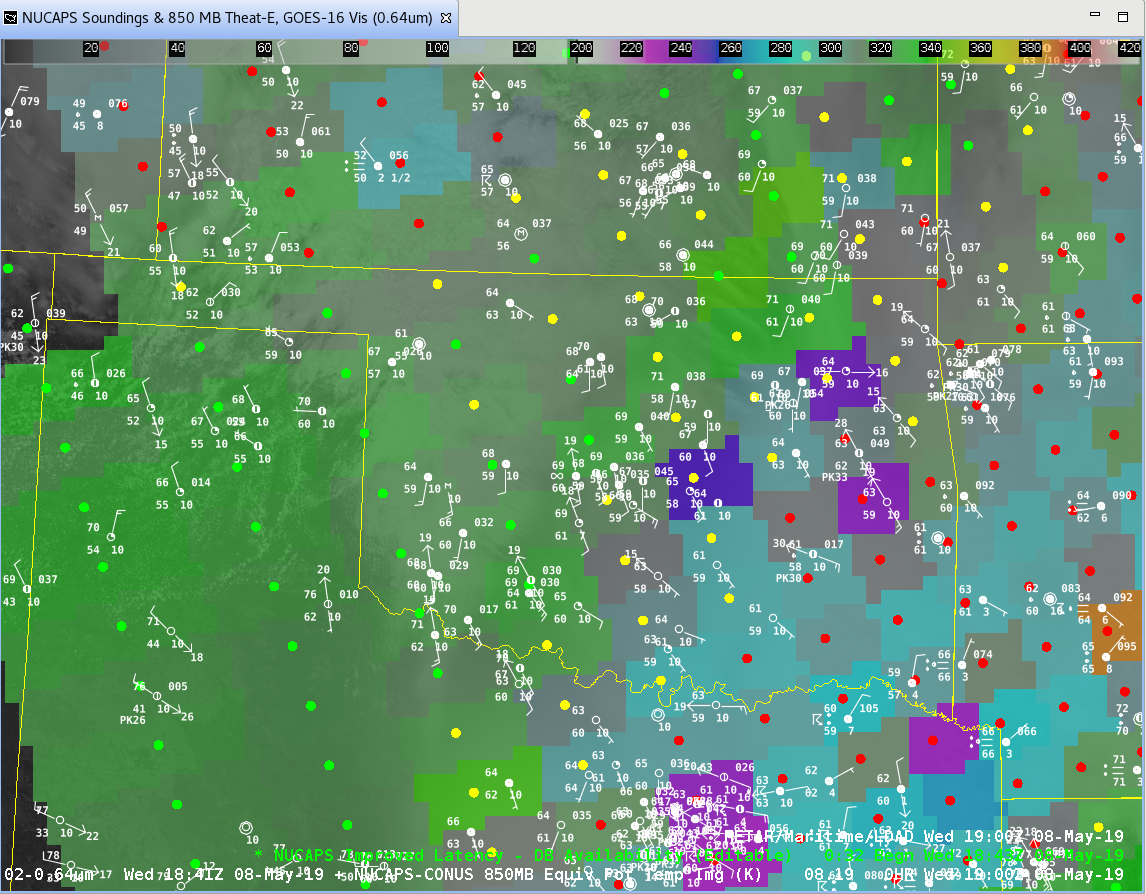
Here is what the original, unedited sounding looks like:
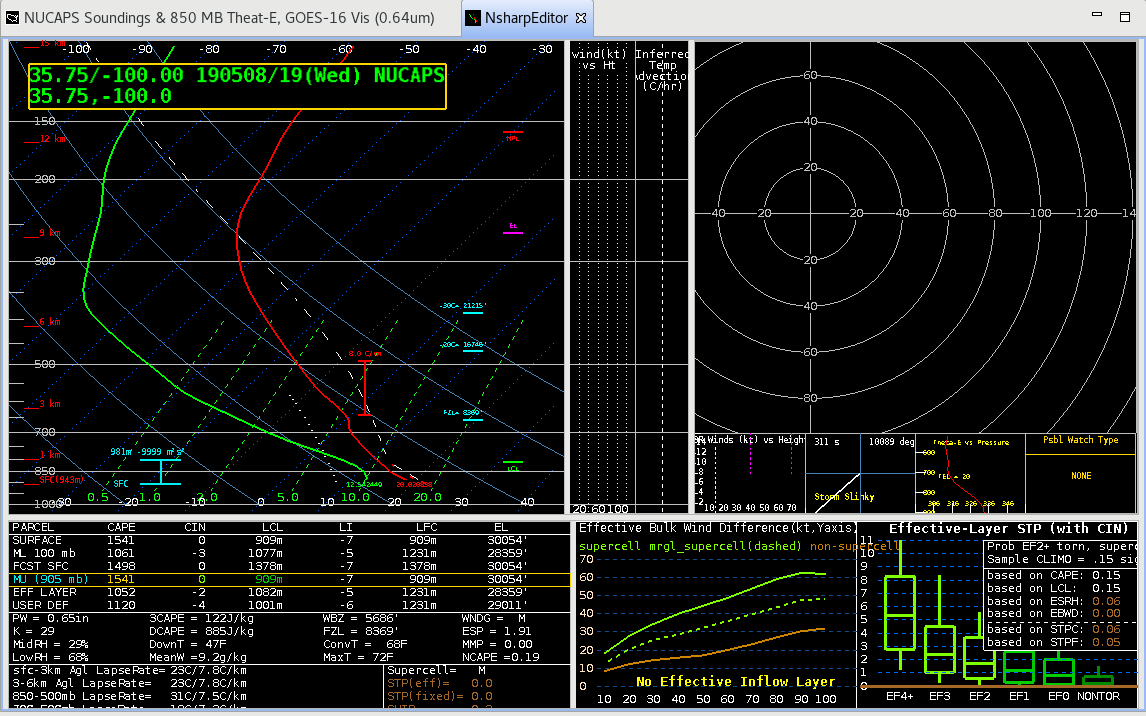
It’s not too bad; comparing to the 12Z Amarillo and Norman soundings (not shown), the soundings do have an EML between 3-4 km  which the NUCAPS sounding temperature profile does hint at although it doesn’t have the dry air associated with it, and the NUCAPS sounding does have the tropopause a bit lower than the actual soundings.  Overall however, it looks at least somewhat representative.  However, the one area it needs some work is the surface.  Dewpoints are a bit low with the sounding around 54 F but the temperature is within 1-2 F of surrounding METARs.  Well, let’s adjust the surface parcel in the sounding to match surface conditions in the warm sector to the east; say a Td of 60 which should advect northward through the day…
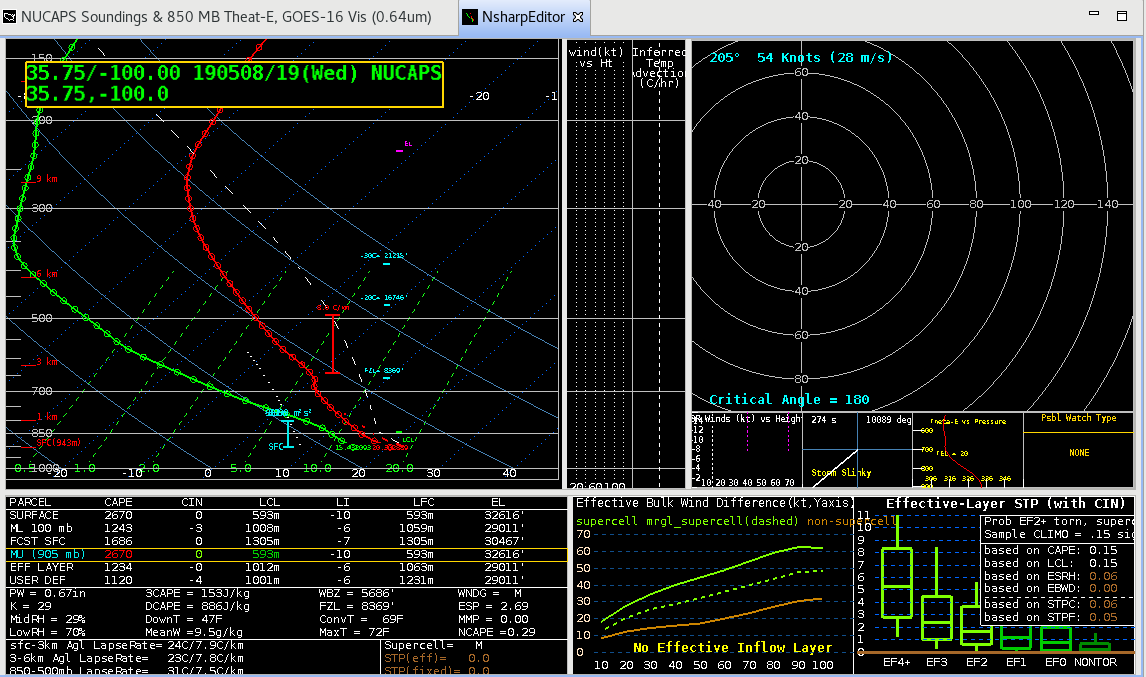
Wham.  MUCAPE values jump by almost 1000 J/kg.  But that’s pretty optimistic so let’s used MLCAPE which is a smaller, but still respectable increase of 200 J/kg.   Not to shabby and should indicate at least the potential for storms to form.  But what does that CAPE value compare to other fields?  Well, fortunately NUCAPS is available in a plan plot so we’ll look at that along with the RAP40 CAPE values.
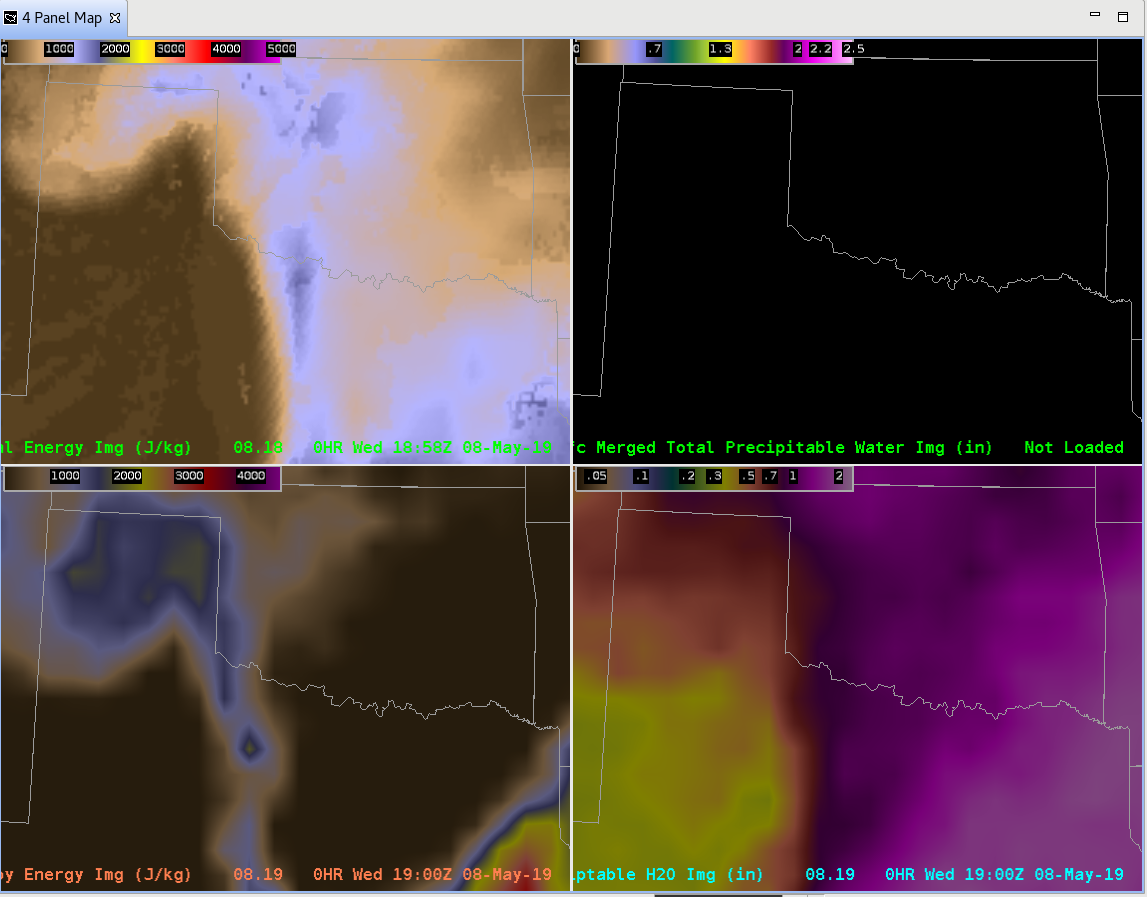
Unfortunately the NUCAPE sounding was a bit fast with the dryline pushing east and had CAPE values along the TX/OK state line around 475 J/kg so…no.  The RAP40 wasn’t too far off with values around 1500 J/kg.

So, if you are looking for some extra “sounding” profiles in and around your area AND you are lucky enough to be under one of the  Polar Orbiter tracks that has a sounder on it, give it a spin.  I think I’ll be looking at it quite a bit more…

-Dusty
Scale (and color table choice) is Everything

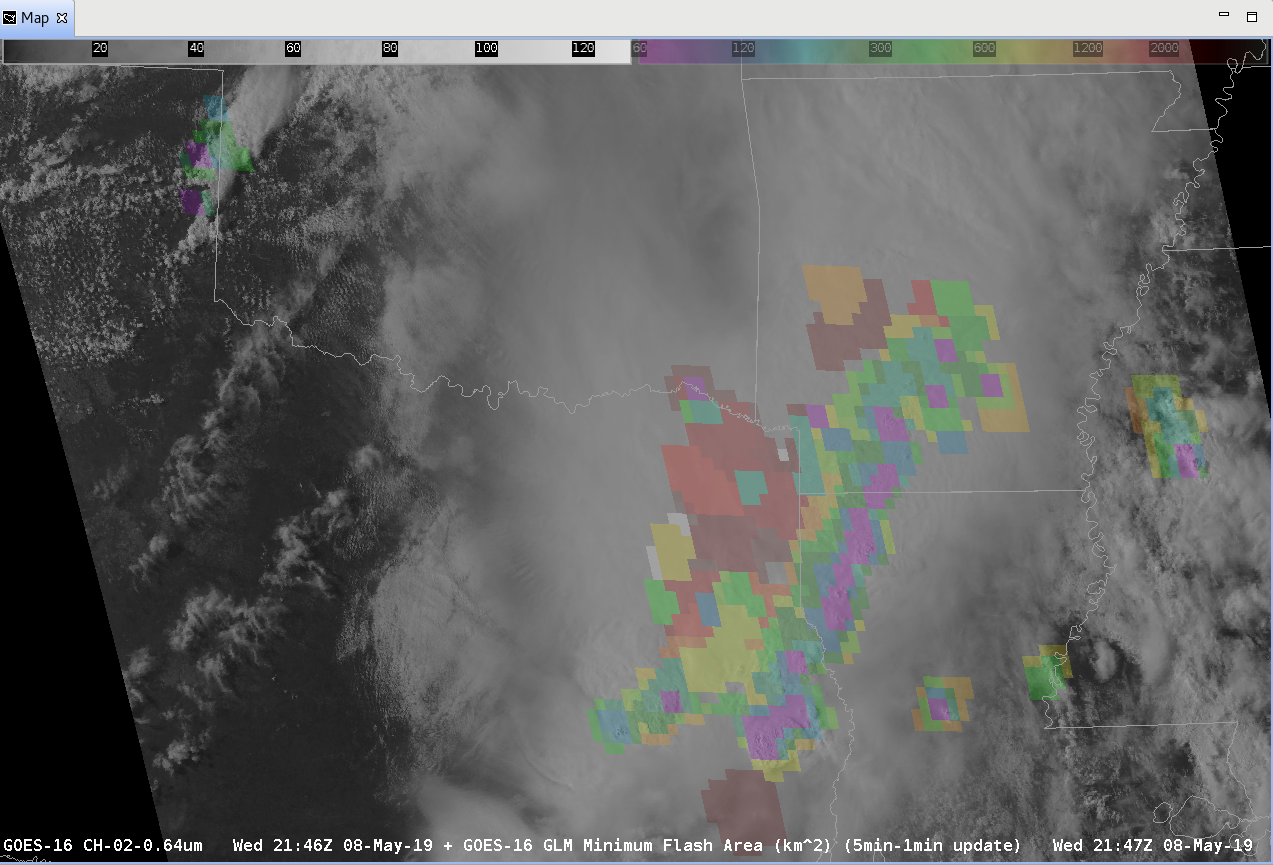
Big flashes taking place in the stratiform region of the departing MCS across the eastern third of Texas.  A LOT of big flashes:

But that doesn’t tell the full story; there are a LOT of big flashes but they are being masked by the scaling of Flash Area.  Right now the scale runs from 64 km2 to 2000 km2.  What happens if we bump that max side up to 4000 km2?

There we go, a bit better discrimination on the big-side of the scale!  It may be hard to see but there is one “white” flash in there; a slightly larger 4600 km2 flash southeast of DFW.

That. is. Yuuuuuuuuuuge.

So, lesson of the day; check the values of flash size (or any flash component).  See if there are values past the end of the current color scale.  Right click on the appropriate product, select Change Colormap , and bump that up some.  May be able to pull out a bit more information than what comes as the default.  Once again however…YMMV.

-Dusty