

Example from KAMA radar showing how the legacy MDA (top left) and DMDA (top right) are falsely indicating mesocyclones with general thunderstorms along the OK/TX border, while the NMDA (bottom left) does not indicate a mesocyclone. Noisy velocity data may be resulting in the false meso indications.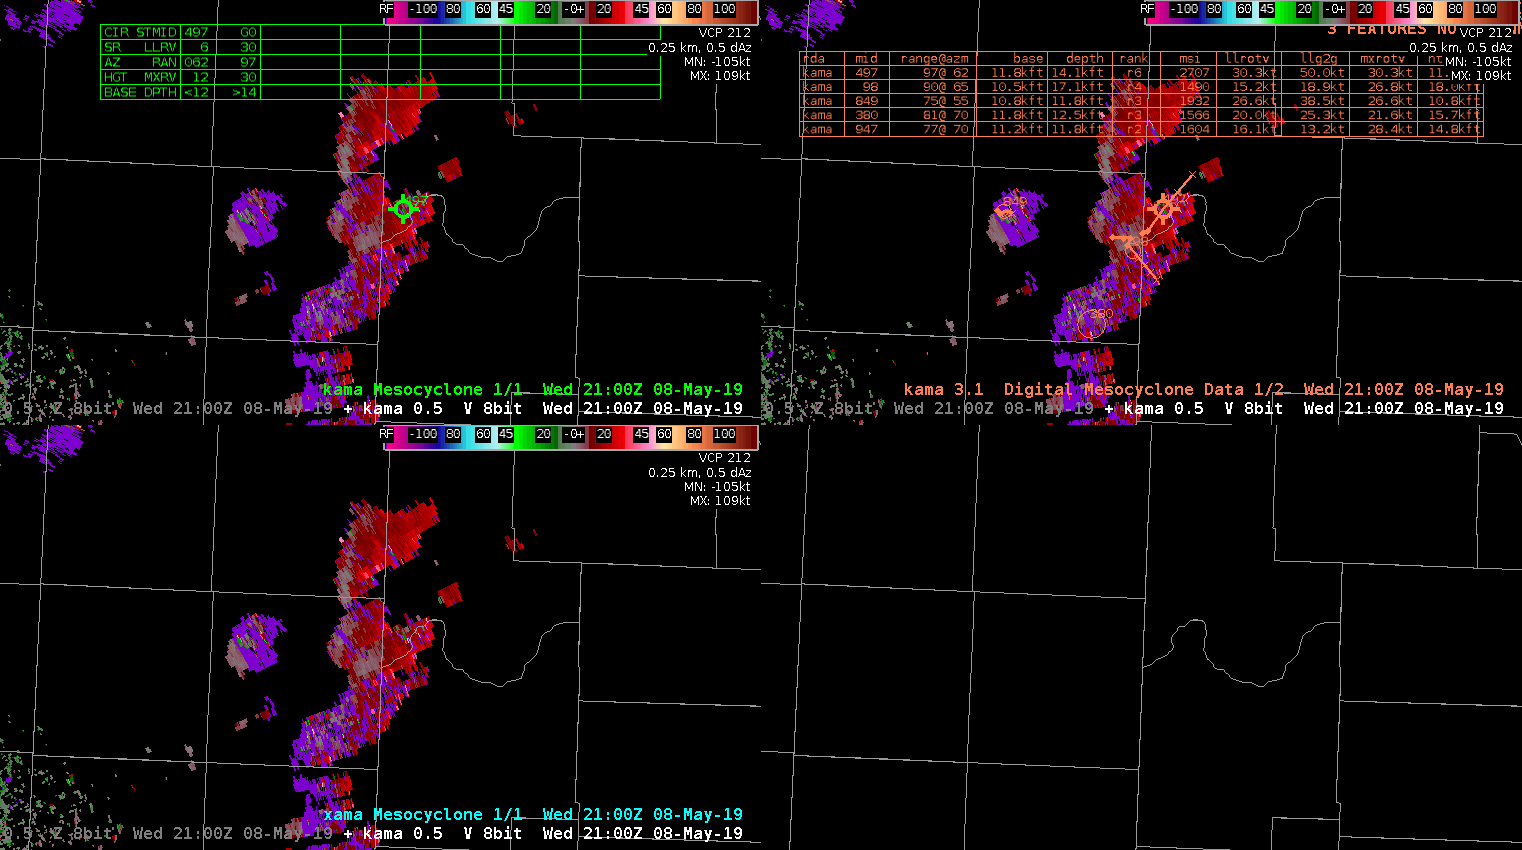
Category: Forecaster Thoughts
Summaries of forecaster’s perspectives after their experience in the testbed.
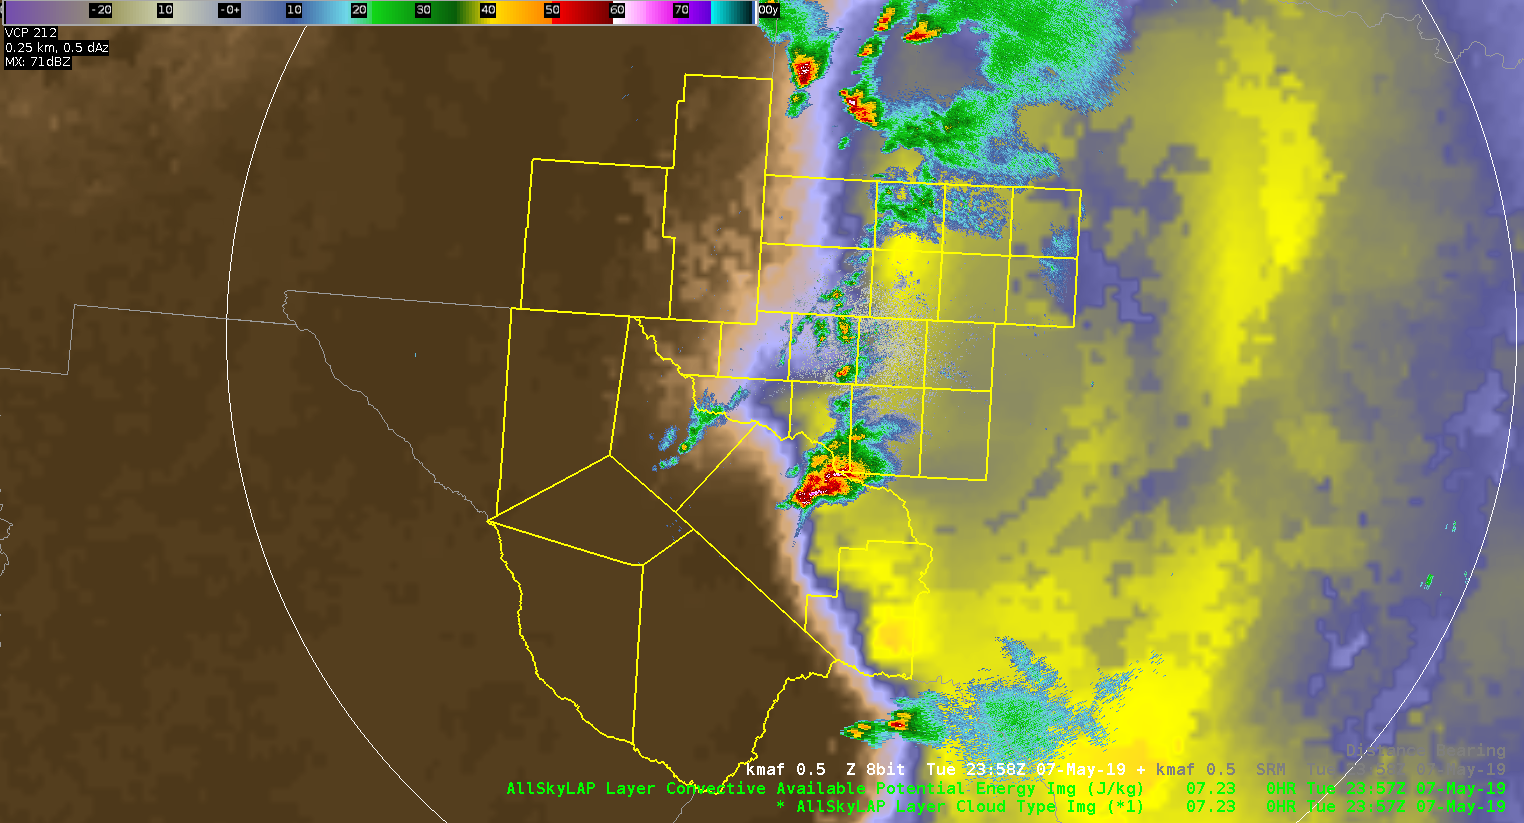
AllSkyLAP Layer CAPE
I have to give a shoutout to how impressively well ALLSkyLAP Layer CAPE identifies the dry line. I really like to overlay radar data with this.
ZDR_Arcophile
Lightning Jumps in Action
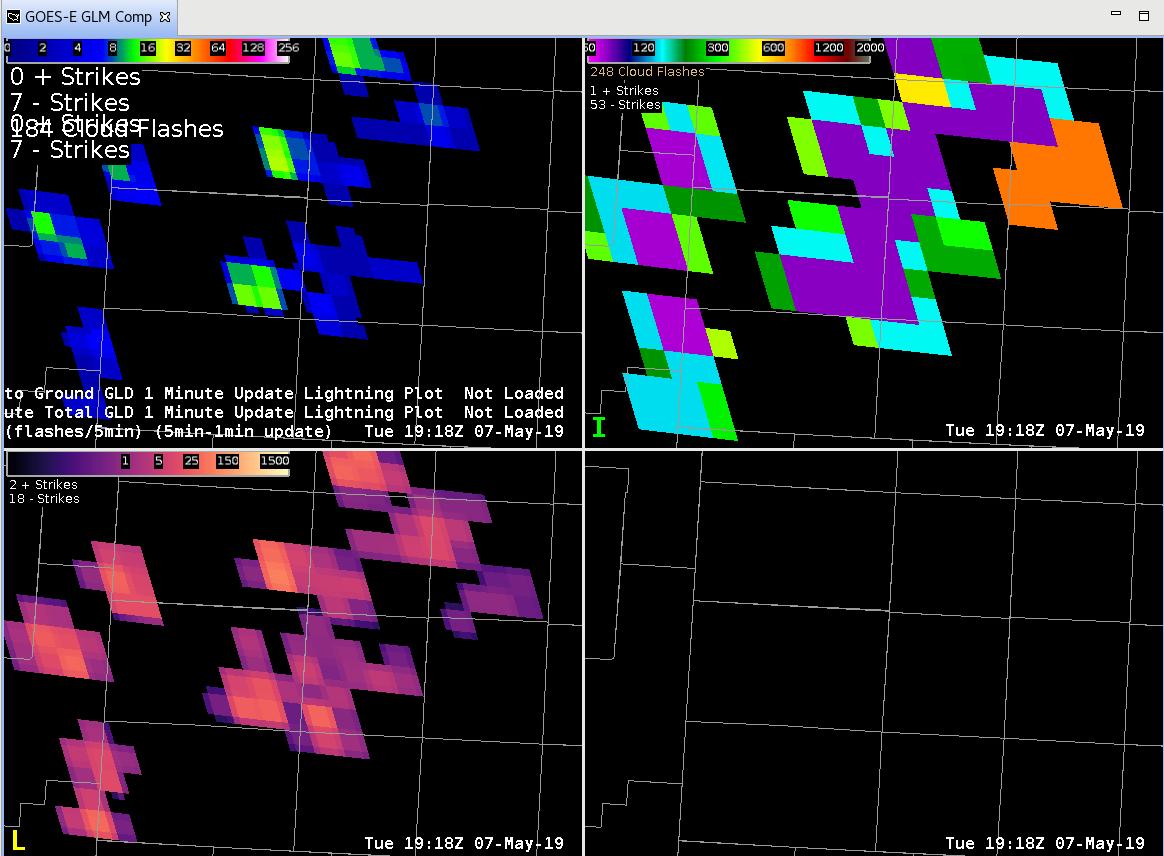
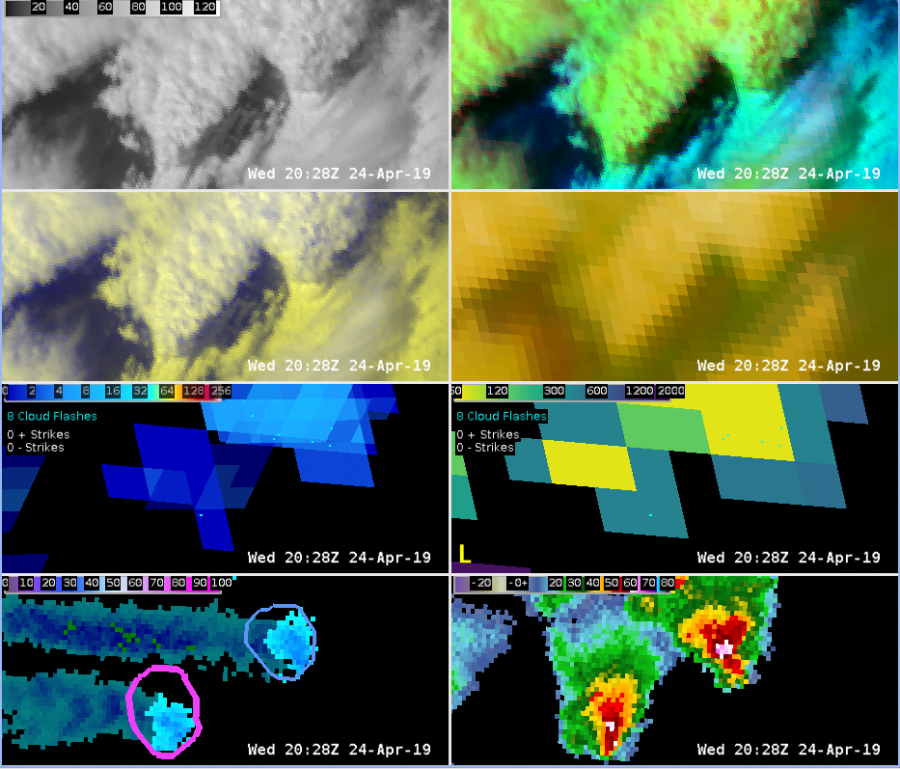
The storm near Tulia is…impressive. Aside from being a long-tracked supercell, the storm has been extremely active electrically. There have been several lightning jumps with this storm that appears to coincide with an increase in the strength of the mid-level mesocyclone. First we will take a look at an hour long loop (TL – Flash Extent Density overlay with Vaisala GLD, TR – Minimum Flash Area, BL – Optical Energy, BR – Mid-level Azimuthal Shear (3-6 km AGL) with New Mesocyclone Detection Algorithm Overlay) :
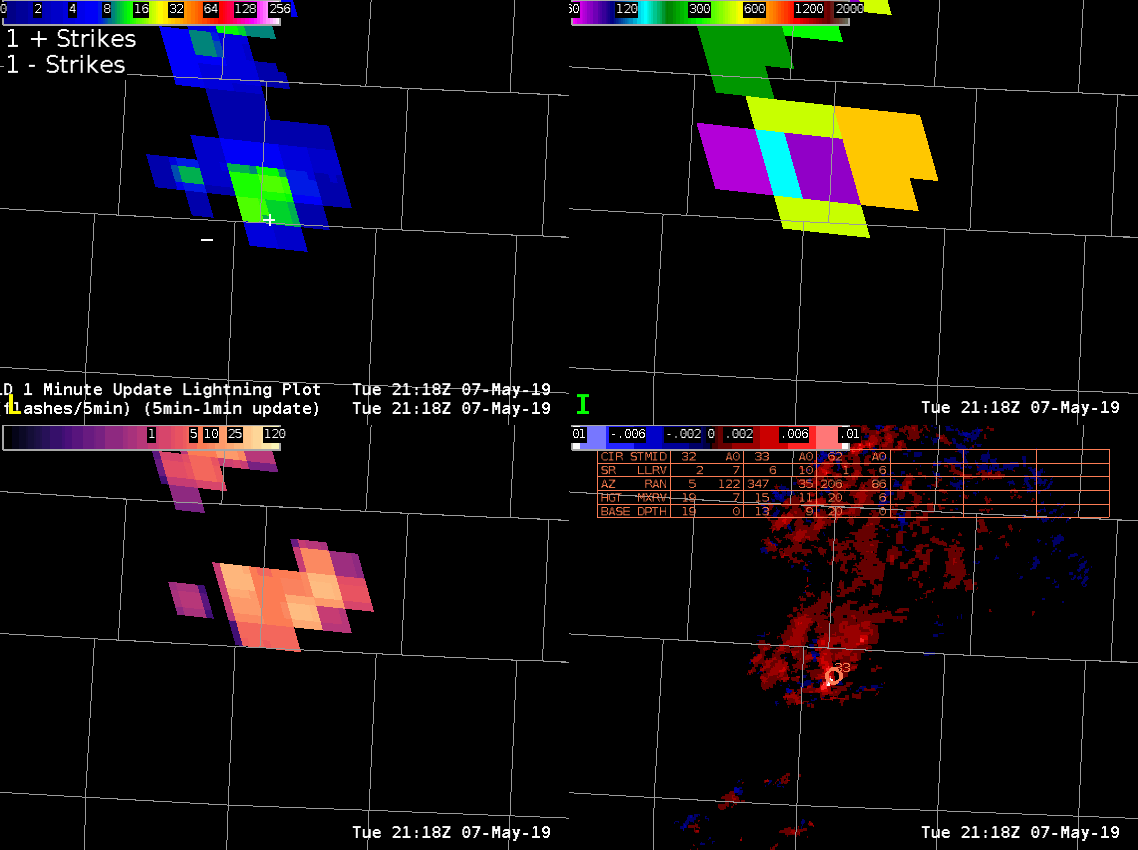
There are two jumps to take a look at, 1) between 21:29 and 21:40, 2) 21:55 – 21:20. Although the AzShear product doesn’t show a strong mid-level meso developing, the number of positive CG flashes in the GLD data increases and we see continued small area flashes in the core. The more impressive jump is the second one; AzShear shows a much more pronounced area of positive shear, a long-lived NMDA indication (the circle with 4 pips on it), and overall smaller flashes in the area of that storm.
Shortly after the last jump (and not shown here), live stormchaser feeds showed a rapid strengthening of low-level features; well defined wall cloud, organized rotation, and frequent CG activity sending a flurry of stormchasers heading east to get out from under the storm…
-Dusty
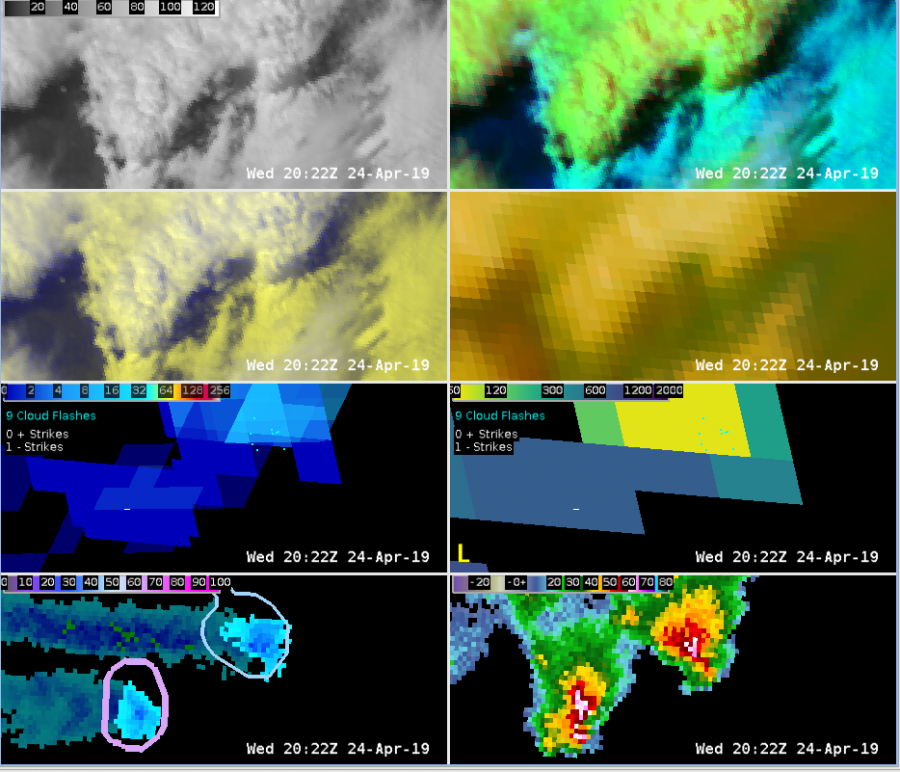
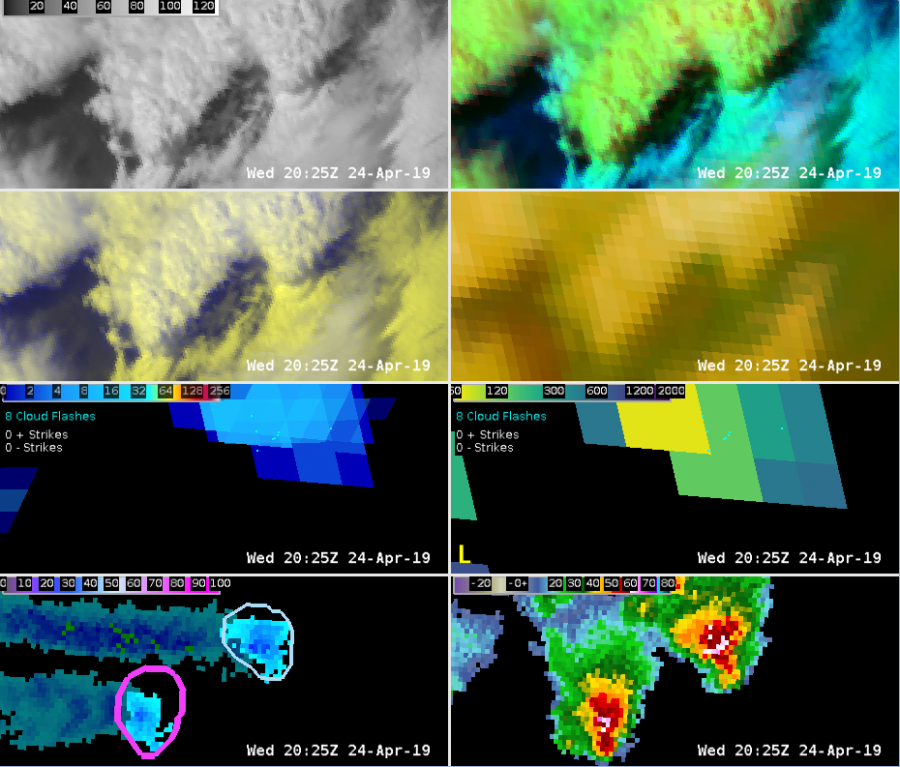
5-Minute with 1-Minute vs. 1-Minute GLM Min Flash Area
So, the first thing looking at today is the best way to display Minimum Flash Area. This is a nice addition to the Flash Area products and seems to have some utility in displaying the state of convective growth. As a reminder, smaller flashes are usually indicative of new or strengthening convection while larger flashes are mature/decaying/sustaining stages of convection. This will come in handy with a lot of convection to see which cores may be the strongest in any given area.
The problem is the best way to view this information; the 5-minute with 1-minute updates seems to have worked well in the past for most of the GLM data but seems to cause some problems with the Minimum Flash Area. Case in point, here is a 4-panel with the 5-minute/1-minute update from the Texas Panhandle north of Amarillo (TL – Flash Extent Density, TR – Minimum Flash Area, BL – Total Optical Energy, BR – empty; note, non-default color tables on the top row!):
Wow! That’s a pretty large area of small flashes (purple). BUT, it’s a total from the last 5-minutes so storms could have moved, strengthened, weakened, dissipated, etc. in that time. What does the “regular” 1-minute plot look like?
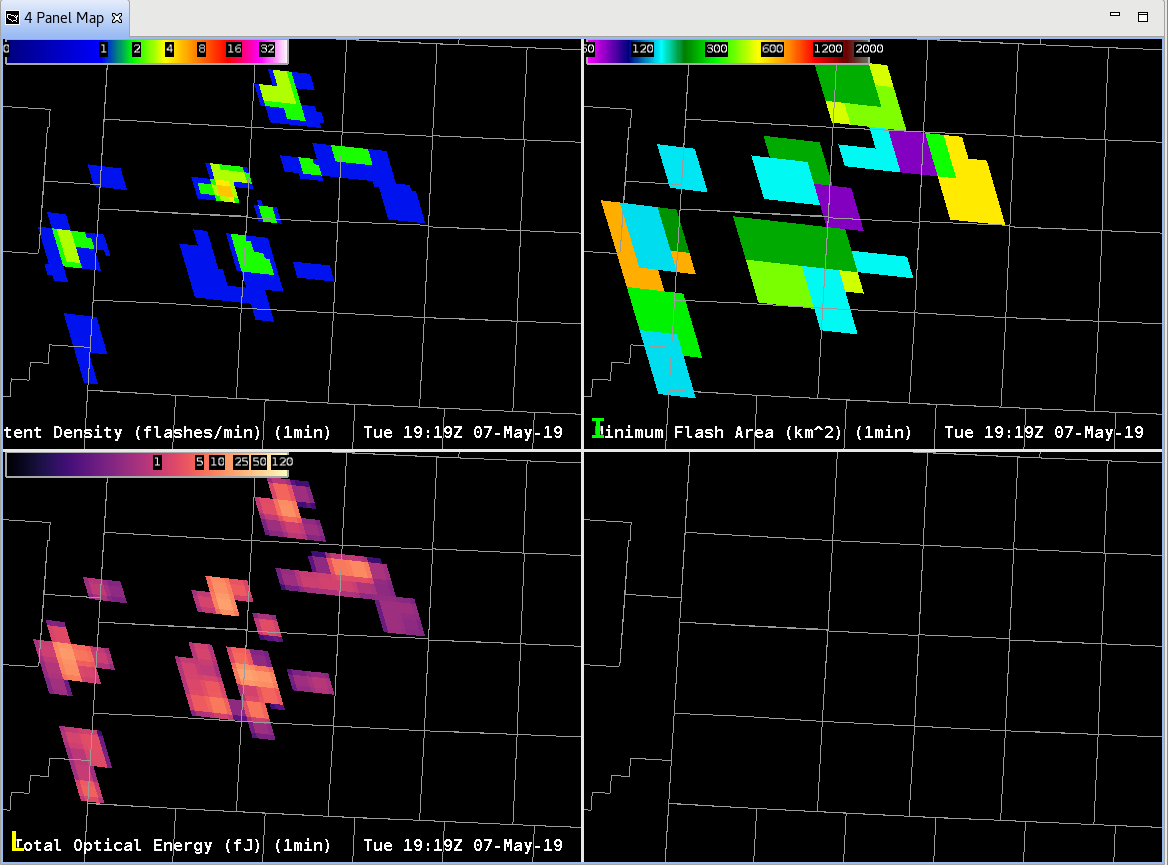
Huh? Where did all the small flashes go? Well, the small flashes (purple) in this case are likely where the GLM is seeing the strongest updates in the last minute, not the last 5 minutes.
Something to consider when looking at rapidly developing convection, storms that are moving fast, or storms that are pulsing with rapid time intervals; the 5-min with 1-min update can mask important details when it comes to storm electrification!
-Dusty
Good non-severe storm with agreement from radar/satellite products
One storm became near severe around 545 pm in EWX CWA. All parameters; lightning, ProbSevere and Dual-pol radar agreed on the evolution of the storm and expected impacts. Radar data suggested there to be equal wind and hail threat based on high ZDR and KDP within the core suggesting sub-severe hail. There was some notching in the back side of the storm’s reflectivity as the front end of the storm surged eastward suggesting some wind threat. Lightning over this time had increase from 10 fl/min to 20 fl/min about 15-20 minutes prior to the development of some weak mid level rotation. As the storm cycled and weakened, so did the lightning and ProbSevere values. An uptick in GLM event density was followed by a slight increase in ProbSevere values toward the end of the loop.
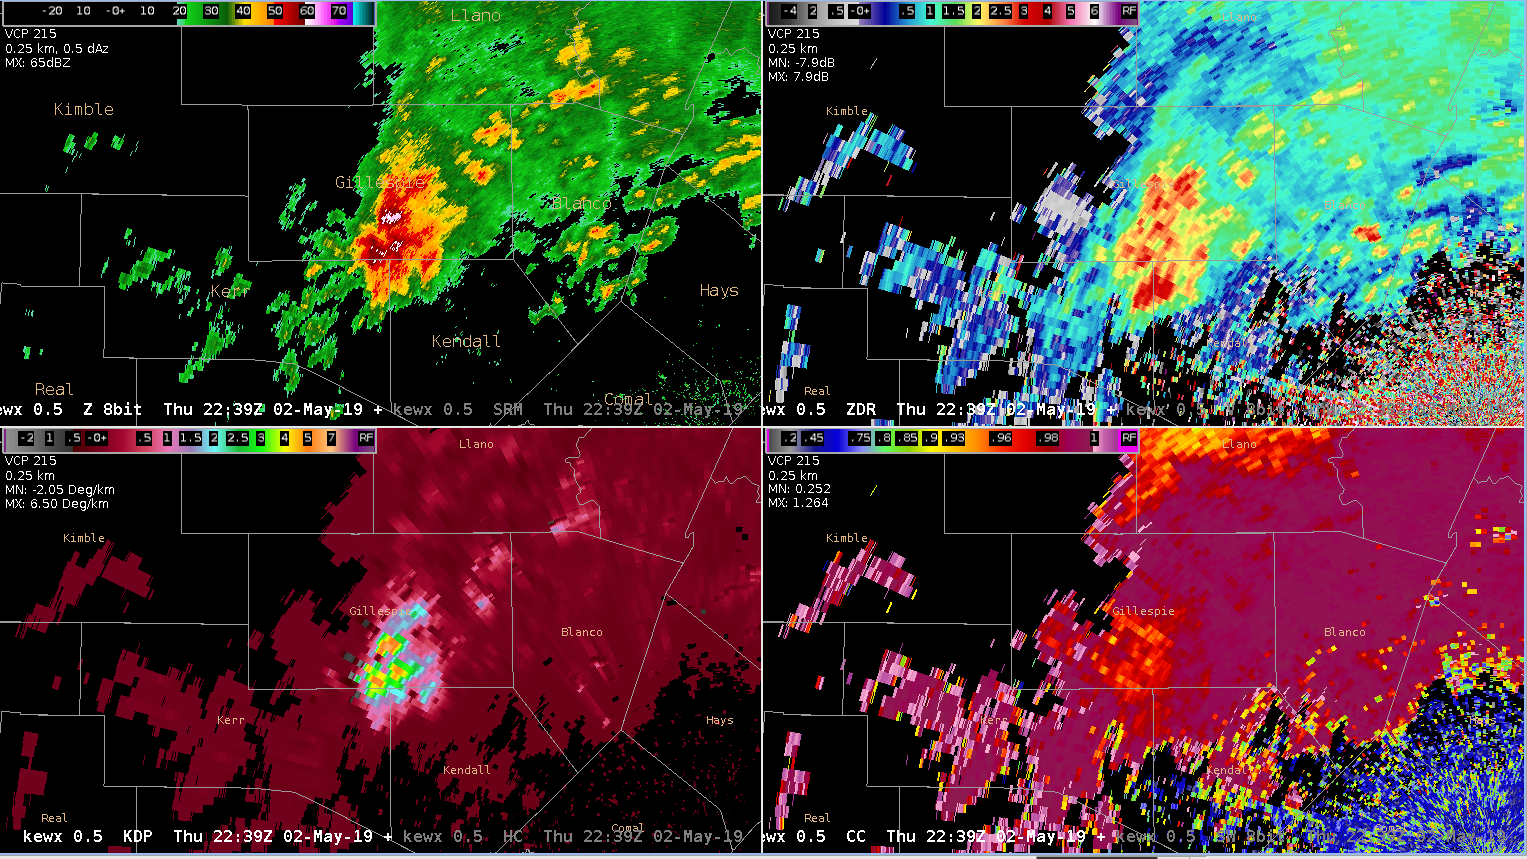
KEWX 4-panel – Refl (UL), ZDR (UR), KDP (LL), CC (LR)
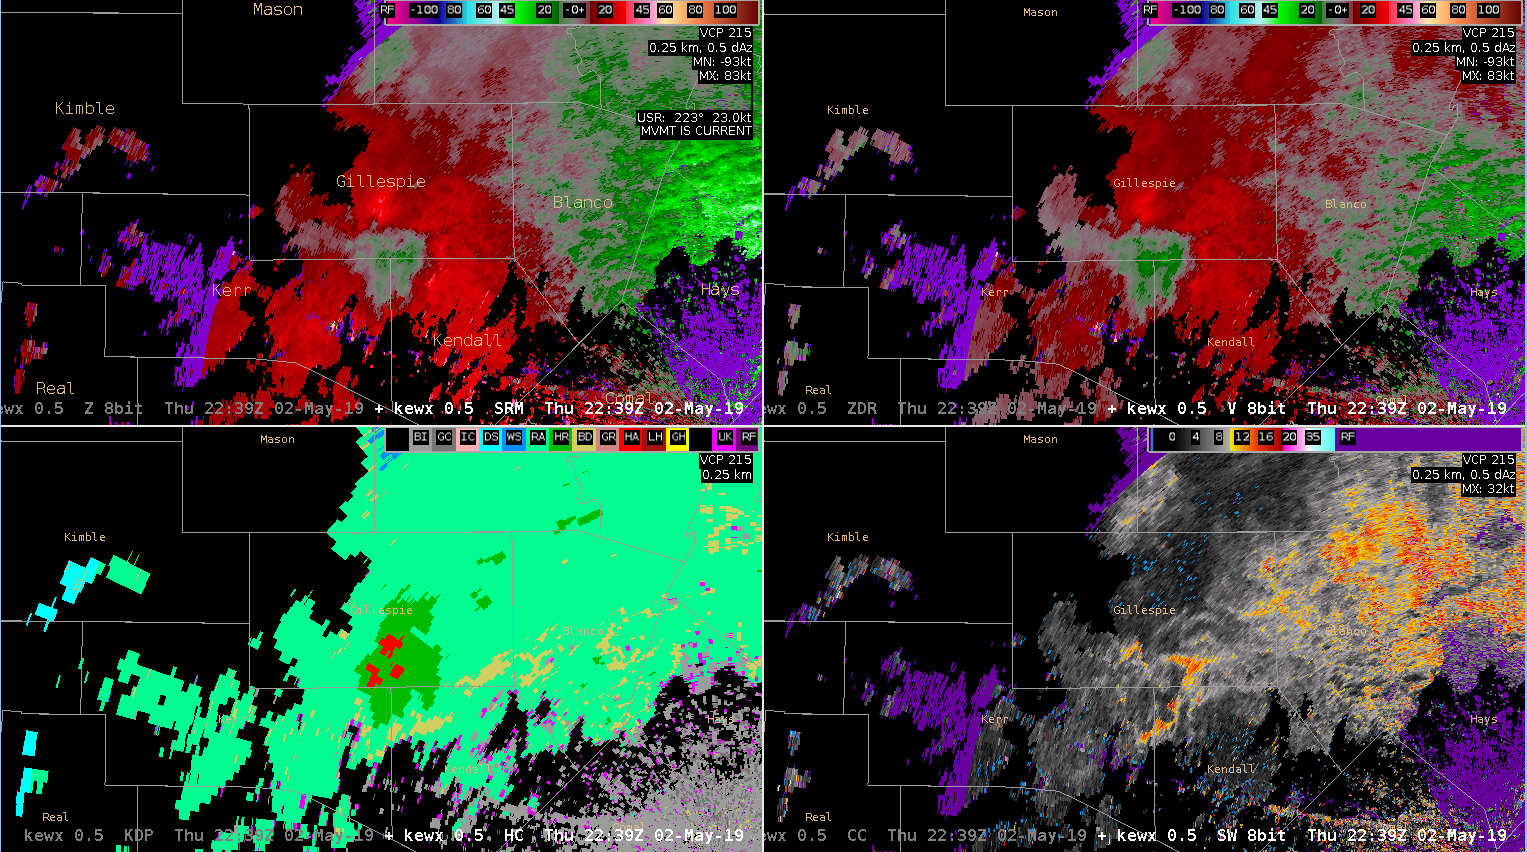
KEWX 4-panel – SRM (UL), V (UR), HC (LL), SW (LR)
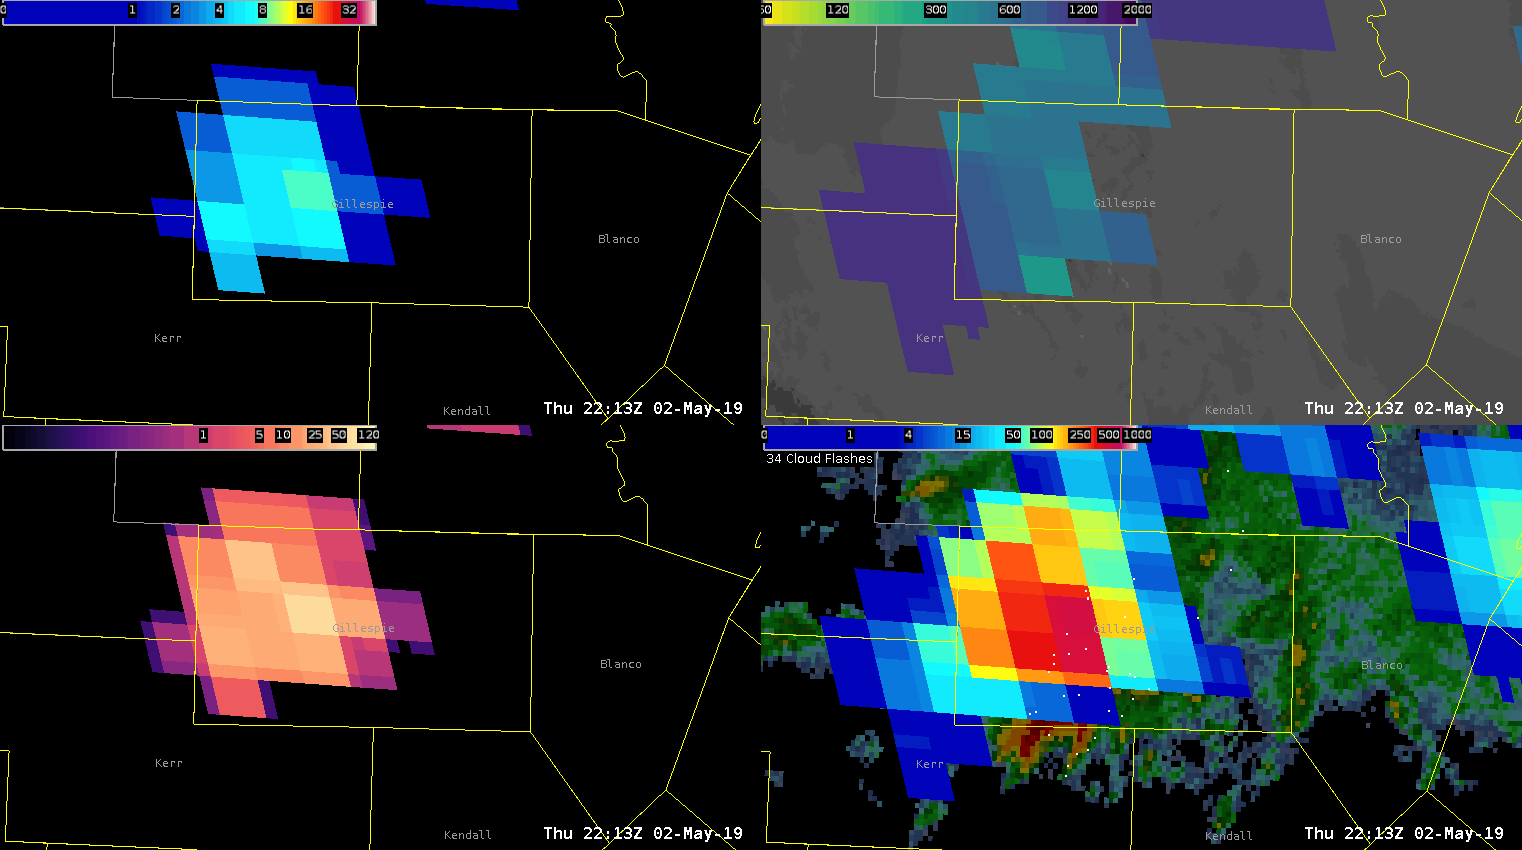
GLM sequence of Gillespie County storm – 1-min(FED)(UL),AFA(UR),TOE(LL),EventDensity(LR)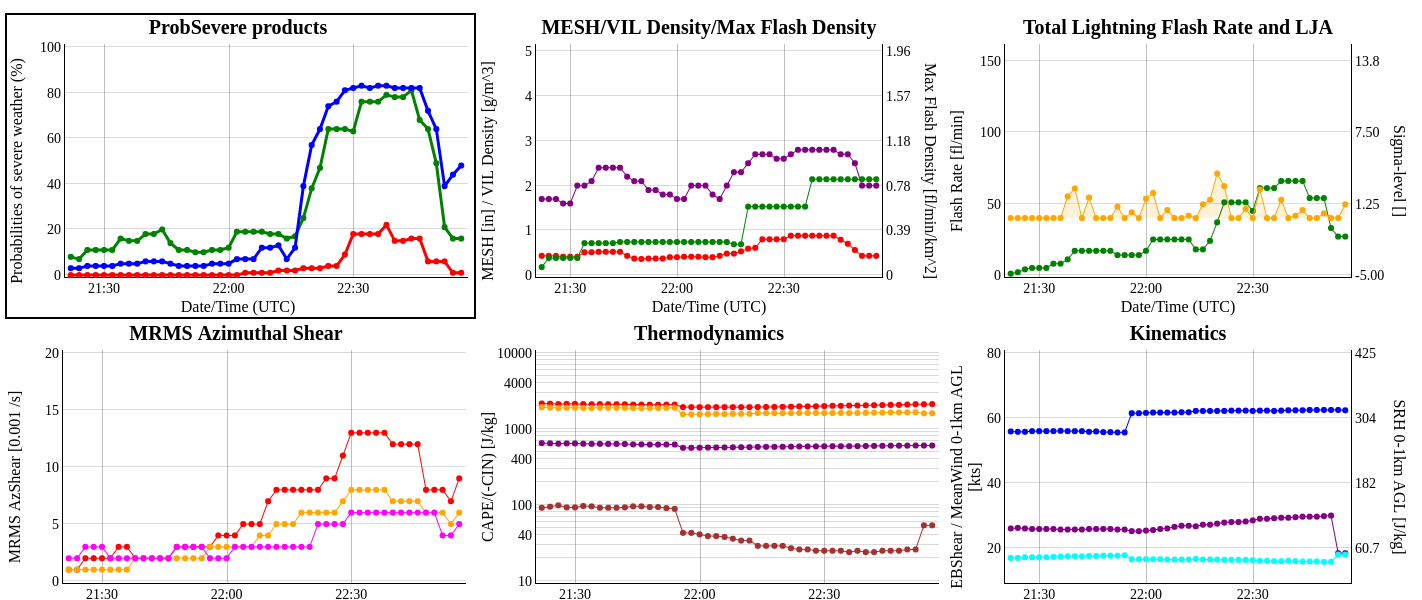
ProbSevere time trends from http://cimss.ssec.wisc.edu/severe_conv/plots/PSplots.php?ID=176047
— SCoulomb
The Aggie Tornado From a Shower
PRIOR to the Milam/Burleson County tornado warnings that you can read about below in other blog posts there was a tornado near the Texas A&M Campus in College Station. See these tweets:
- https://twitter.com/cgar1999/status/1121171711855034370
- https://twitter.com/jeanette_wx/status/1121171983633350661
- https://twitter.com/KAGSnews/status/1121205013236391938
If you looked at the image below you would not really be concentrating on the storm (I use the term ‘storm’ loosely) near College Station on the right side of each panel. Based on velocity, AzShear, Reflectivity your focus would be the bowing line segment to the west that would soon produce gate-to-gate velocity signatures south of Hearne.
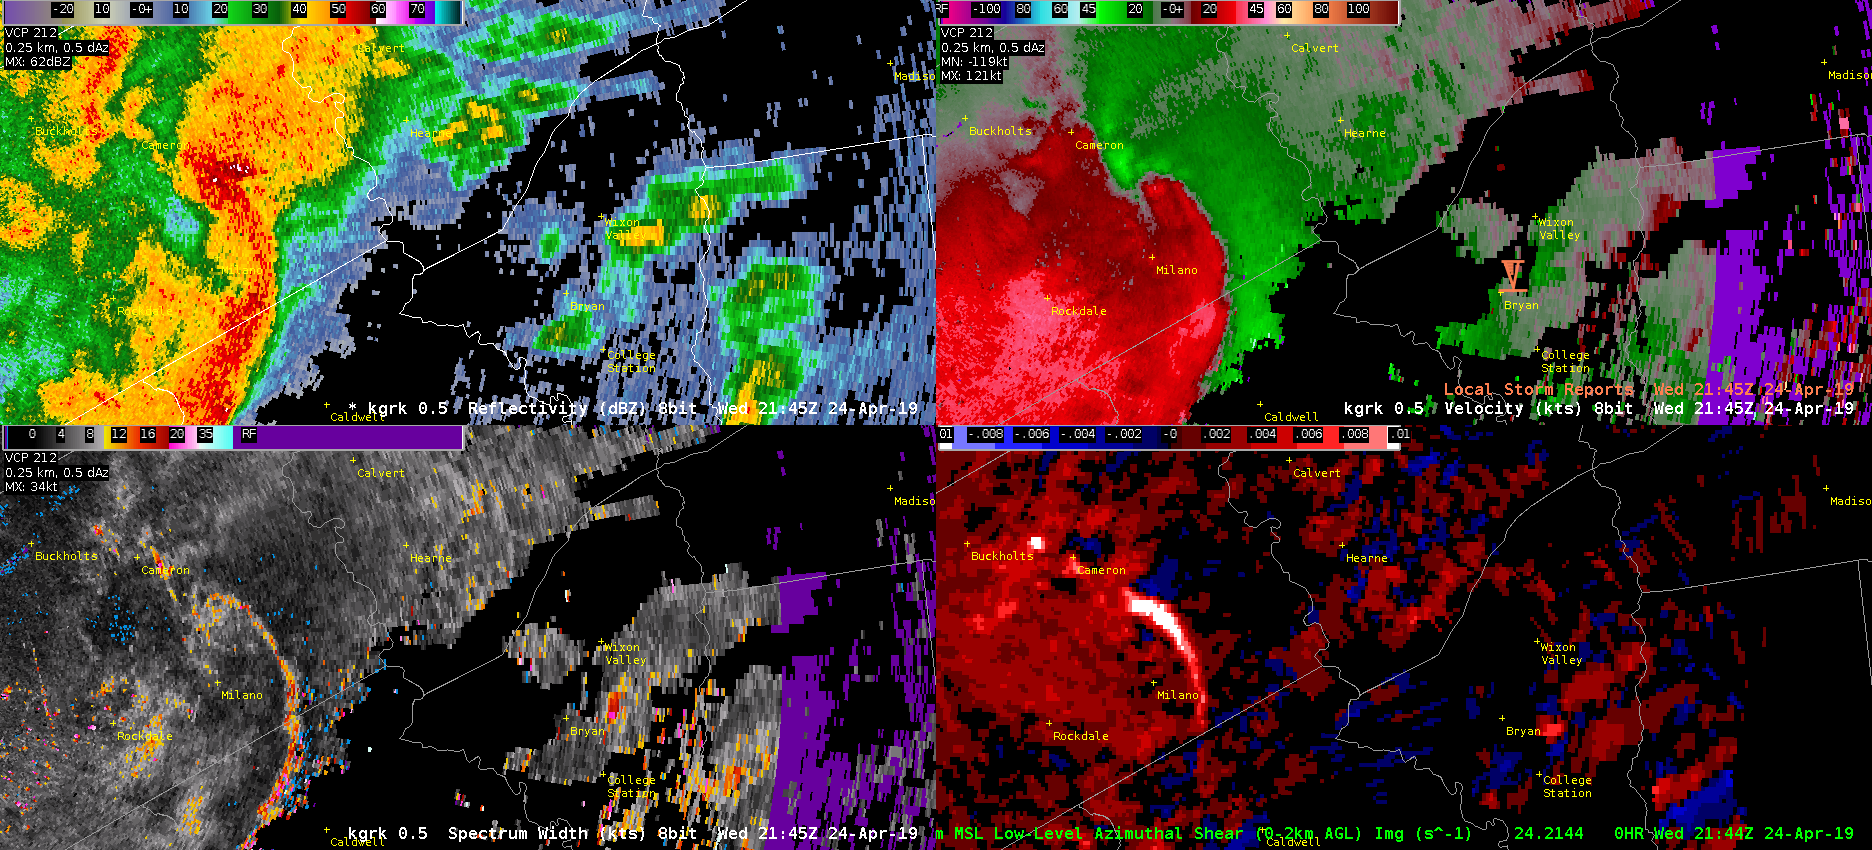
If you were to zoom into Bryan-College Station though a few things begin to jump out at you. Mainly the high Spectrum Width, the relative maxima in AzShear, and a VERY weak couplet looking signature in velocity (look near the blue Tornado Icon). This is the time that the tornado was reported. The good news is that Spectrum Width picked up on the turbulence in the storm, and AzShear does have a local max, but the values are only 0.007 s^-1 compared to 0.014 s^-1 at the bookend vortex to the west. This scale only goes from 0 to .01 s^-1.
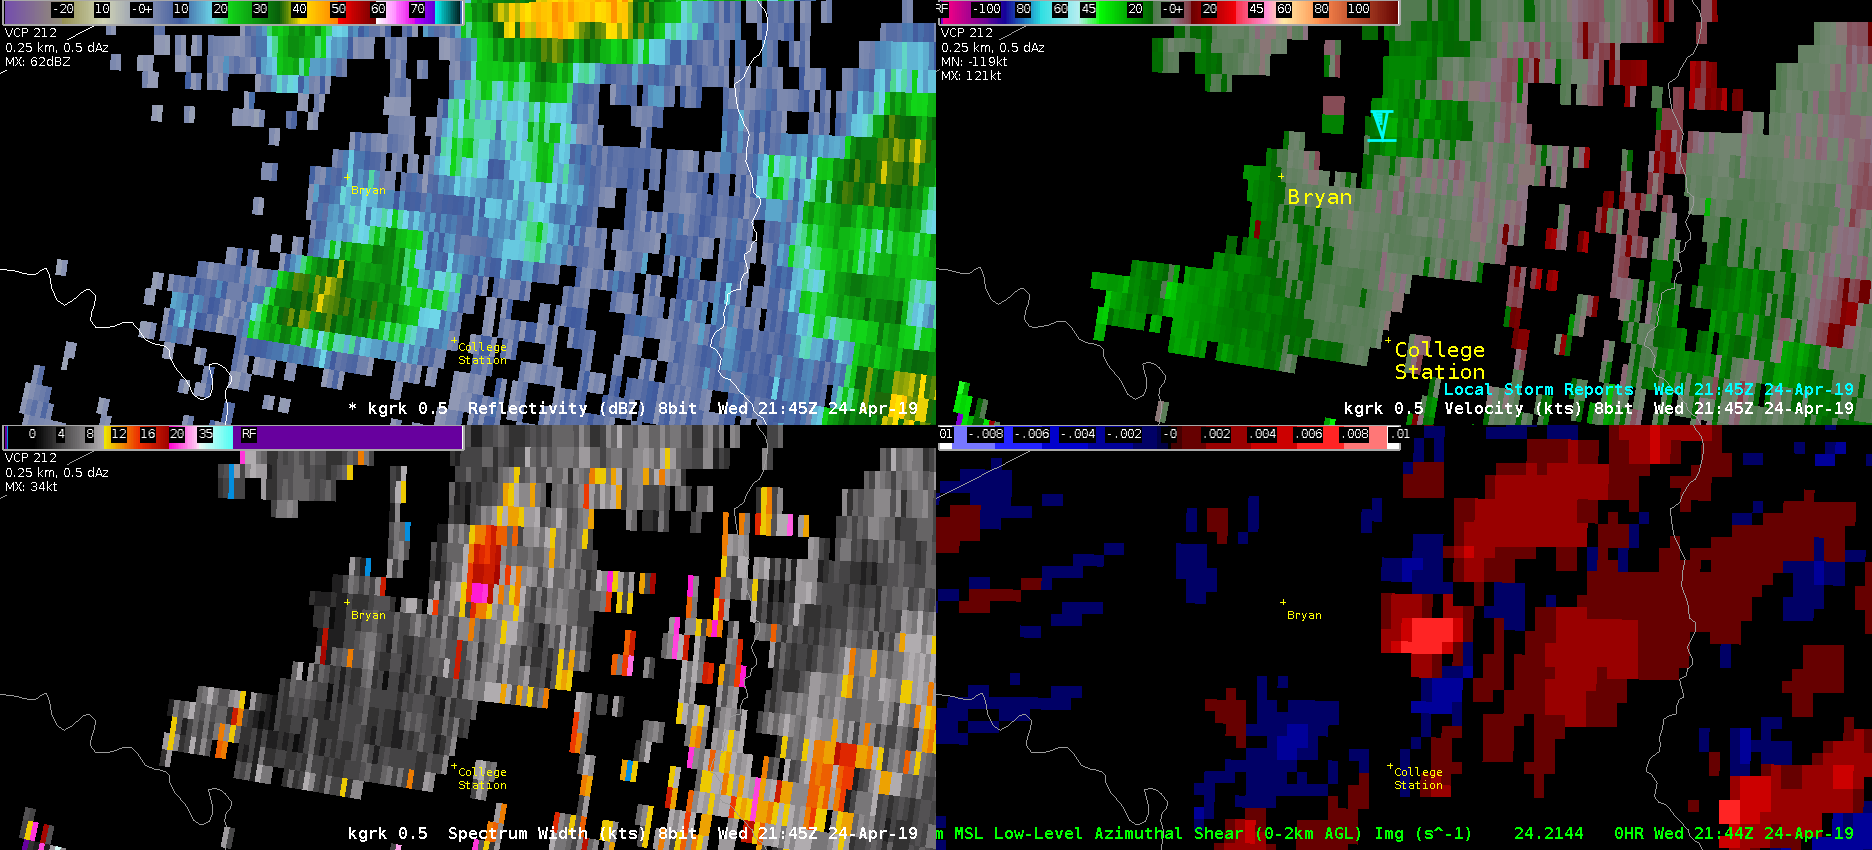
The velocity signature does get slightly better in the 2149z. This is probably a quick spin up due to boundary interaction, but it is shocking that this little SHOWER produce the tornado when the larger storms to the west produced NO reports as of now (0026z). The good news is that there were local maxes in the AzShear and SW, but not enough that these would be your focus of course.
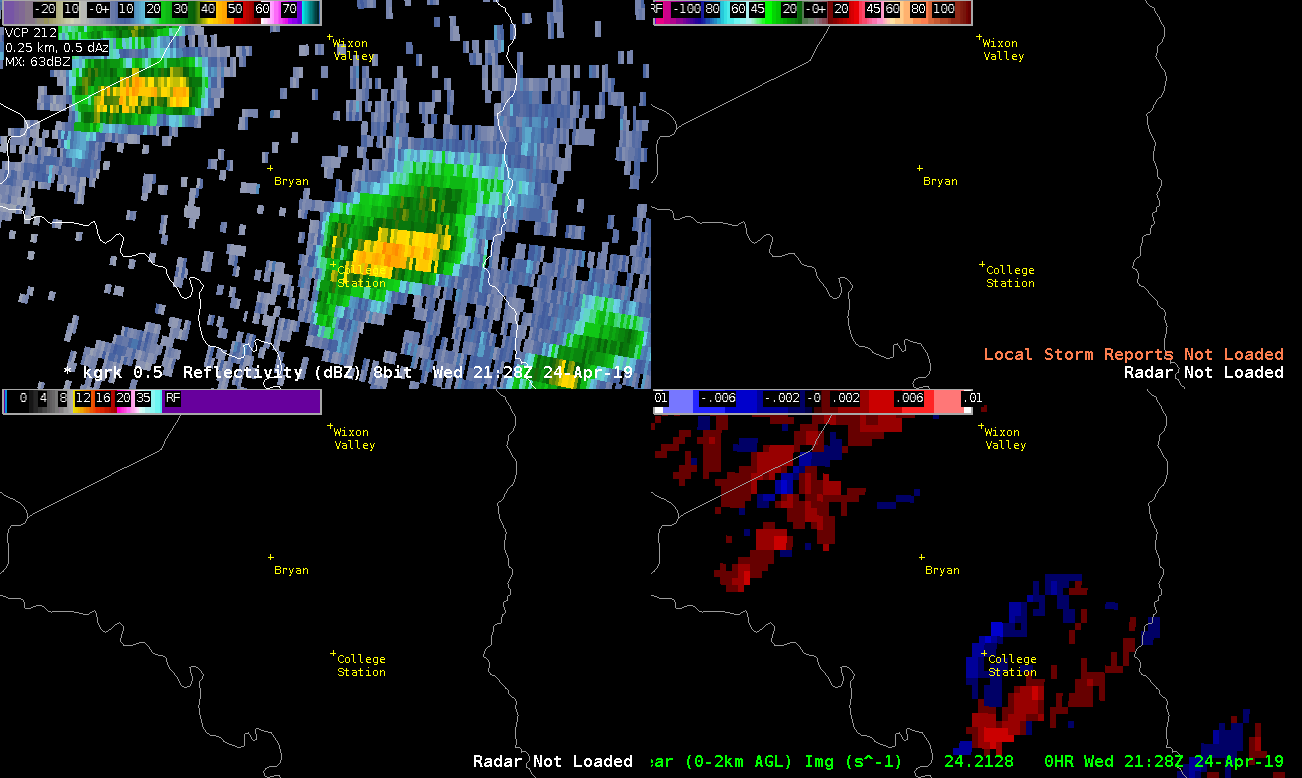
ProbSevere never pinged the storm…and there were other indications in velocity, AzShear, and SW with other showers that were similar to the tornadic College Station storm. Oh the joys of quick spin up tornadoes due to boundary interactions in Central Texas!
-Alexander T.
GLM Assist In DSS
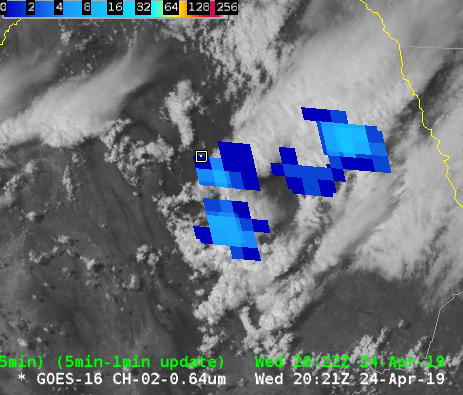
The below image shows GOES-16 day cloud convection (DCC) beneath GLM Minimum Flash Area (MFA). Point F is a DSS event. DCC shows clouds glaciating a county upstream of our DSS event, with the storm becoming electrified shortly after glaciation per MFA. This prompted a call to the emergency manager providing support for the DSS event letting them know that lightning was imminent.
ENI total lightning also shows lightning (white points), but the point data fails to show the extent of the lightning, which may lead decision makers to think that they have more time to react to the approaching lightning than they actually do.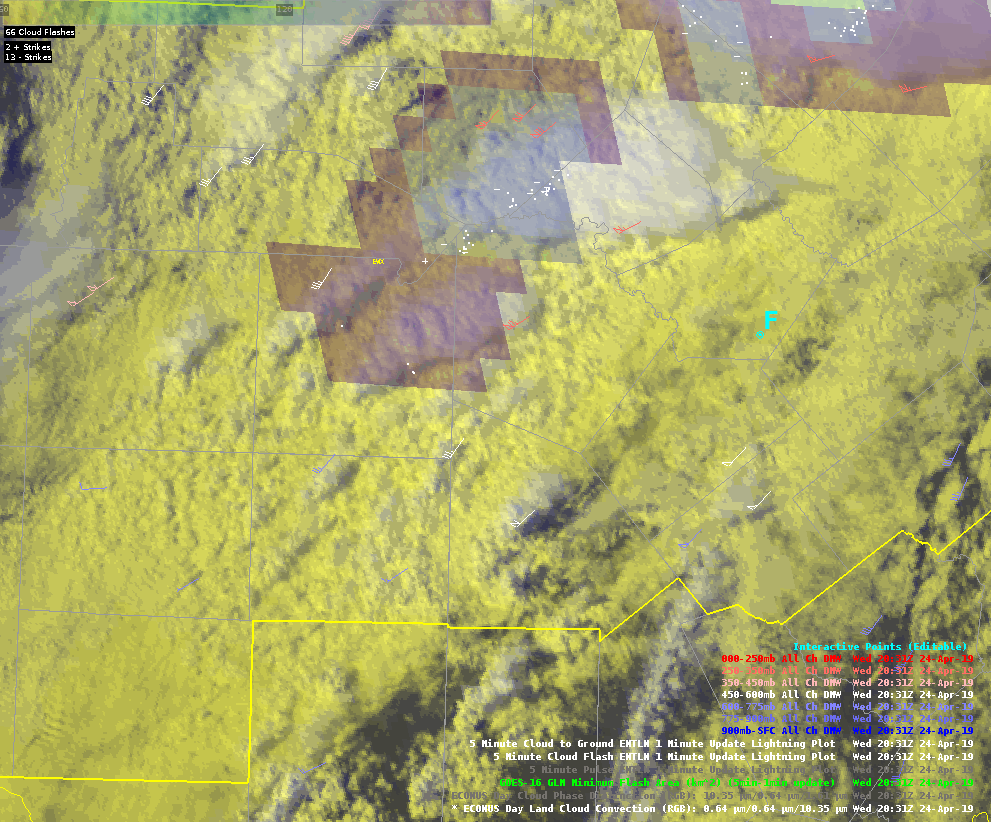 Sandor Clegane
GLM MFA for Storm re-generation
GLM Minimum Flash Area showed some utility in boosting lead time for storm re-generation. The storm in the center of the first image had started to weaken a bit after moving off of the outflow boundary that initiated it.
The storm continues to show no new updraft development in the sat imagery as well as MFA product.
At 20:29 GLM MFA begins to indicate that there may be a new updraft forming as it interacts with a differential heating boundary/outflow from the leading storm.
Over the next 20 minutes the updraft continues to strengthen as the storm becomes more robust. The MFA led the visible satellite depiction of the new updraft by 2-4 min. This could be useful when trying to decide whether to continue warnings or not.

Waiting on convection – diagnosis and investigation of products
Corpus Christi —
In investigating the environment we’ve deemed the convection to be more or less dependent on synoptic forcing via the cold front dropping southeast.
A
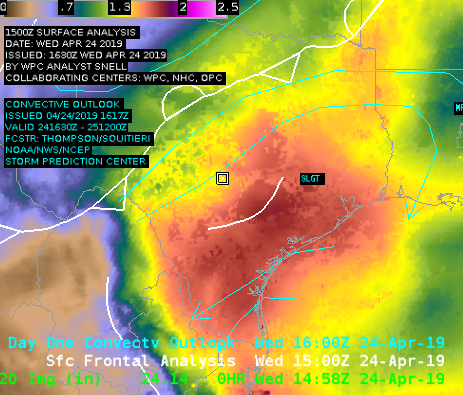
In A, plotted is Total Precipitable Water along with SPC Convective Outlook and analyzed fronts. A couple of things can be noted: TPW is very high under the Slight Risk, and it is displayed very nicely with good resolution contained within the gradient. This is a good example without going into too much detail about how our environment is primed for severe weather. However, NUCAPS Gridded Data has not come into our area as of 20z. This makes it hard to test the product and how it captures the boundary layer.
Now, we wait.
B
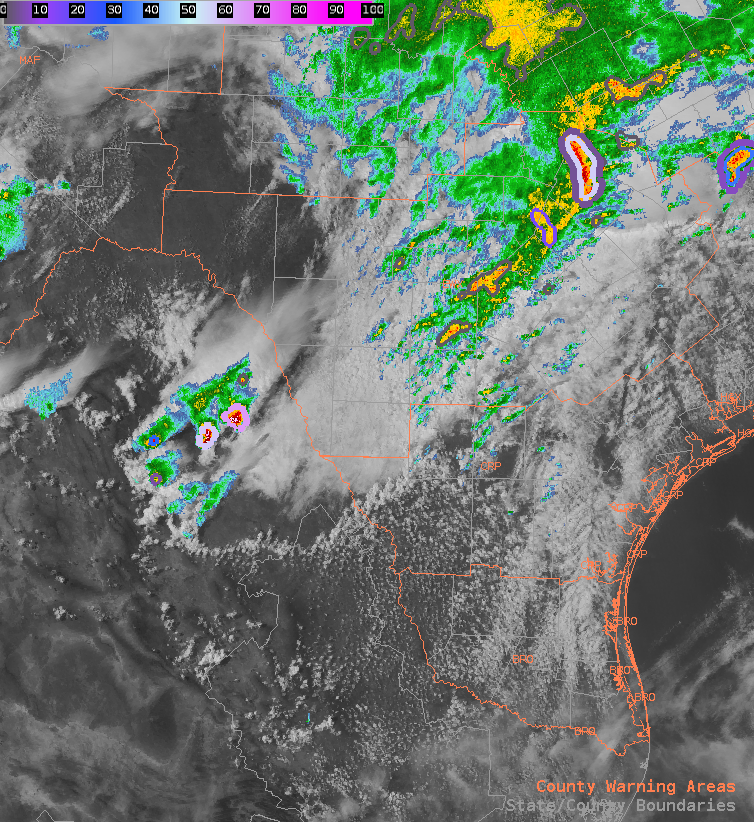
As we wait for the cold front to drop SE, our attention is focused on convection happening in NE Mexico (pictured in B). These cells popped up right along the CAPE boundary between values of 300 j/kg to 1500 j/kg.
C
As can be seen in C, the GLM has indicated these storms contain lightning, thus they are intensifying in nature. We will now be monitoring the hail threat.
-lakeeffect
All-Sky Gradients & New Storm Development
Today was a great example for how the improved resolution from All-Sky LAP allowed us to hone in on exactly where new storm development will occur. Convection across Mexico developed where the front sagged south along the moisture/CAPE gradient. While in this case the CIRA Merged TPW showed the same gradient, the resolution was still better with All-Sky. Baseline blended TPW as well as satellite derived TPW/CAPE were useless due to either being overly smoothed, or not displaying in cloudy areas. Great diagnostic tool.
— FLGatorDon