NUCAPS – PopUp SkewT – Needs Improvement

One way to increase NUCAPS sounding data usage is to improve the ability to display “mouse over” soundings using the PoP-Up SkewT.  See the example below – I was able to mouse over the various points and display the NUCAPS soundings.

However, the PoP Up SkewT display is small, crude, and cannot be enlarged.  If a version of NSharp could be integrated into the PoP Up SkewT (e.g. larger SkewT with thermodynamic variables below) – then forecasters might use it more often.  The current PoP Up SkewT is probably 10 yrs old – and needs improvement.

NUCAPS Modified vs. Non-Modified

With an afternoon pass of NOAA 20 there are now NUCAPS soundings over our active area of MAF and SJT. Looking at the non-modified and modified soundings there are several different things to note. On the image below the raw NUCAPS sounding is on the left and the Modified is on the Right. From this view it may be hard to see the differences, but a few are listed below.

  1. Based on the location of the sounding and the surface observations (the location is the green dot just south of the red dot in the image below) the modified sounding DOES DO A GOOD JOB at the surface. The Modified Sounding has T=71 and Td=60. The non-modified sounding shows T=67 and Td=55. Looking at the surface observations below the modified sounding is more reasonable with Td around 60 and temps in the upper 60s and lower 70s.
  2. Just above the surface though there is some questionable signatures. First it appears the modified sounding assumes that there was a cloud deck around 1km (T and Td almost the same). This is questionable as the visible satellite below does show more clear skies around the point. As that point is right along the front there has been mostly clear skies near that point. How it handles these parts of the mixed layer are more questionable.
  3. These differences to make a BIG difference in the severe weather environment. Most notably CAPE. If you look at the surface CAPE it goes from 1492 in the non-modified to 2799 in the modified. That is significant, especially when these supercells are producing hail. There has been a 2.5 inch hail report to the east of this dot location, which does lend itself to pointing towards larger hail.

-Alexander T.

ProbSevere and Best Practices

I think ProbSevere has usefulness even after the storms initiate and even after they become severe.  SCAN allows us to see the environmental read out around a cell, however the probsevere’s displays allows me to easily see the important information about the environment.  i like this better than the scan display.

Screenshot-CAVE:ABR - D2D

MacGyver

Tags: None

Thoughts on 1min SSRO Data and Severe Weather Forecasting and Ops

Having the 1 min satellite data was vital to my knowledge of the environment and subsequent warnings. Here’s how.

I was able to identify boundaries important to convection and initiation across northwest NE.  There were limited obs there, but it was clear from the satellite imagery.  With the one minute satellite data I was able to find the 6 min satellite derived wind data.  This data was a check to the models.  The RAP had 0-6km shear AOA 30 kts, this suggested that multicell would be the dominate storm mode.   The satellite obs suggested that there was actually a H3 jetlet moving into the area.  The winds associated with this max increased the 0-6km shear to around 45 knots with near 0 surface winds across western NE.

I developed a thought that the storms would initiate across eastern WY and then move into western NE and intensify.    I thought that the jetlet would cause the storms to become stronger and more supercell in nature until it moved out of the area.  This in fact happened.  This lead to a small window ~2 hours of supercells with large hail.  Knowing that the boundary to the north was stationary and cu was starting to initiate along there, suggested that we would could see a short tornado threat as well.  Storms that formed or road the boundary showed rotation.  With lightning jumps and the one min overshooting tops data, I decided to issue a tor.  My thought was that with a long lived overshooting top and a collapsing reflectvity core, that the updraft intensified, leading to more stretching of  vort in the storm and possibly the RFD coming down.  Knowing that 12kft was my lowest tilt, I decided the environment and radar signature may be enough to warn,  No idea if it verified, however without the one minute data looped, I would not have been able to see fine details that suggested what was actually going on

Tags: None

NUCAPS vs. RAP

Finally got the NUCAPS data.  Was waiting for this data to compare with local sounding from BOI.  Had to mix the low levels to actual values.  After this, it was clear why convection was not going on to our northern CWA….there is some warm air across the northern CWA.  This sounding isnt as dry in the low levels, suggesting that there is not as high of a chance for wind.

Screenshot-CAVE:PDT - D2D -1

Williams & MacGyver

Tags: None

KPDT ProbSvr followup

2043svr

ProvSvr maxed out at 88%, MESH at about 1.5″ 2029z-2039z.

Wondering if best practice is to lengthen duration of warning in cases when using ProbSvr, since there is some extra lead time compared to when one might issue a warning without it. In our case, we issued at a 30 minute warning (fairly typical) when a 45 minute warning may have been more appropriate given how much sooner ProbSvr can flag a severe potential.

Williams & MacGyver

Tags: None

Takeaways from ICT Today

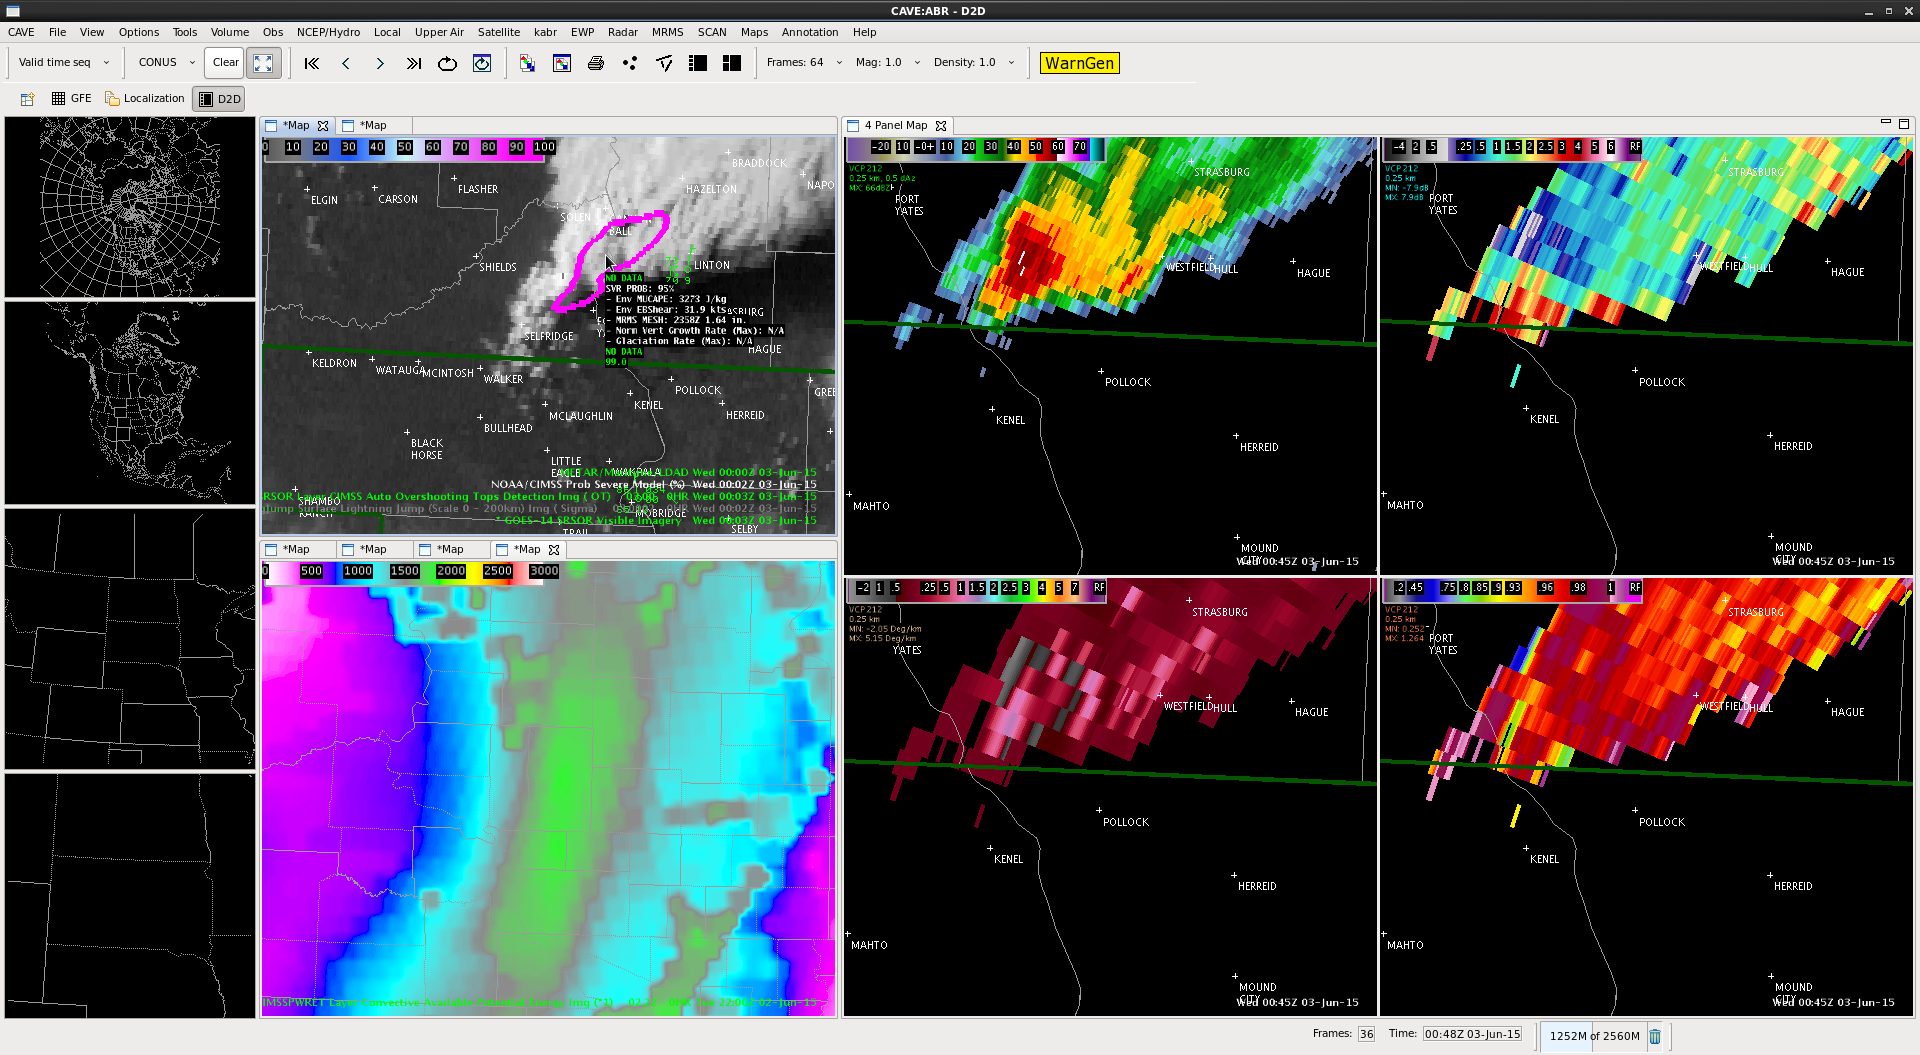
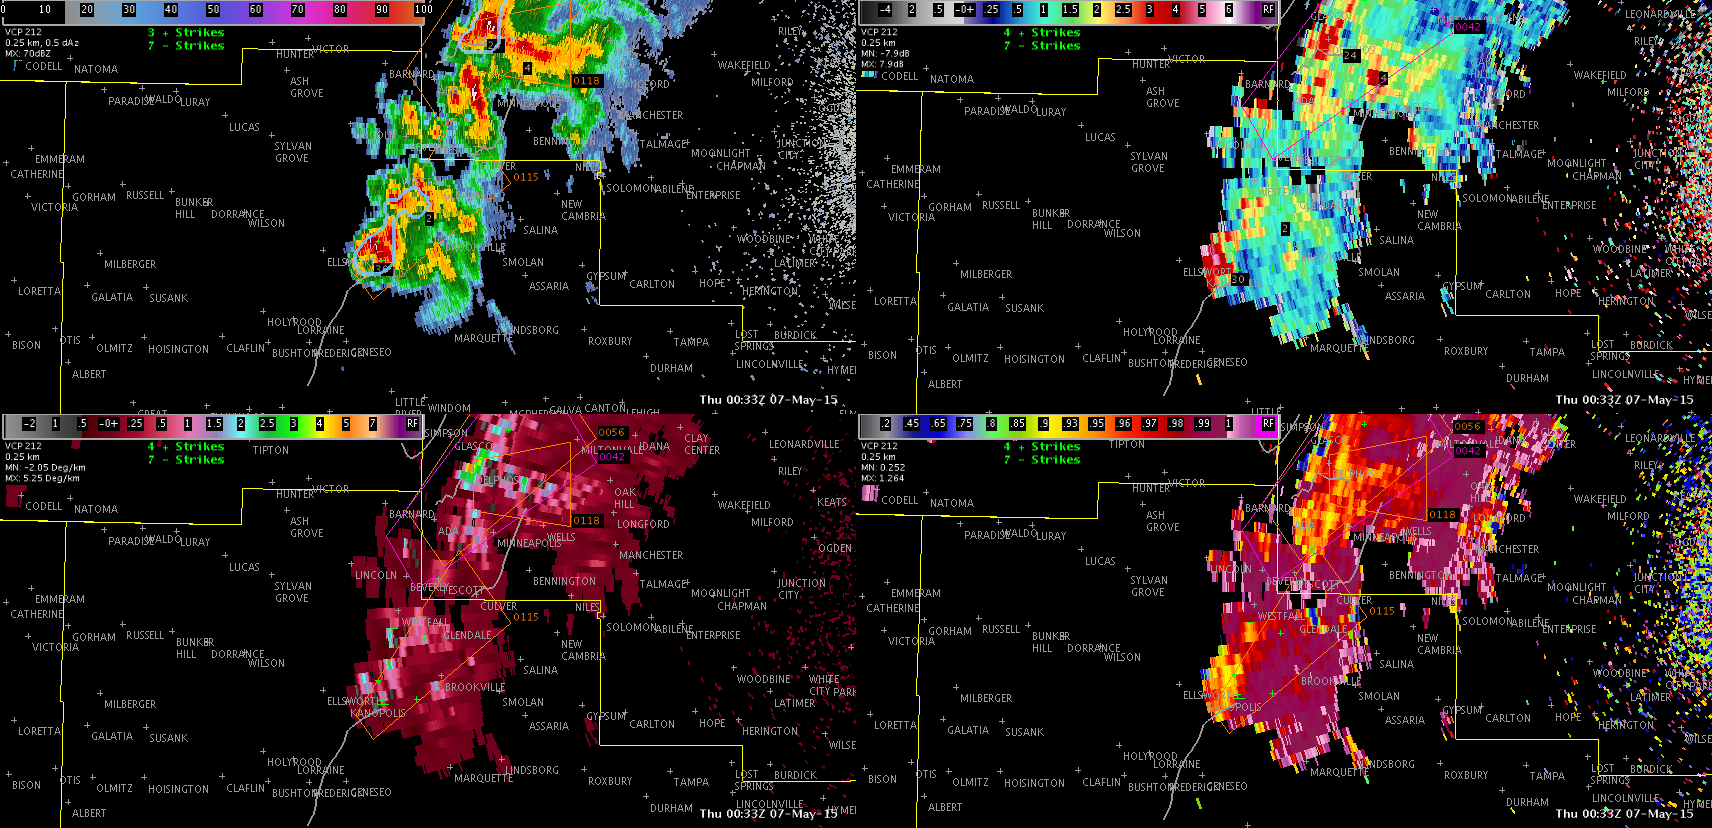
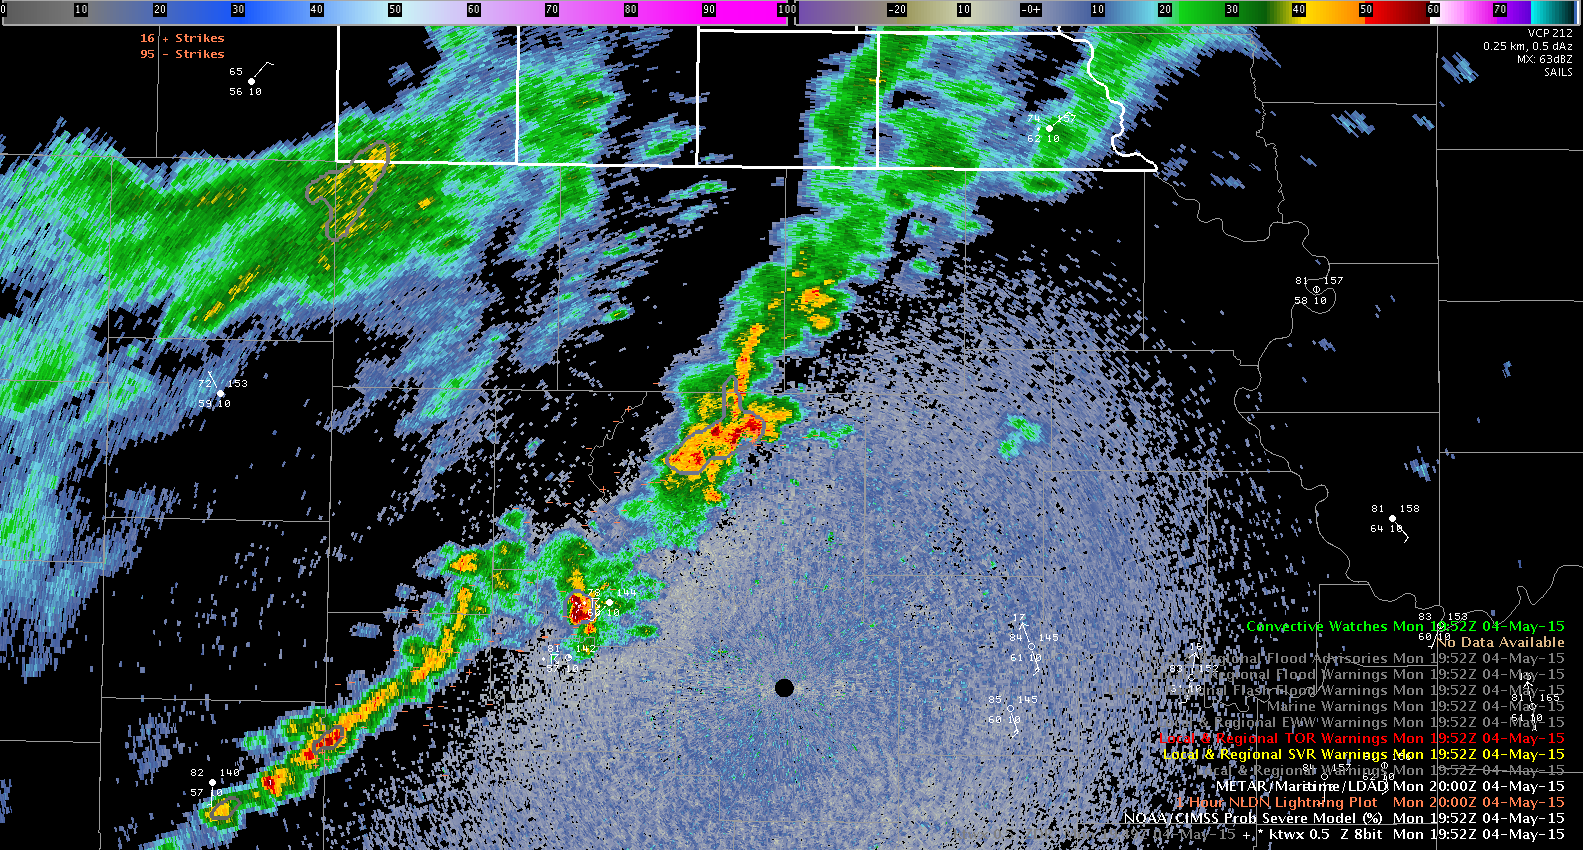
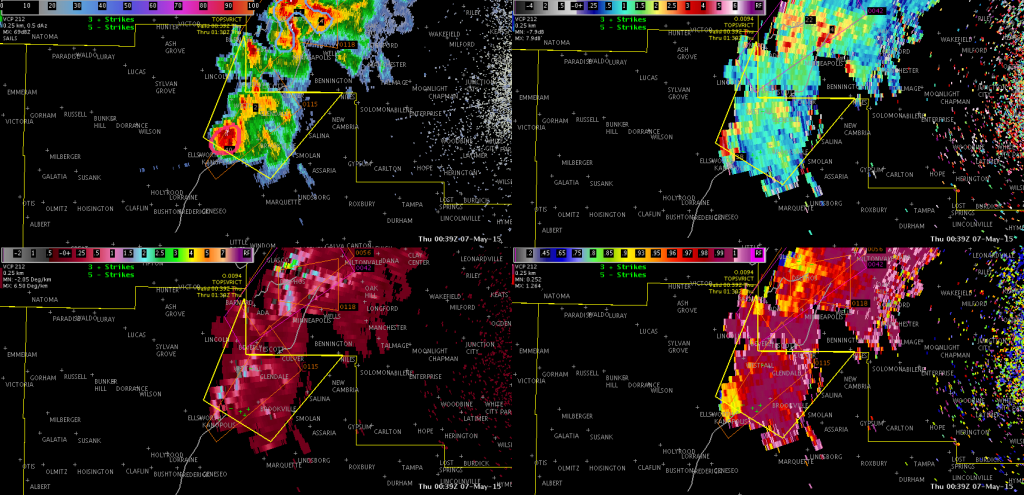
After a busy day at ICT, we have come to the conclusion that radar base data is still our #1 when it comes to warning operations, while the other tools are “confidence boosters”. With many (if not all) of the warnings we issued today, there was little doubt that the storms were likely to produce severe weather. The radar base data told us what we needed to know to go ahead and issue the warnings, with things like lightning jumps and prob severe being more of a reassurance. In a lot of cases, the prob severe did not substantially increase until we we already in the process of writing up or had already issued a warning. Take this storm in Ellsworth County, KS for example.

KICT_ellsworth_pre

When we decided to issue a SVR for this storm, the prob severe was only 13%. Meanwhile, the base data was pointing towards severe hail.

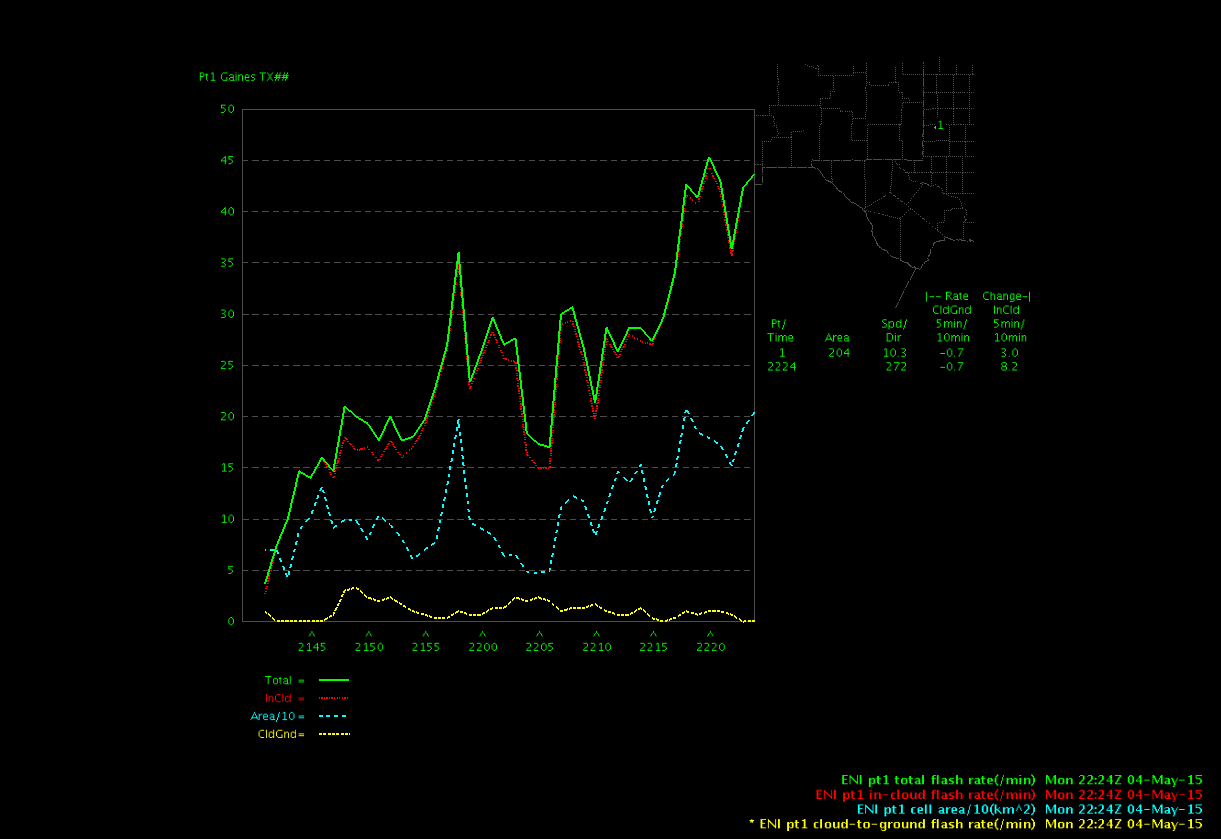
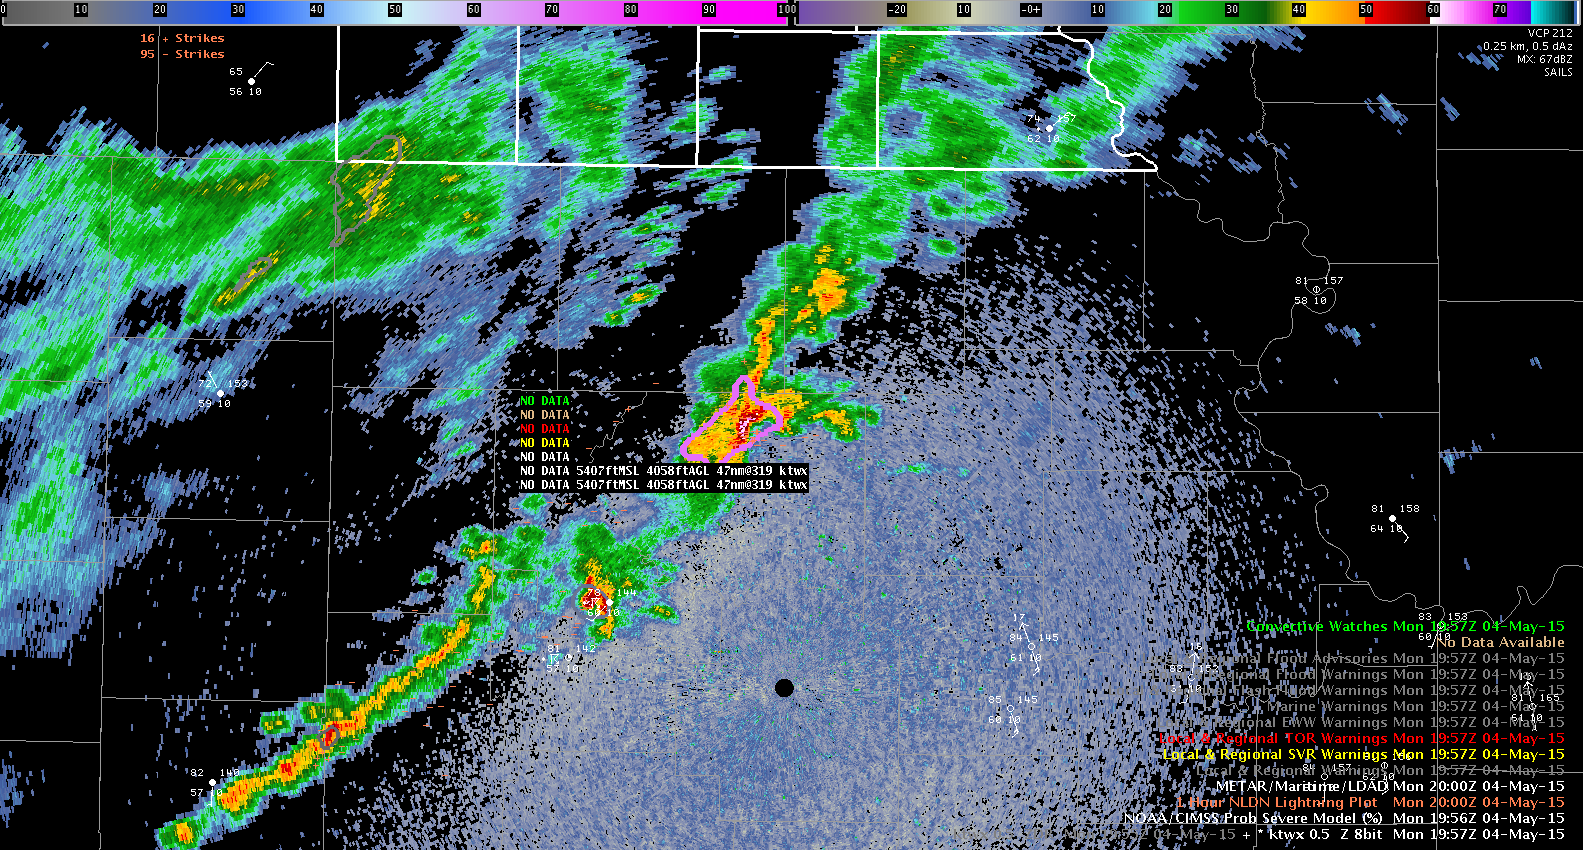
As the warning was being typed up, the next volume scan came in and the prob severe jumped to 85%. Trends in lightning were also more of an afterthought/confidence booster with regards to subsequent storm intensification.

KICT_ellsworth_post

In cases like today, the supplemental tools did not necessarily add any lead time. We do think tools like prob severe and changes in flash rates would be a bigger help with the warning decision making process in marginal severe environments or pulse storms.

Jack Bauer/V. Darkbloom

Tags: None

Lightning Jump and Cell Intensification

Another significant lightning jump occurred in west Texas (Midland CWA) around 2134Z (434 PM CDT). The jump was 4 sigma – shaded red below.

MAF 4 sigma jump

A time series reveals this was the first in a series of jumps.

MAF 4 simga time series

The second jump around 22Z was 2 sigma. A loop of the 0.5 deg reflectivity shows the cell intensifying after the lightning jumps occurred. The max Z at the 0.5 deg tilt increaed from around 63 dBZ to around 71 dBZ in 8 minutes, or two volume scans.

radar_loop

(click image to animate)

In this case, the lightning jump is a good indicator of imminent storm intensification.

-V Darkbloom

Tags: None

ProbSvr and the Development of a Supercell in Northeastern Kansas

The storm of interest began to develop in a weak line of showers around 1930 UTC.  Surface obs through the area indicate temperatures in the lower 80s and dewpoints in the upper 50s to low 60s.  ProbSvr indicated around a 10% chance of the storm becoming severe.  The storm slowly strengthened over the next 20 minutes, but the Prov Svr remained around 10%.  From 19:52 to 19:57 UTC, the storm intensified rapidly, and the Prob Svr jumped from 13% to 72% (time of two radar scans)

ktopProbsvr10ktopProbsvr72

It appears the storm is beginning to root along the E-W warm frontal boundary through the region.  At 20:11Z, ProSvr MRMS MESH indicates 2″ in diameter hail in the highest dBz core.  This area correlates well with lower values of Zdr of near or just below 0 dB.ktopProbsvr2011utc

Although I did not see any hail reports while I was watching the storm, the first severe wind gust report (60 mph) occurred at 20:30 UTC, about 32 minutes after the ProbSvr rapidly increased.  Because I used the site radar (KTWX), there was a slight lag in the availability of the ProbSvr data.

Tags: None

CI vs Radar

Comparing CI at 1900z with 1930z radar. Looking at north central Eddy County, south-east Dawson County and south-west Borden County. So far so apparent correlation. 19zMay4CI

1939z radar May4

-Lynford


Tags: None