Stronger Core

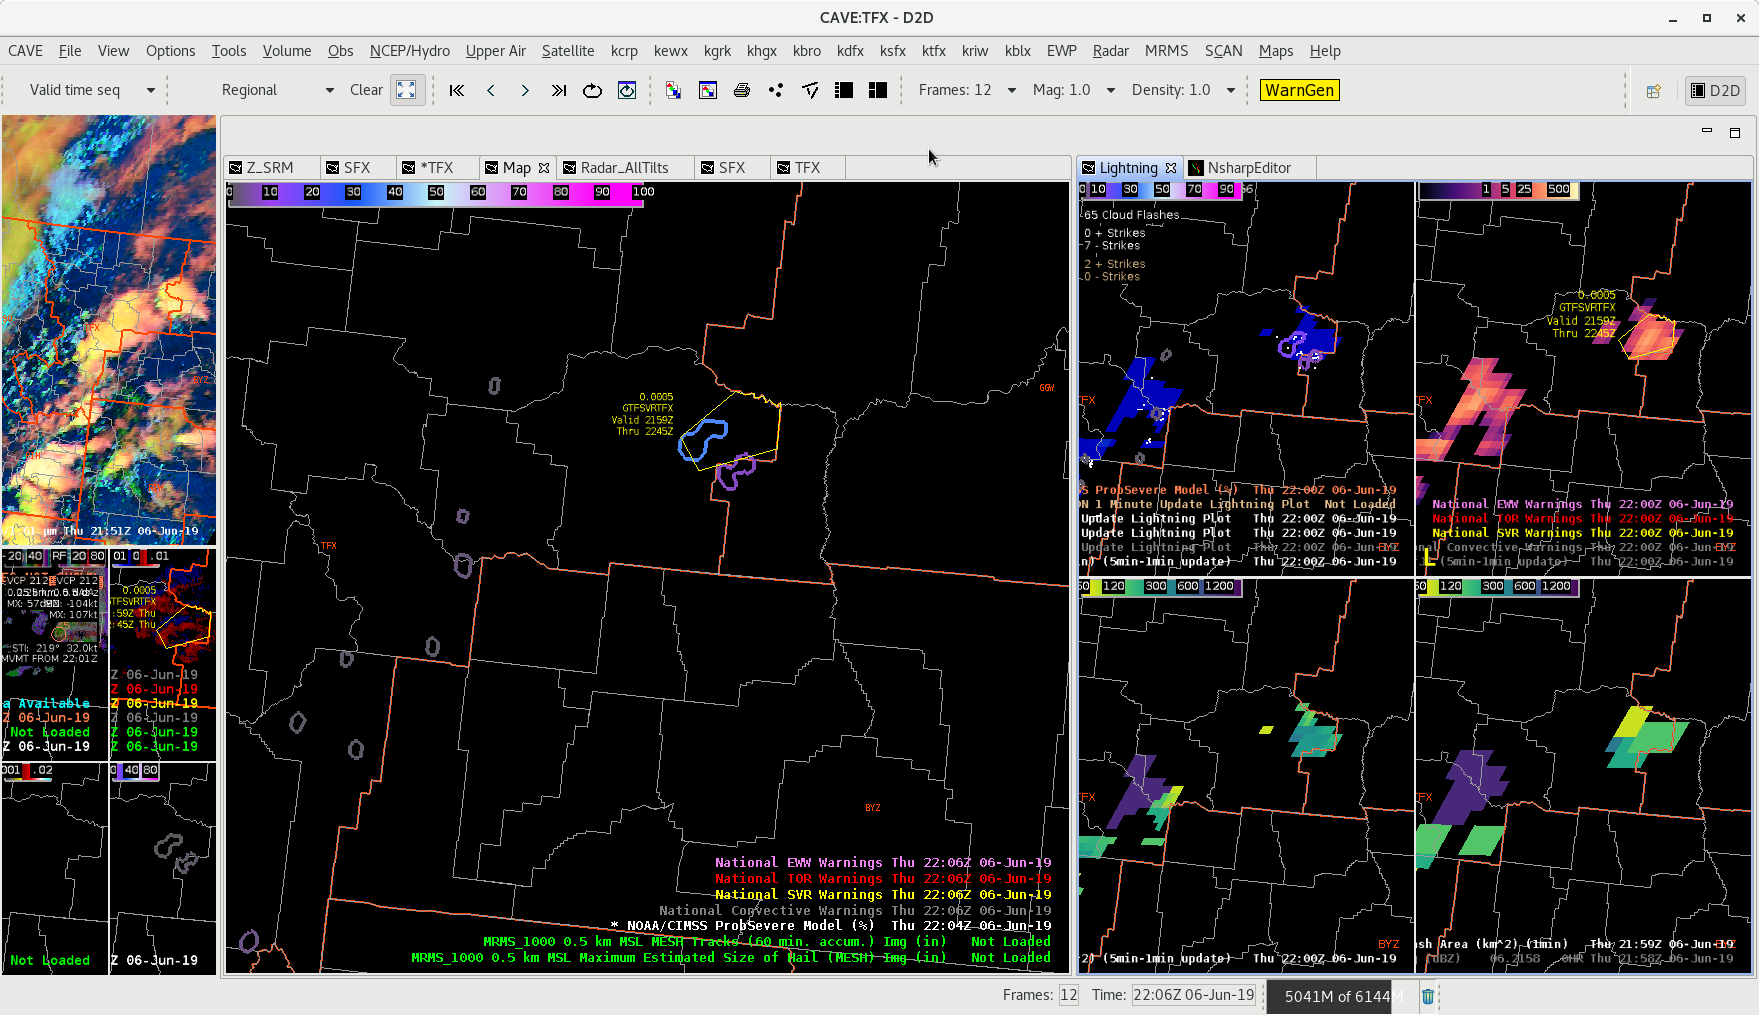
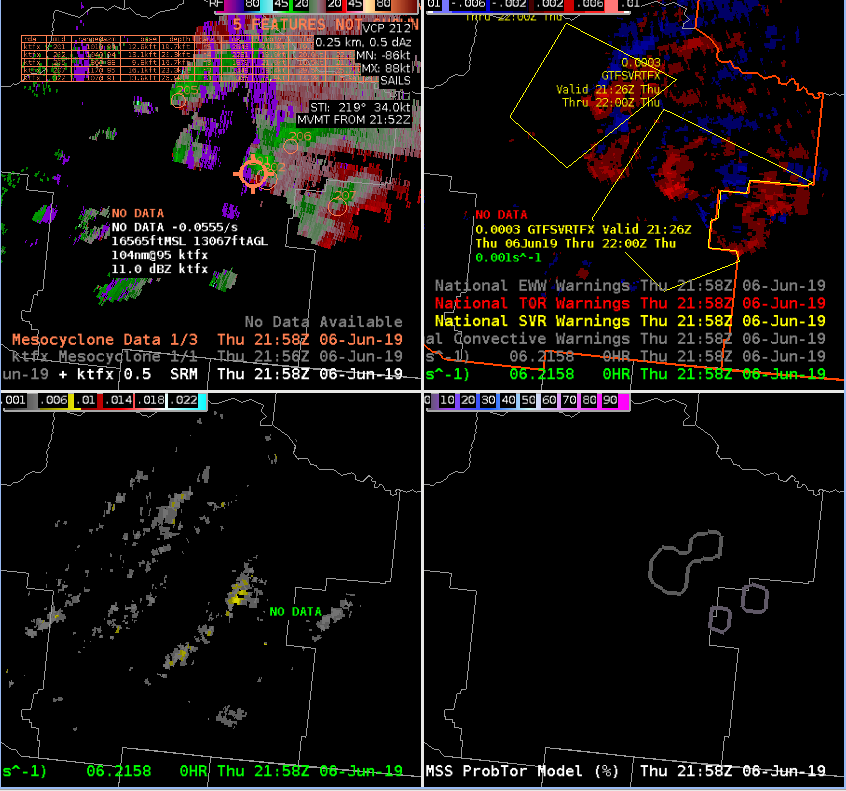
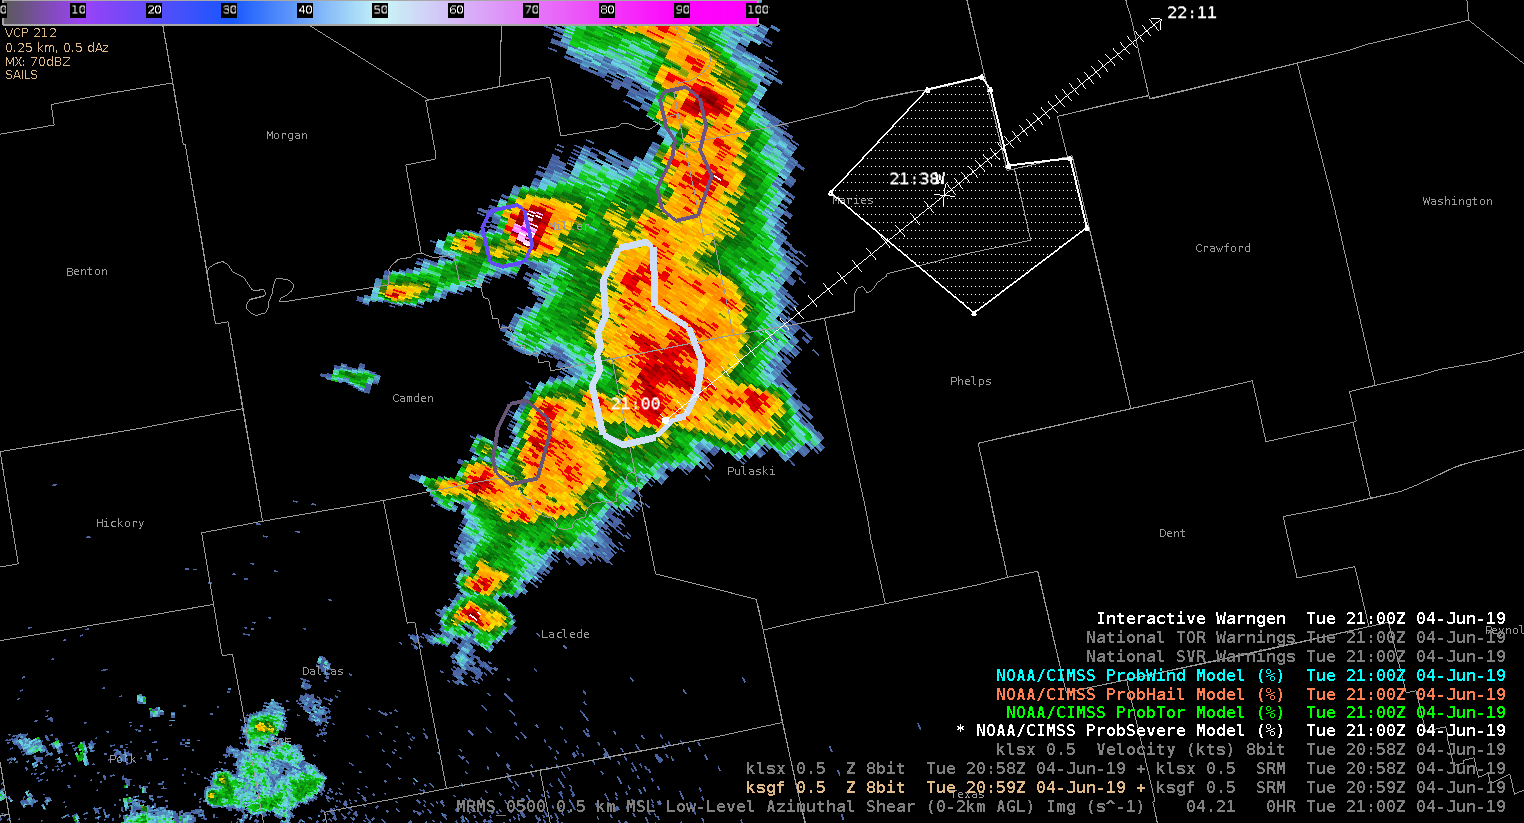
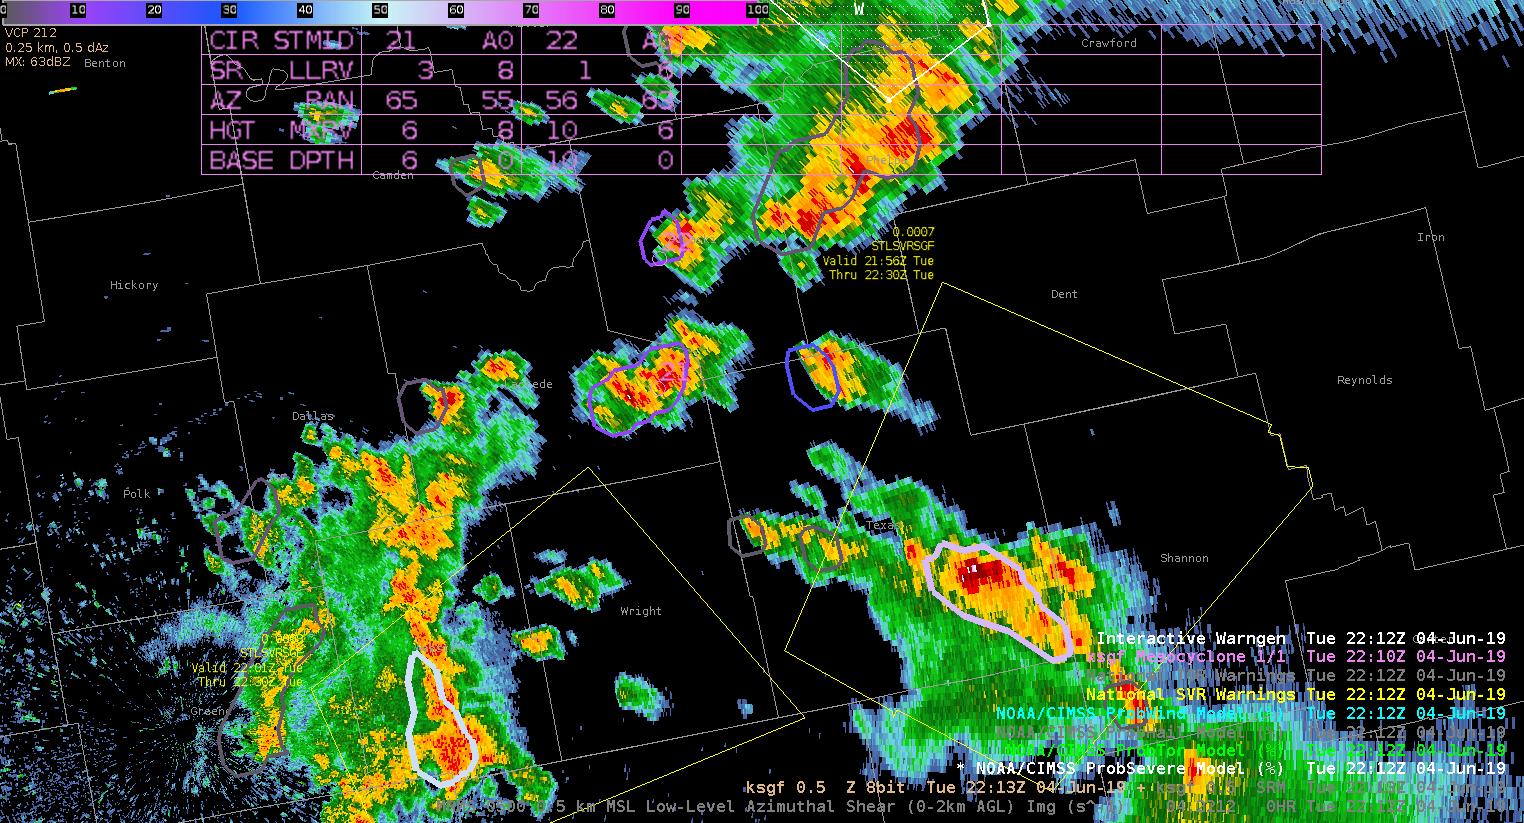
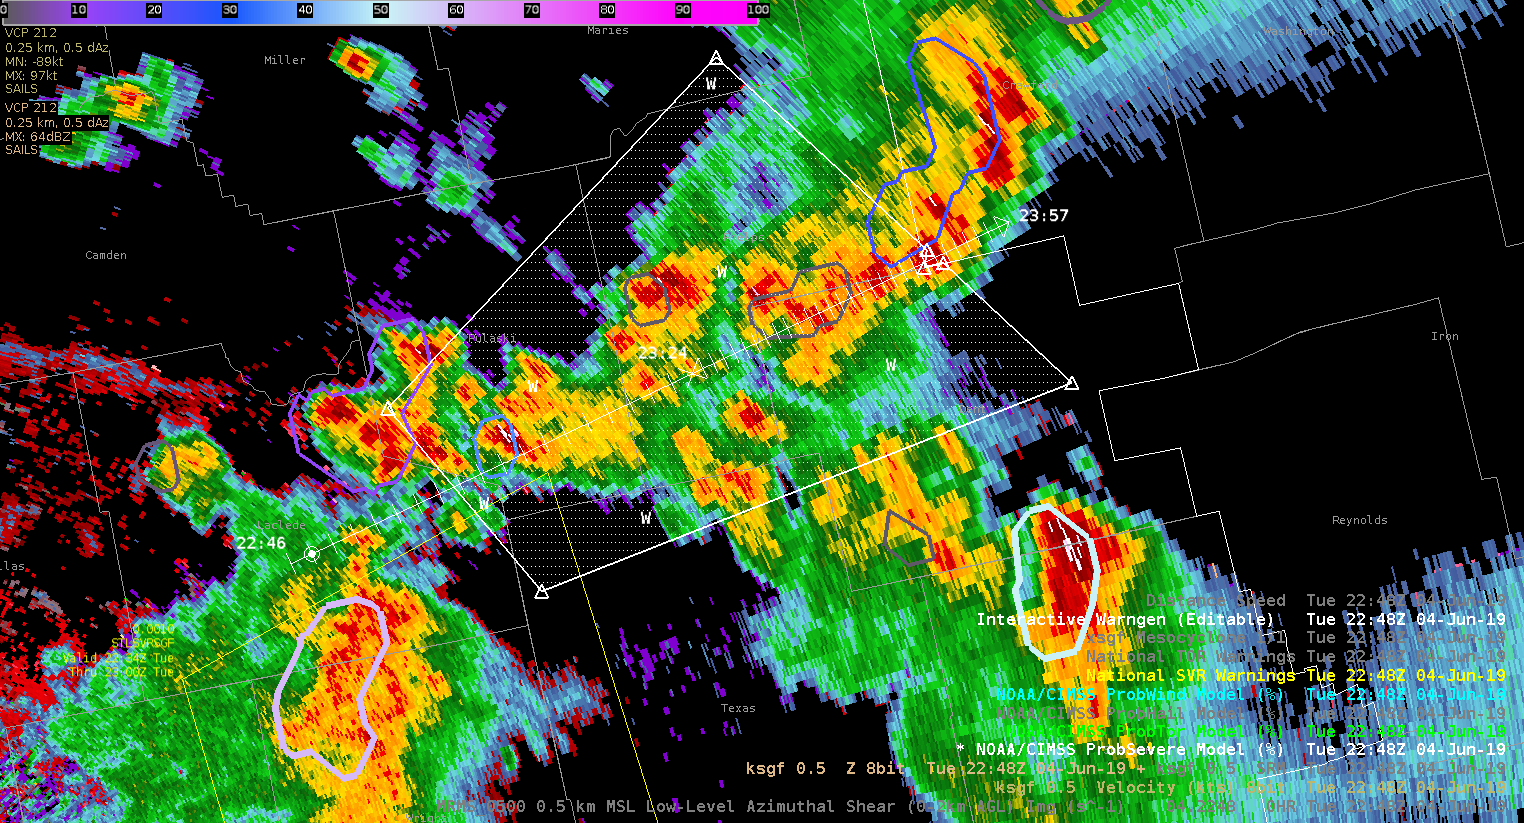
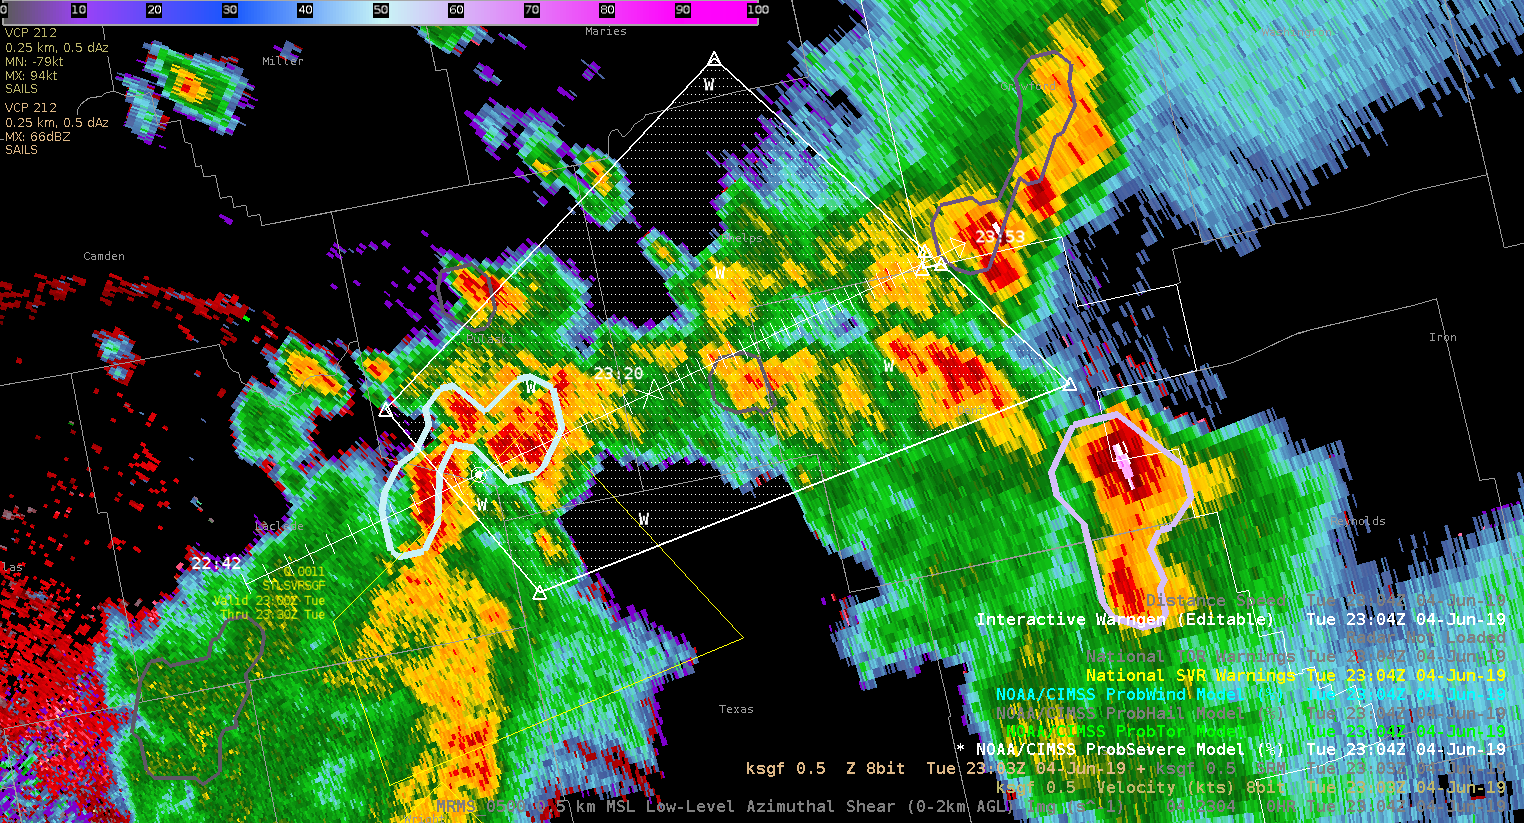
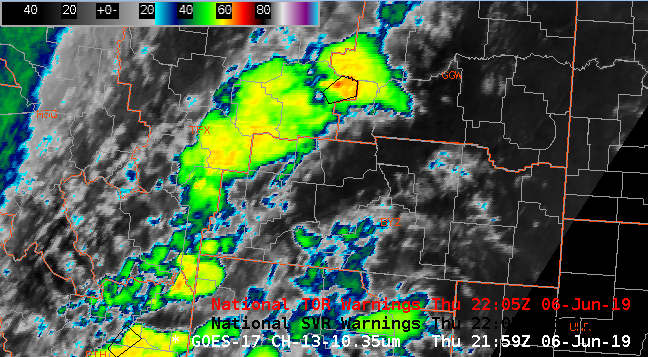
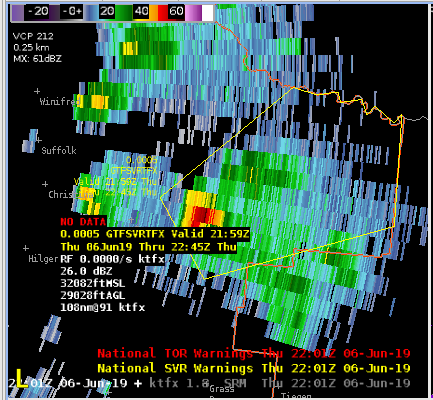
Continuing the SVR downstream, as yet another strong core pops up.  Colder cloud on IR and now prob severe is starting to jump up.  Blue color showing ProbHail and ProbWind in the 30s.

Cell also showing more signs of organization in the SRM…better chances for hail.

Also getting a pickup from the DMD (latency issue still for NMDA).

Charley

Springfield Illinois Storms

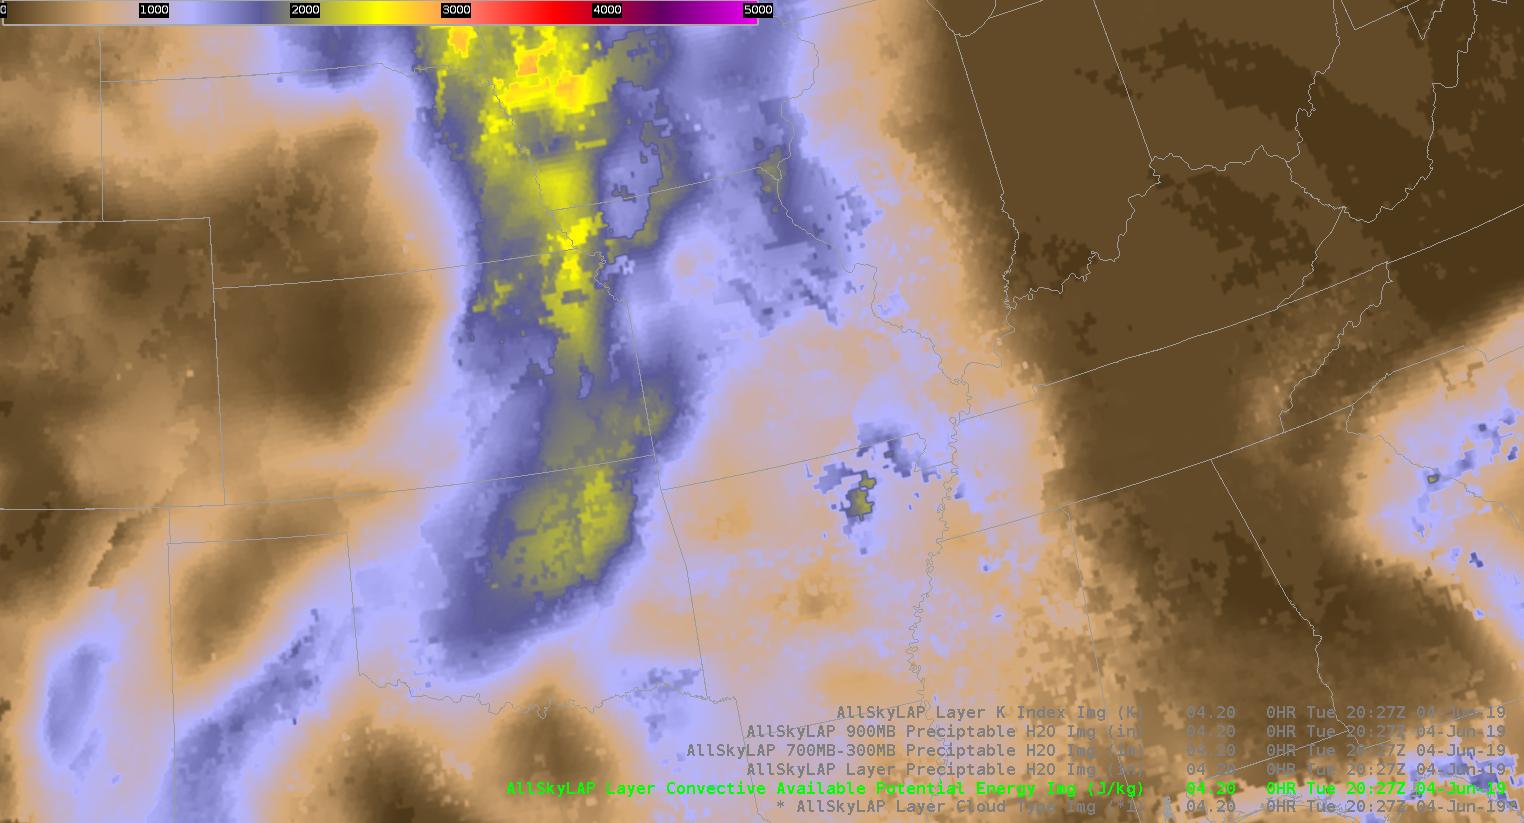
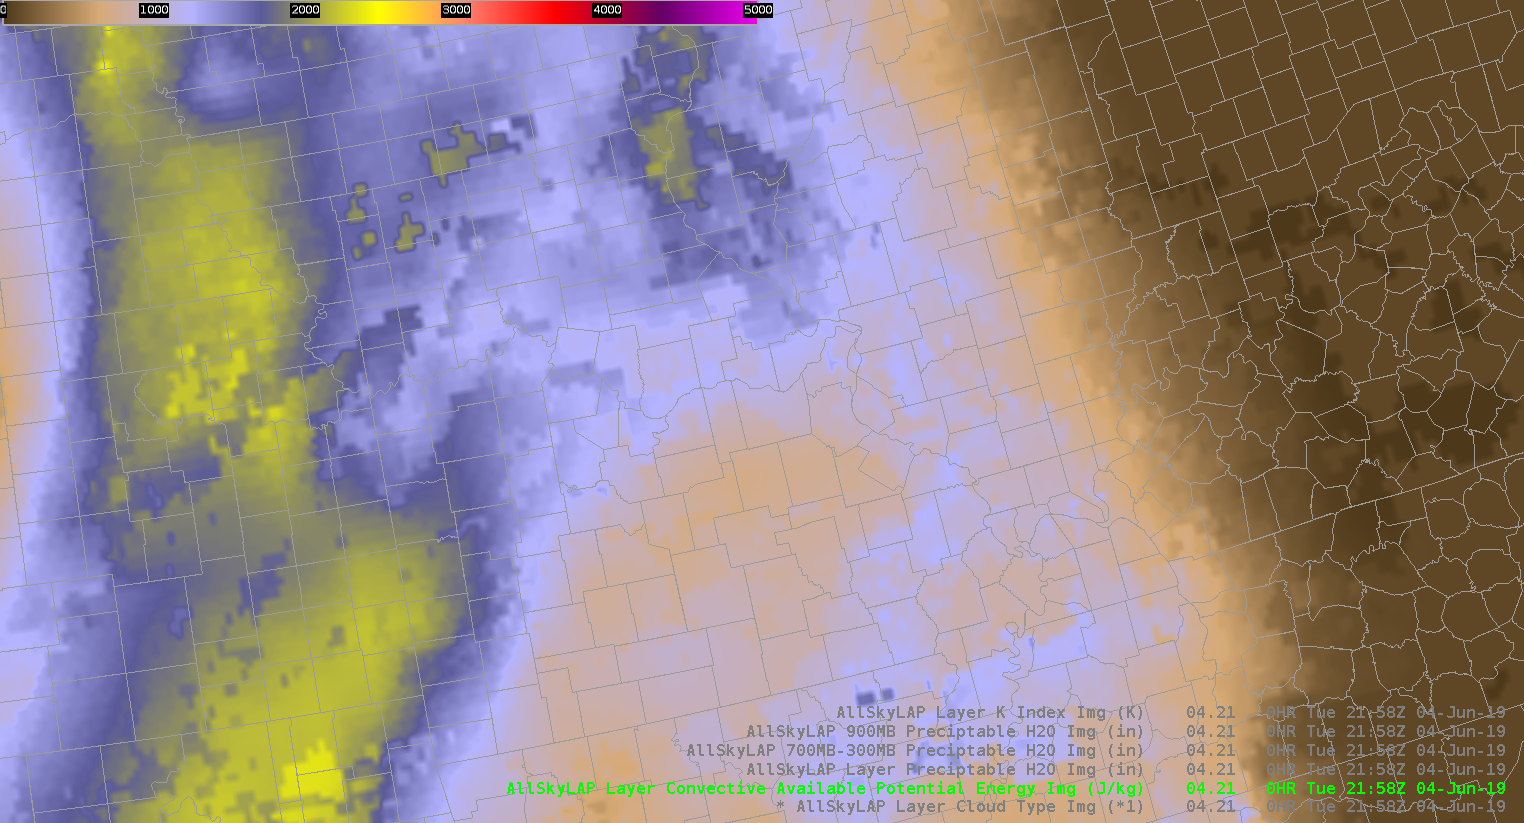
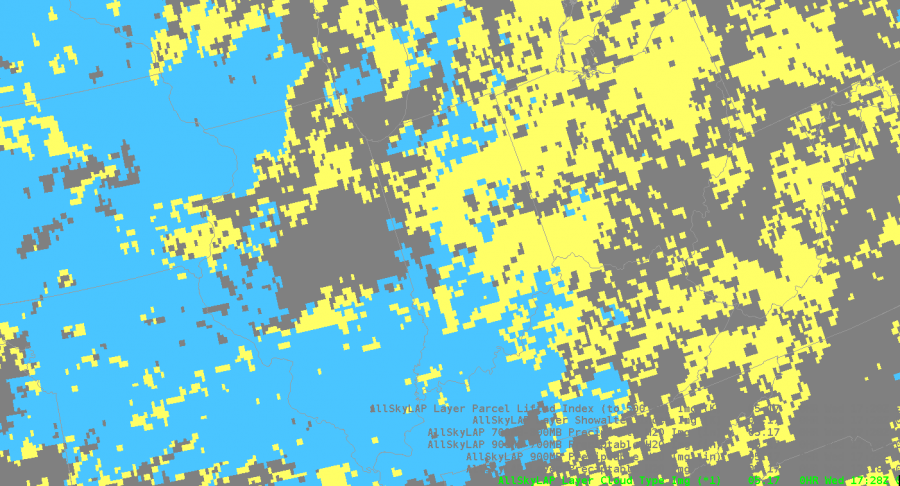
Right now I’m analyzing the various new products to nowcast where and when storms will intensify. Currently I’m comparing ALLsky cape to the mesoanalysis from the spc. Right now the mesoanalysis is higher with cape compared to allsky. Over our area the it’s cloudy so the it’s taking data from the GFS.

A cell in our western counties ramped up very quickly while our computers were down. Prob severe immediately directed our eye to the cell. The probsevere lined  up with an uptick in vil values and velocity.
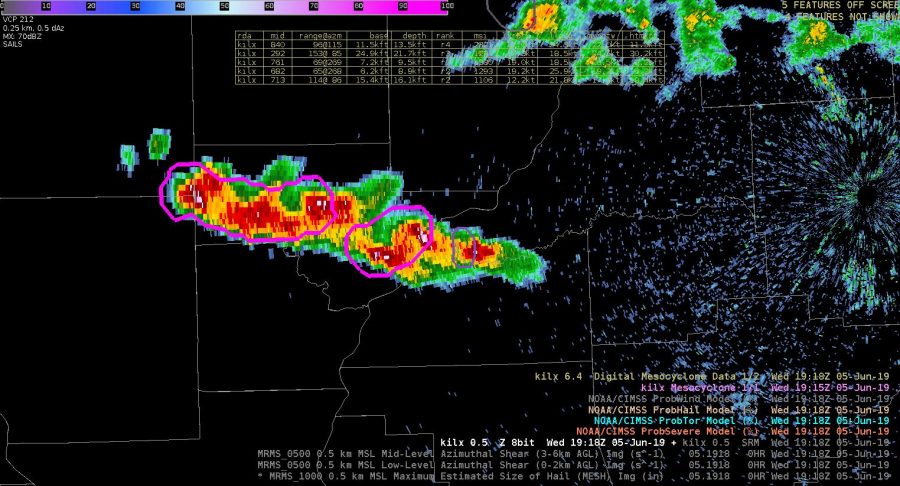
I’m comparing the actual sounding to what’s shown on nucaps, and allsky to see what’s initializing the best. The actual sounding shows 3025kj of surface lavyer cape and 1453 of mixed layer.
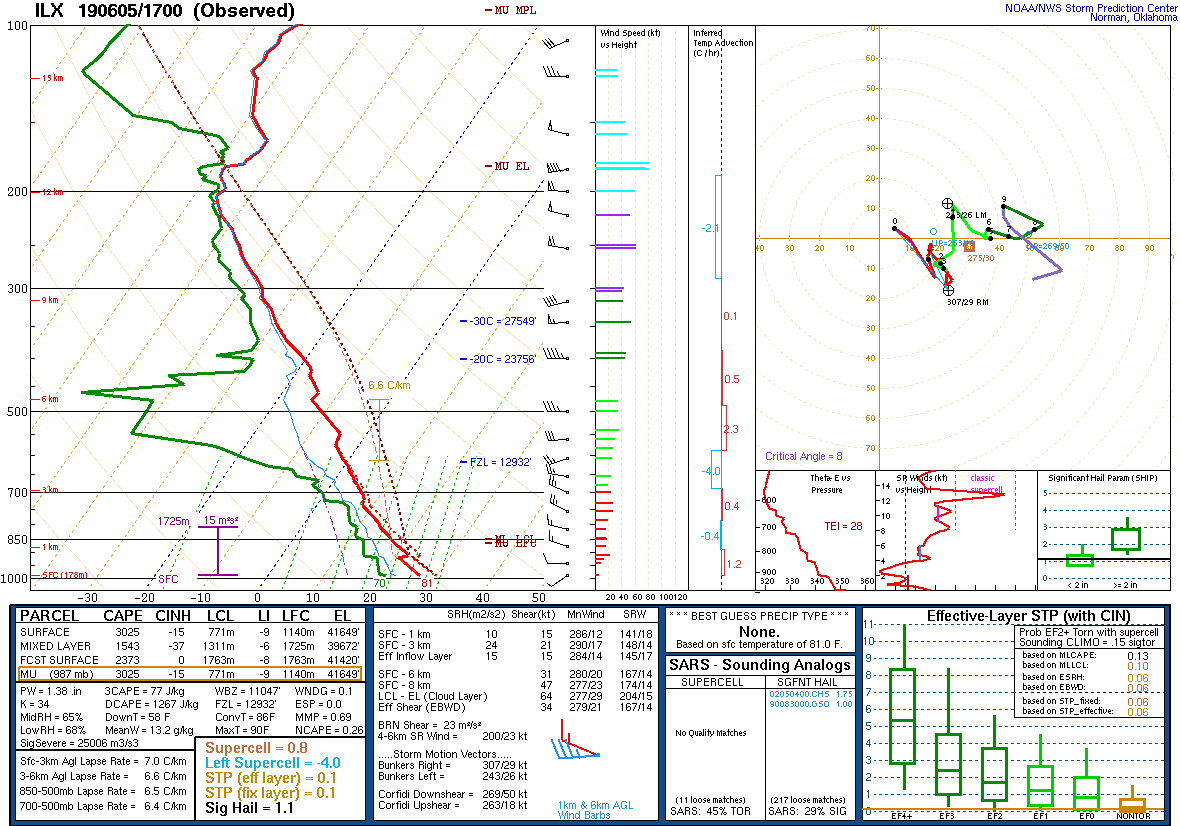
Around the same time allsky shows a similar value of cape.

The modified sounding was closest to the actual sounding with 1515kj of mixed layer cape
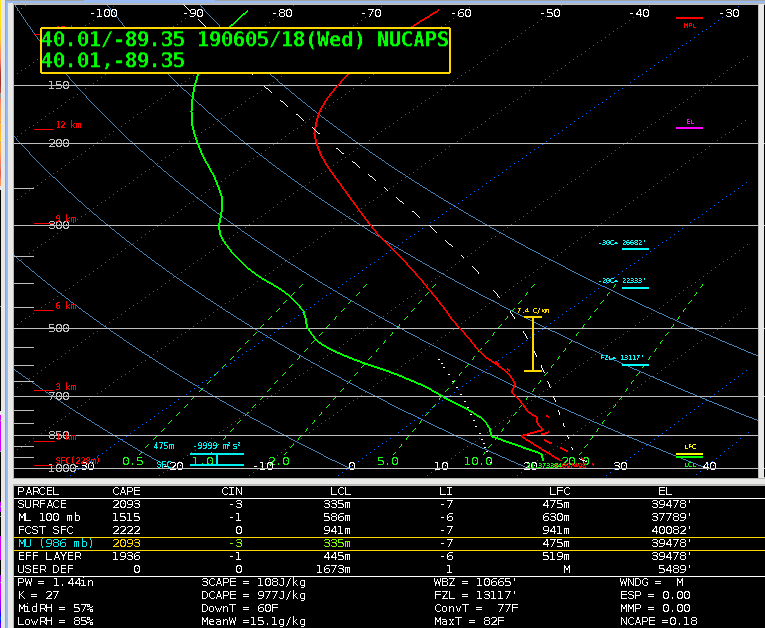
The nonmodified sounding is much lower when it comes to mixed layer and surface cape. In the case the modified sounding was more reliable and gave a more accurate picture of the current state of the atmosphere.
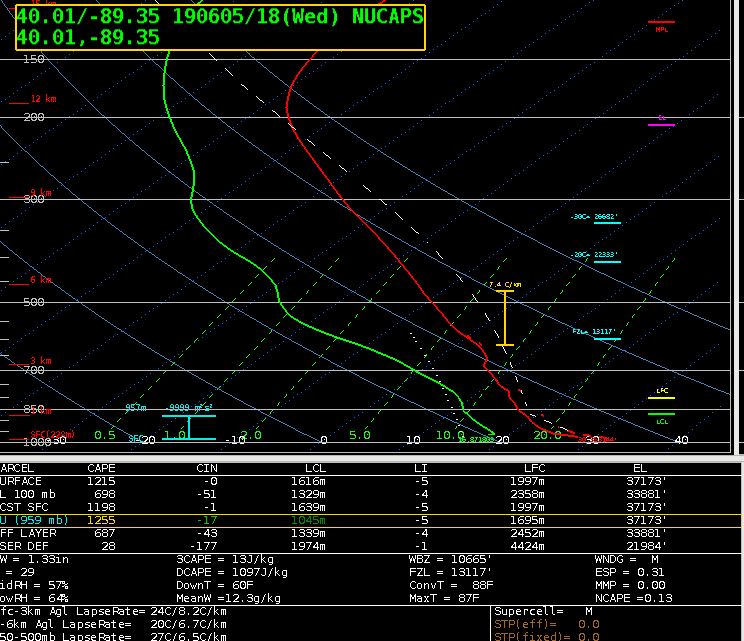
The all sky cape was much higher, around 2300kj.
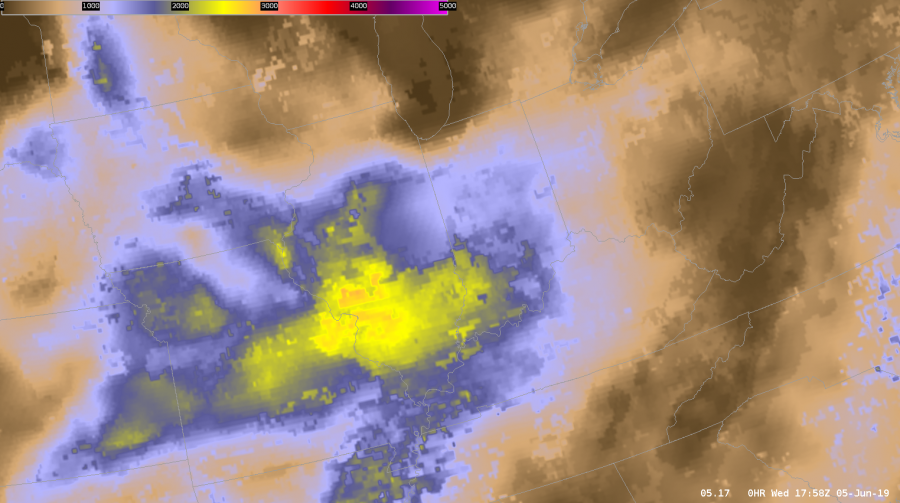
That increase might be due to the fact that the sampled area of interest was filled in by the GFS. Whatever input the GFS was taking into might have lead to it overestimating the amount of CAPE.
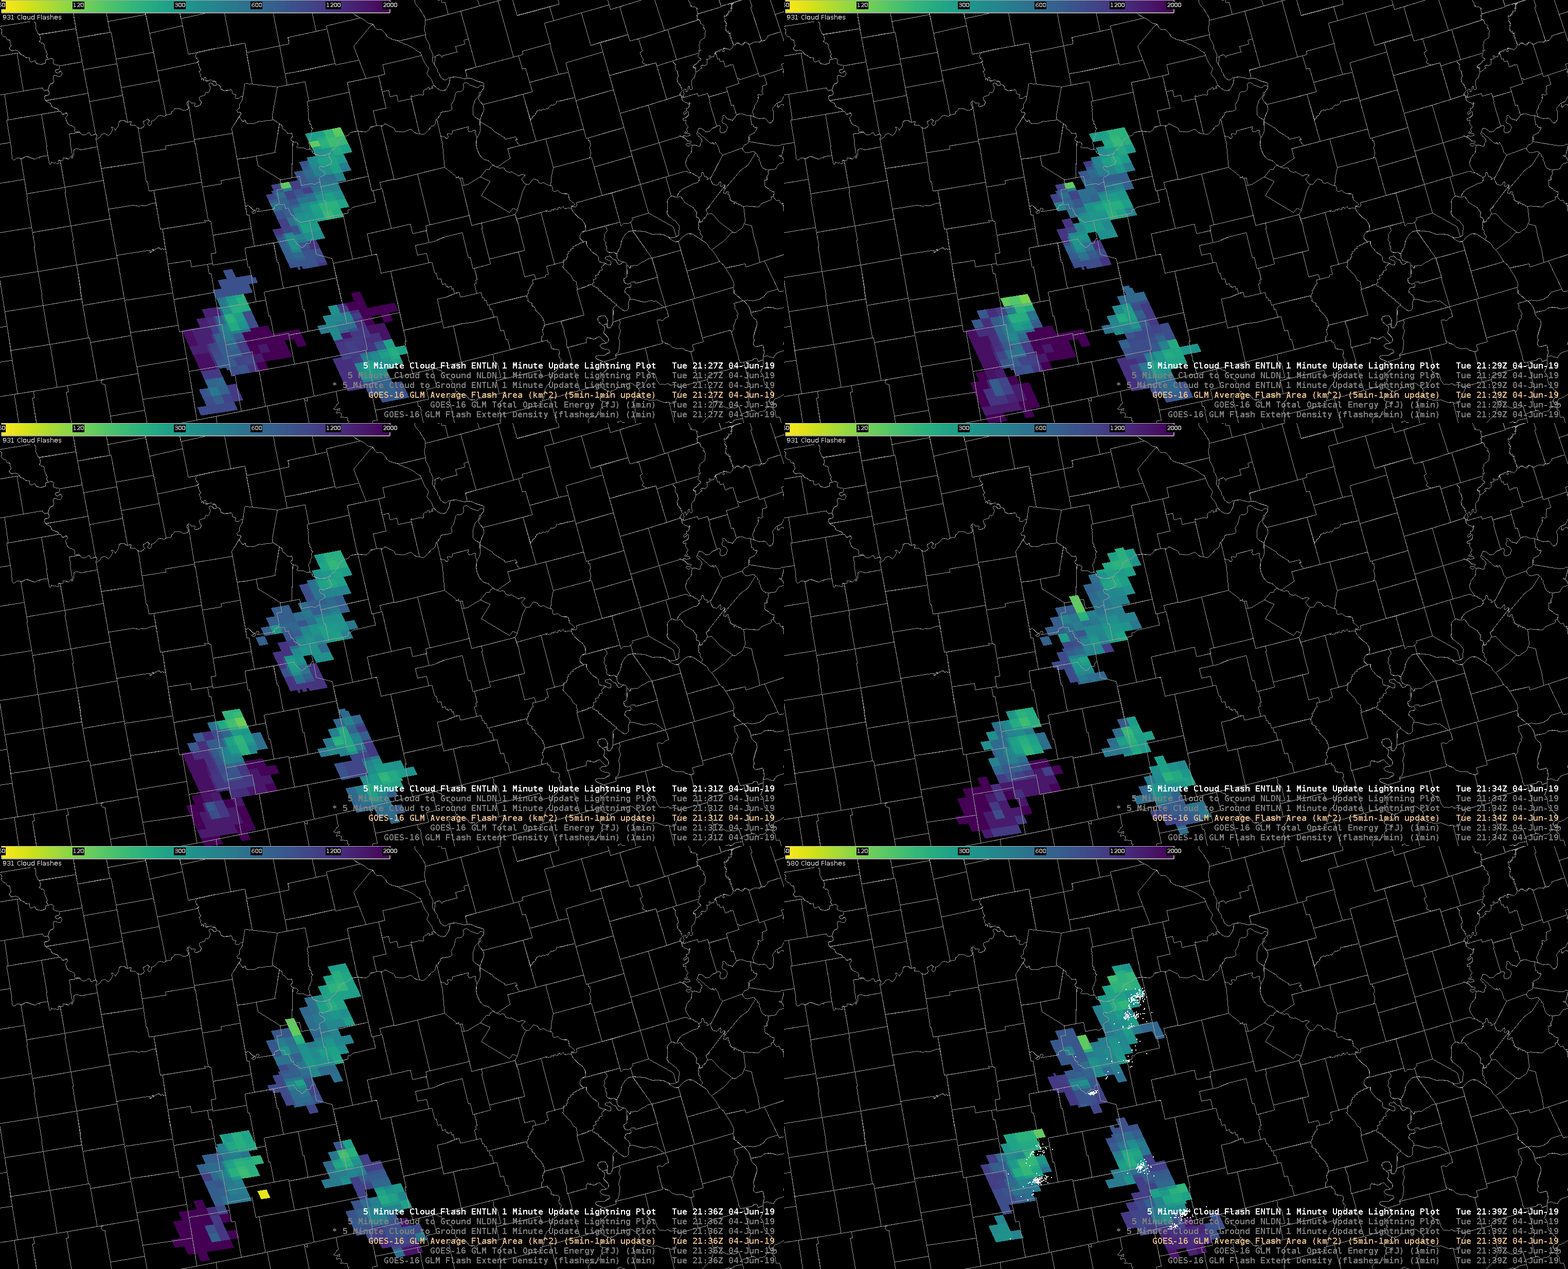
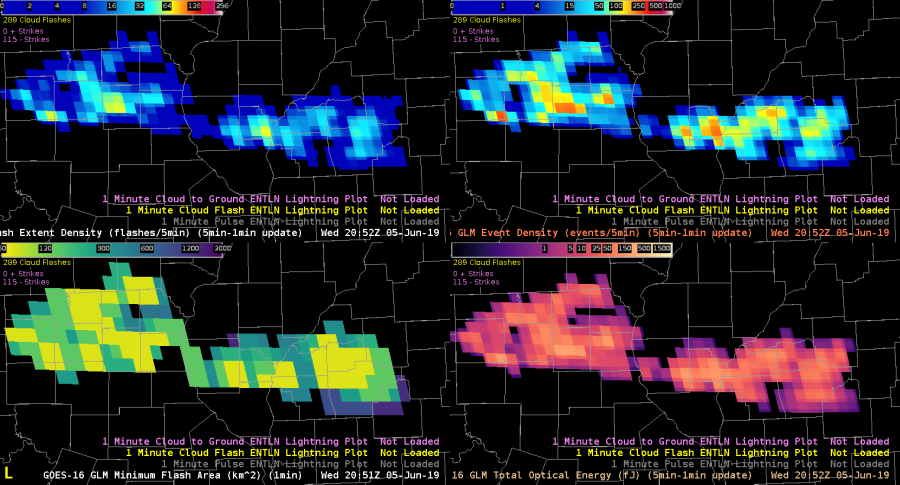
I’m also looking at GLM products to see trends with convection. The combination of event density and GLM minimum flash area help me to see the rapidly growing updrafts as well as cell that are producing hail. That’s the case right now. My warned cell is producing penny size hail.
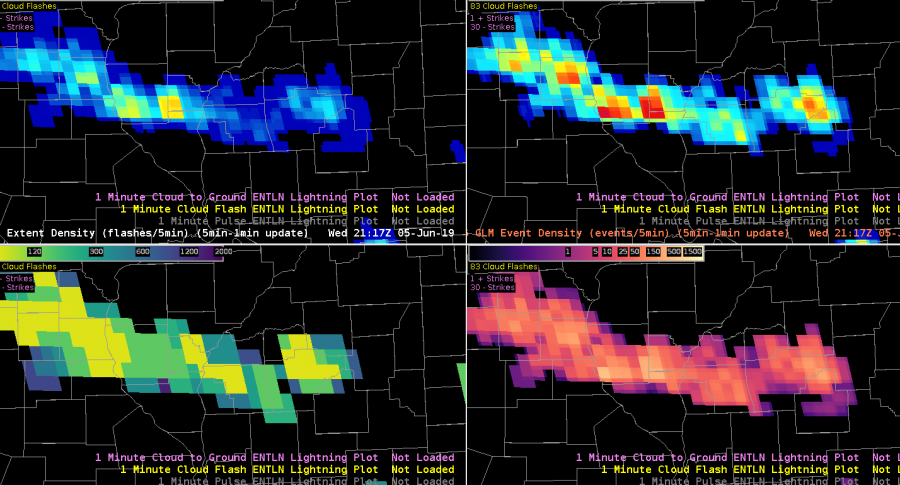
About an hour later the FED Is starting to pick up on longer flashes, but the event density is still showing higher values. The lines up with satellite which shows overshooting tops, but storms are overall keeping their intensity. The overall trend combined with looking at stability indices aids me in nowcasting that storms will at least maintain their strength over the next hour or so.
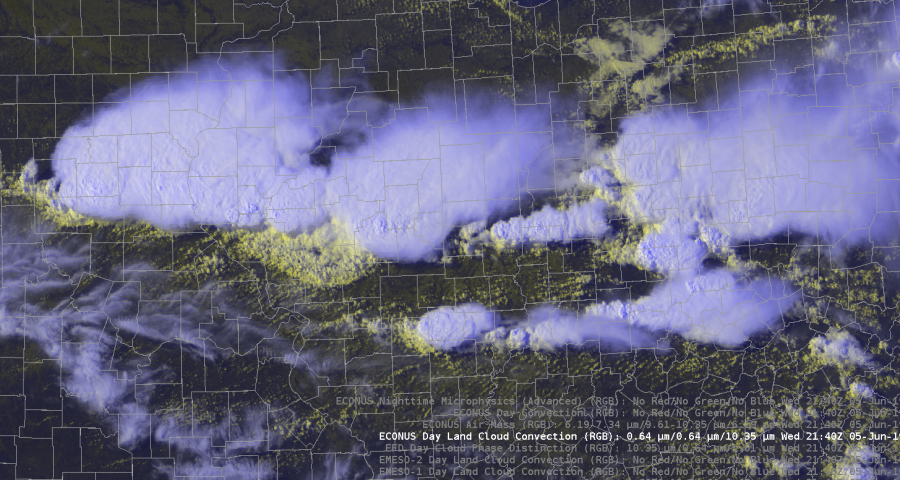
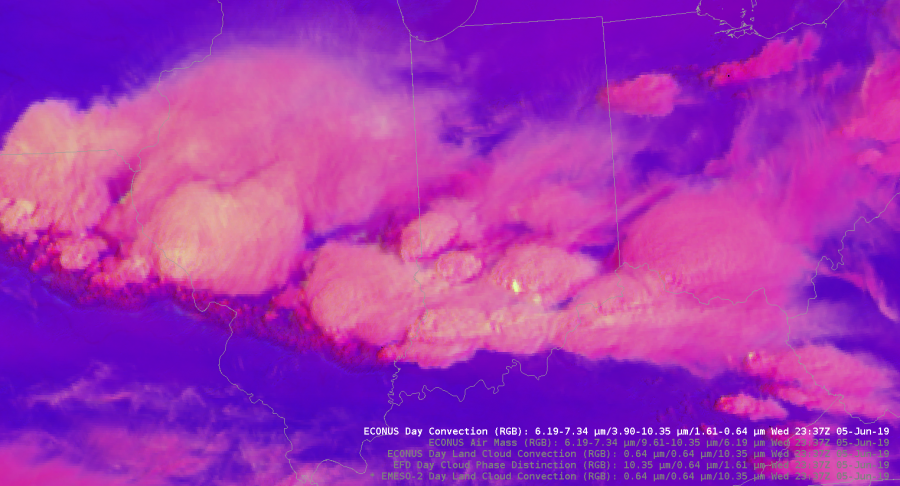
The Day Land Cloud convection RGB was helpful in analyzing different cloud tops. The color scale highlighted the thin cirrus compared to the lower thick clouds. It also dipicted the outflow boundary from our southern storms very well. It gives much more detail to the cloud types compared to the visible satellite.
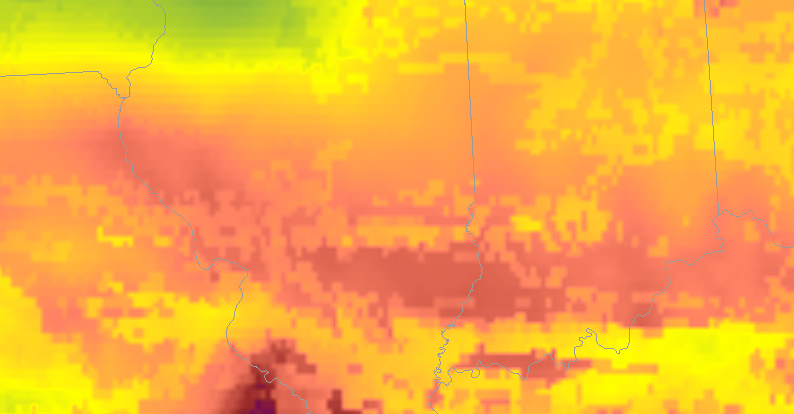
Today I also got the chance to analyze and compare the merged TPW precipital water with the allsky.

During the afternoon the PW values stayed fairly steady across the northern half of the state while moisture increased in southern Illinois.
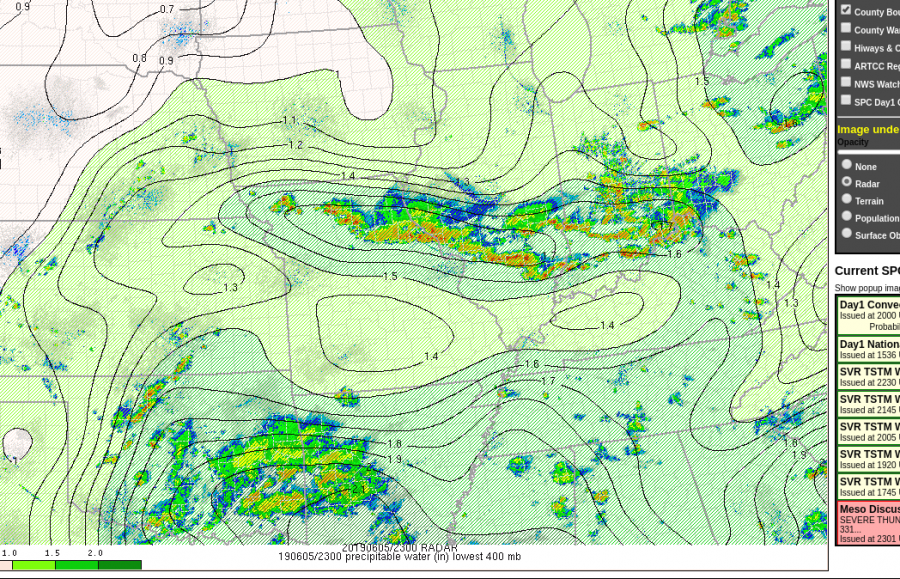
The TPW decreased PWATS to close to 1 inch as storms moved through. T
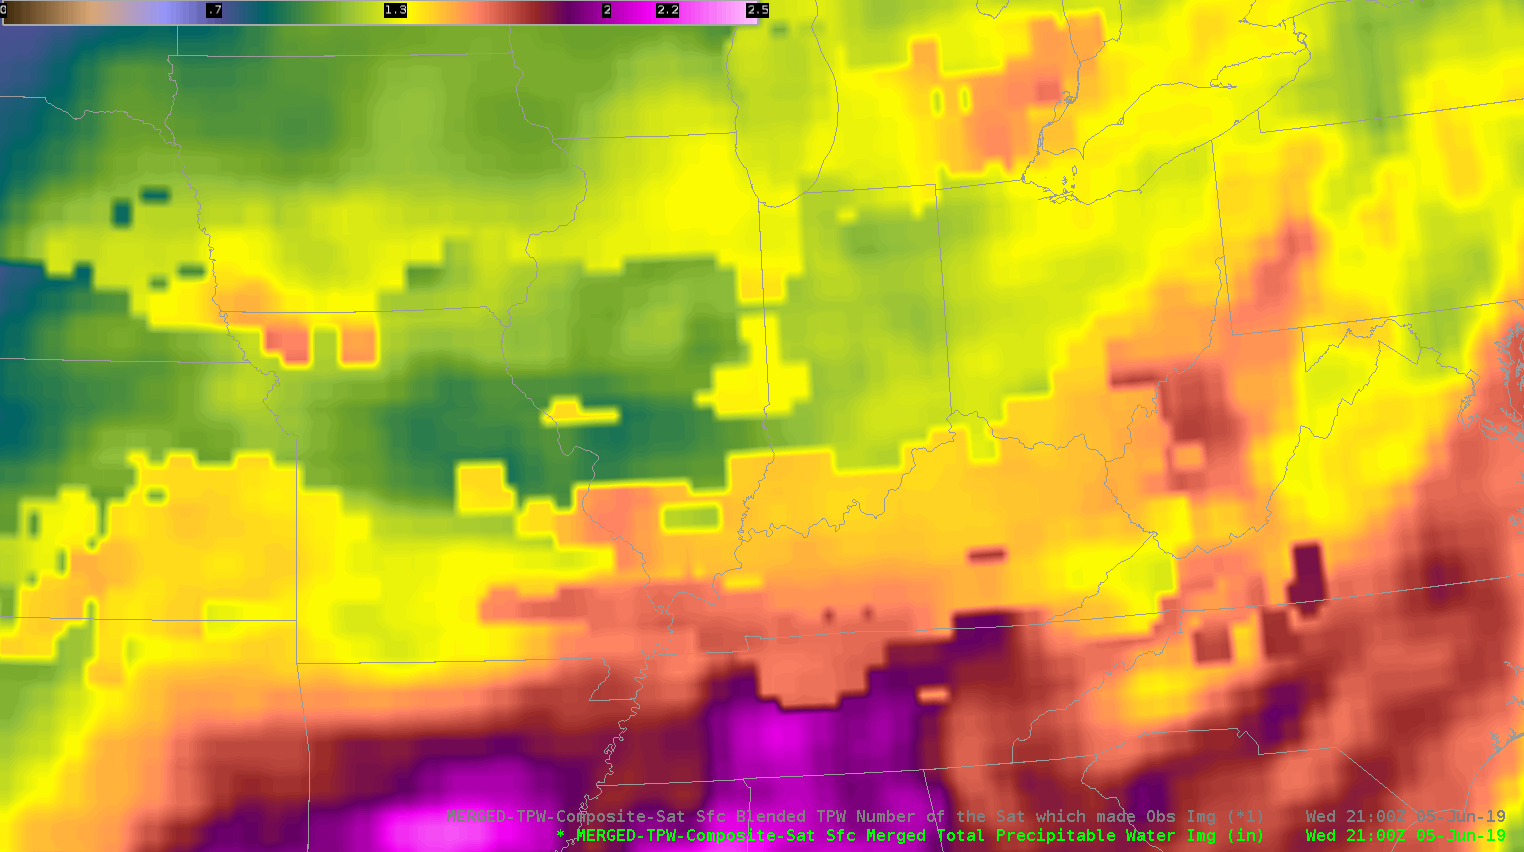
That data was sampled in a cloudy environment.
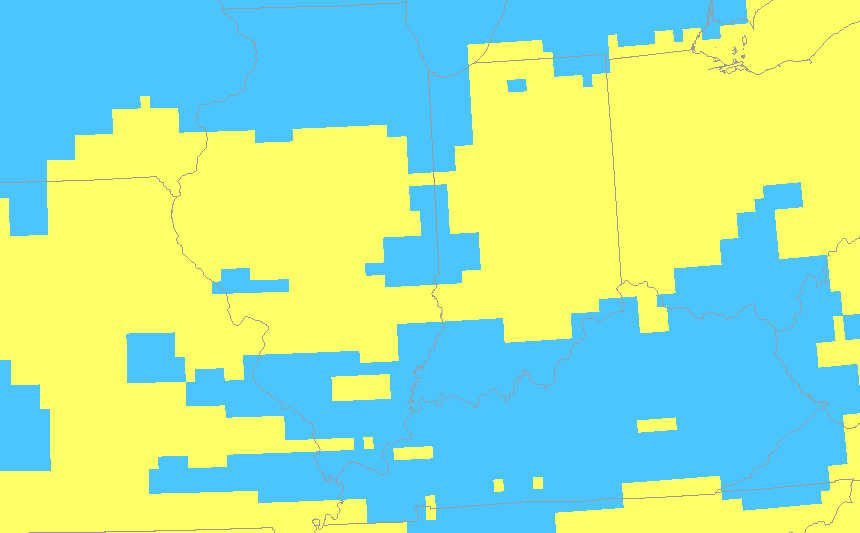
Meanwhile, the AllSky does show a decrease in PWATS but’s farther north compared to what actually happened. That data was pulled from the GFS since it was in a cloudy location. It was helpful to see how each product performed in this environment. It’s nice to have access to both in order to see which one has the best handle of the current atmosphere. That initialization helps me monitor trends and nowcast.
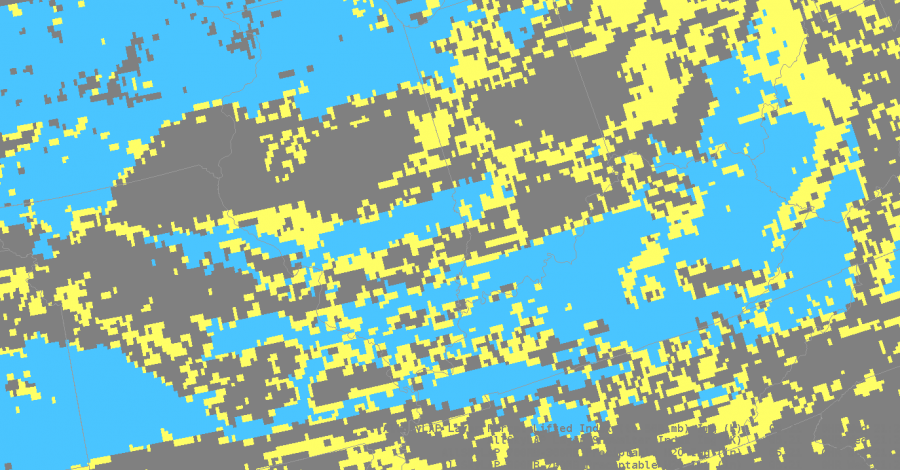
As storms moved south out of my DMA I used Day convection RGB just to monitor growing cells. It was clear to see the strongest storms because they had the bright yellow maxes.
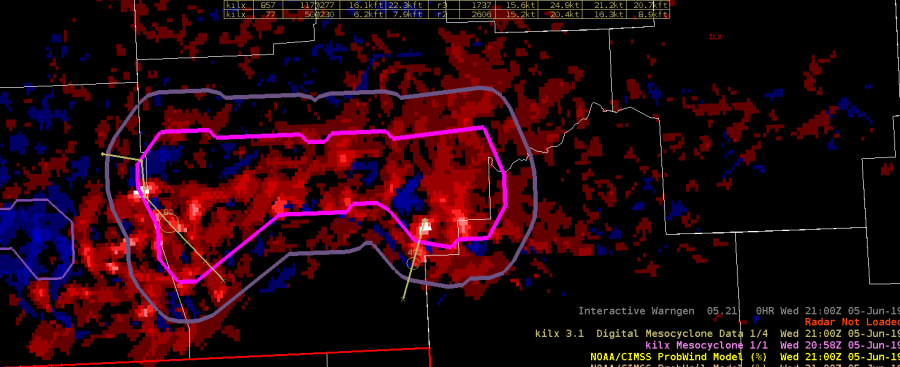
Earlier in the day was able to compare NMDA with the low level azshear. Tornadoes were’t a major threat, but the NMDA did line up with peak areas of Azshear. That storm did produce wind damage, and strong wind gusts.
Taylor Johnson.
Springfield Storms

We’re currently analyzing storms developing in the Springfield Missouri WFO.  Right now I’m using various tools to monitor if these storms will become severe.

Right now I’m using a combination of radar, GLM, nucaps, and the All sky products. Currently the most helpful tools on top of what I normally use are allsky and the lightning products.

The allsky cape helped to find CAPE gradients and an increase in CAPE. The northern batch of storms were pushing into an area of increasing CAPE and in return they did intensify.

While deciding whether or not to issue a warning I also looked at AFA GLM data to see if there were new flashes developing which can be indicative of growing convection. That flashes aligned with radar and increased my confidence that storms would intensify.

That lead to me issuing a severe thunderstorm warning. The prob severe data also ramped up. So I felt confident about my warning.

I also used NUCAPS sounding predictor to look at the cape during the rest of the afternoon.


While watching storms in the Springfield area I tried using  NMDA. Even after magnifying the product it was still a bit hard to see. I’m note sure if there’s a way to make the circle bigger or more pronounced. It can get busy on an active day.

As I continue to track storms I’m using Allsky CAPE to see what type of environment they are moving into. The CAPE does increase farther east so that makes me anticipate convection wane over the next few hours. I will though pay close attention to the storm farther north since they will move along the cape gradient.

I also used probsevere to increase my confidence in warning for a cell in pulaski county. The velocity ramped up as well as vil values.


The increase in probsevere over a few scans prompted me to issue a severe thunderstorm warning.

Taylor Johnson

AzShear Effectively Detects Anticyclonic Rotation

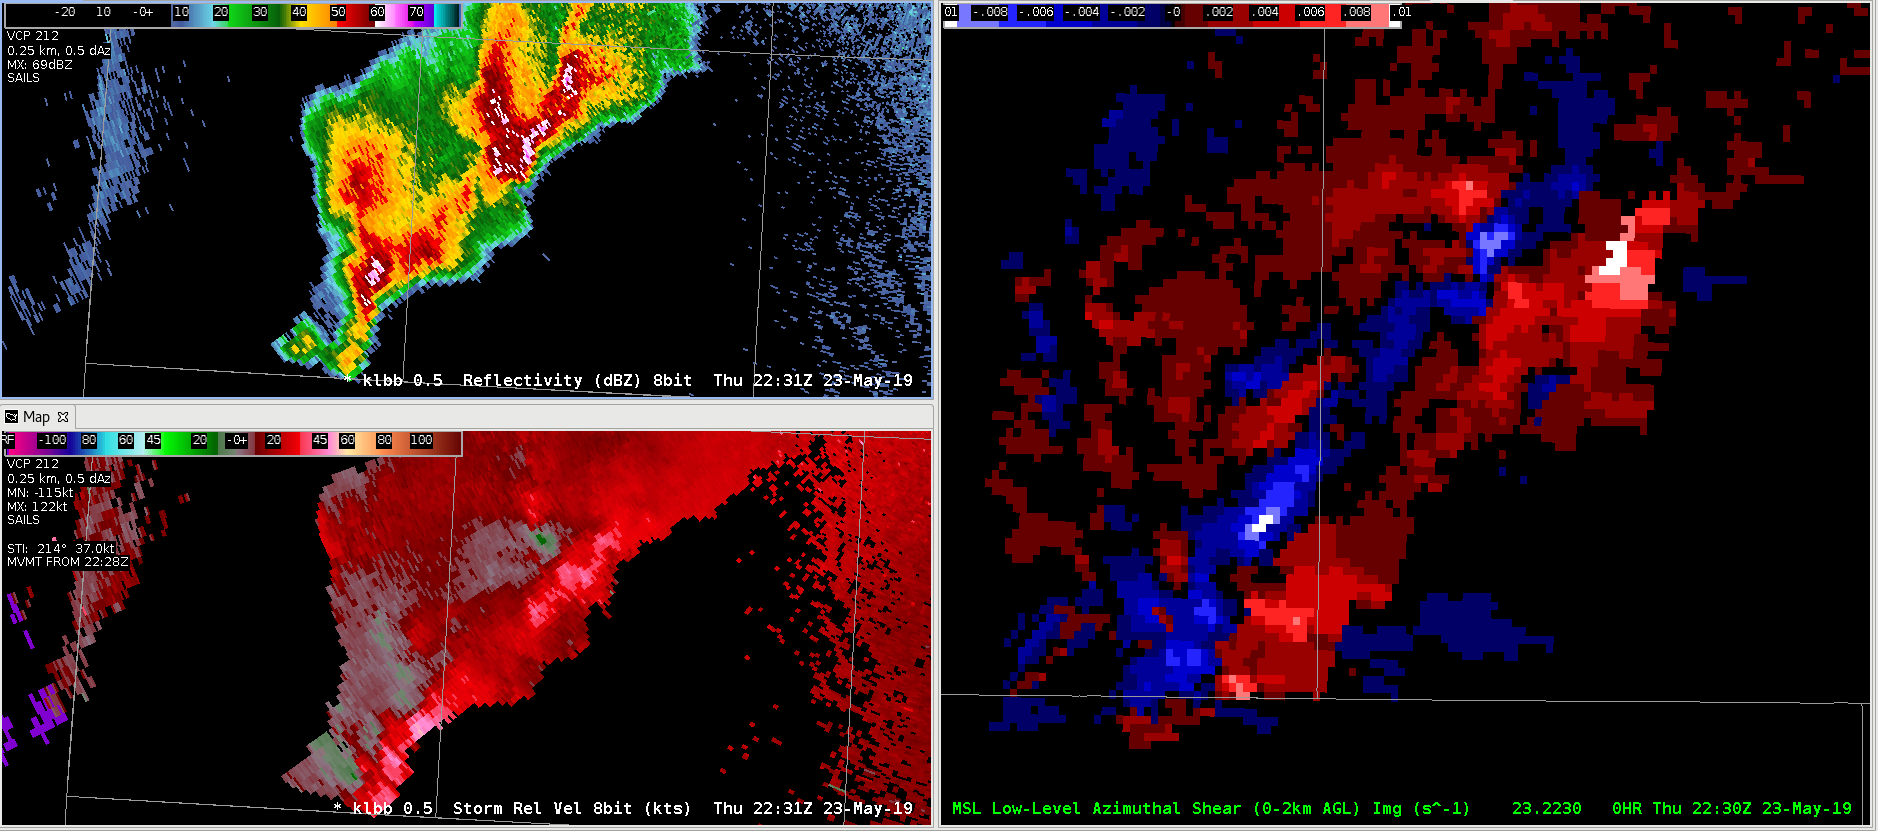
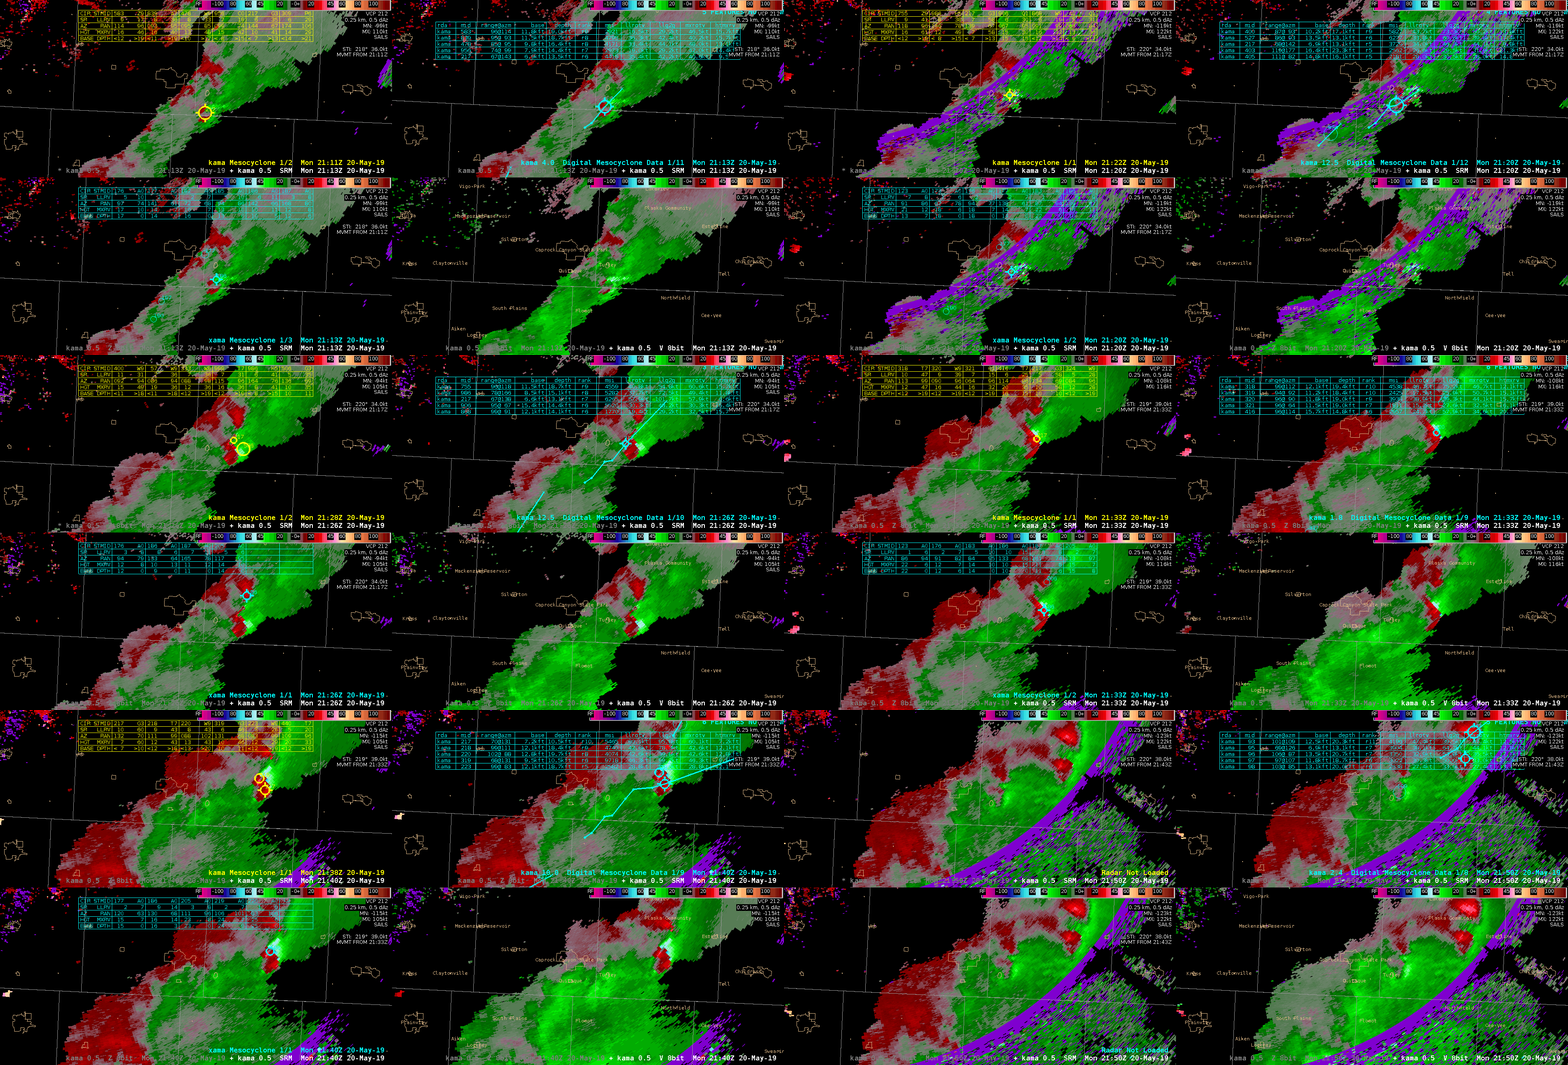
Two supercells southwest of Lubbock produced perplexing base radar signatures with a clear right-mover reflectivity signature but anticyclonic rotation evident in storm-relative velocity. To its credit, the MRMS AzShear product picked up on the anticyclonic circulation effectively and should be able to detect the rare anticyclonic tornado!

None of the mesocyclone detection algorithms picked up on the anticyclonic rotation. Perhaps this is part of their design. The New MDA tried to detect a mesocyclone southeast of the main anticyclonic circulation on the gradient of the strong outbound velocities, but it is incorrect.

-Atlanta Braves

Mesocyclone Detection Algorithms Performance on Marginal Supercell(s)

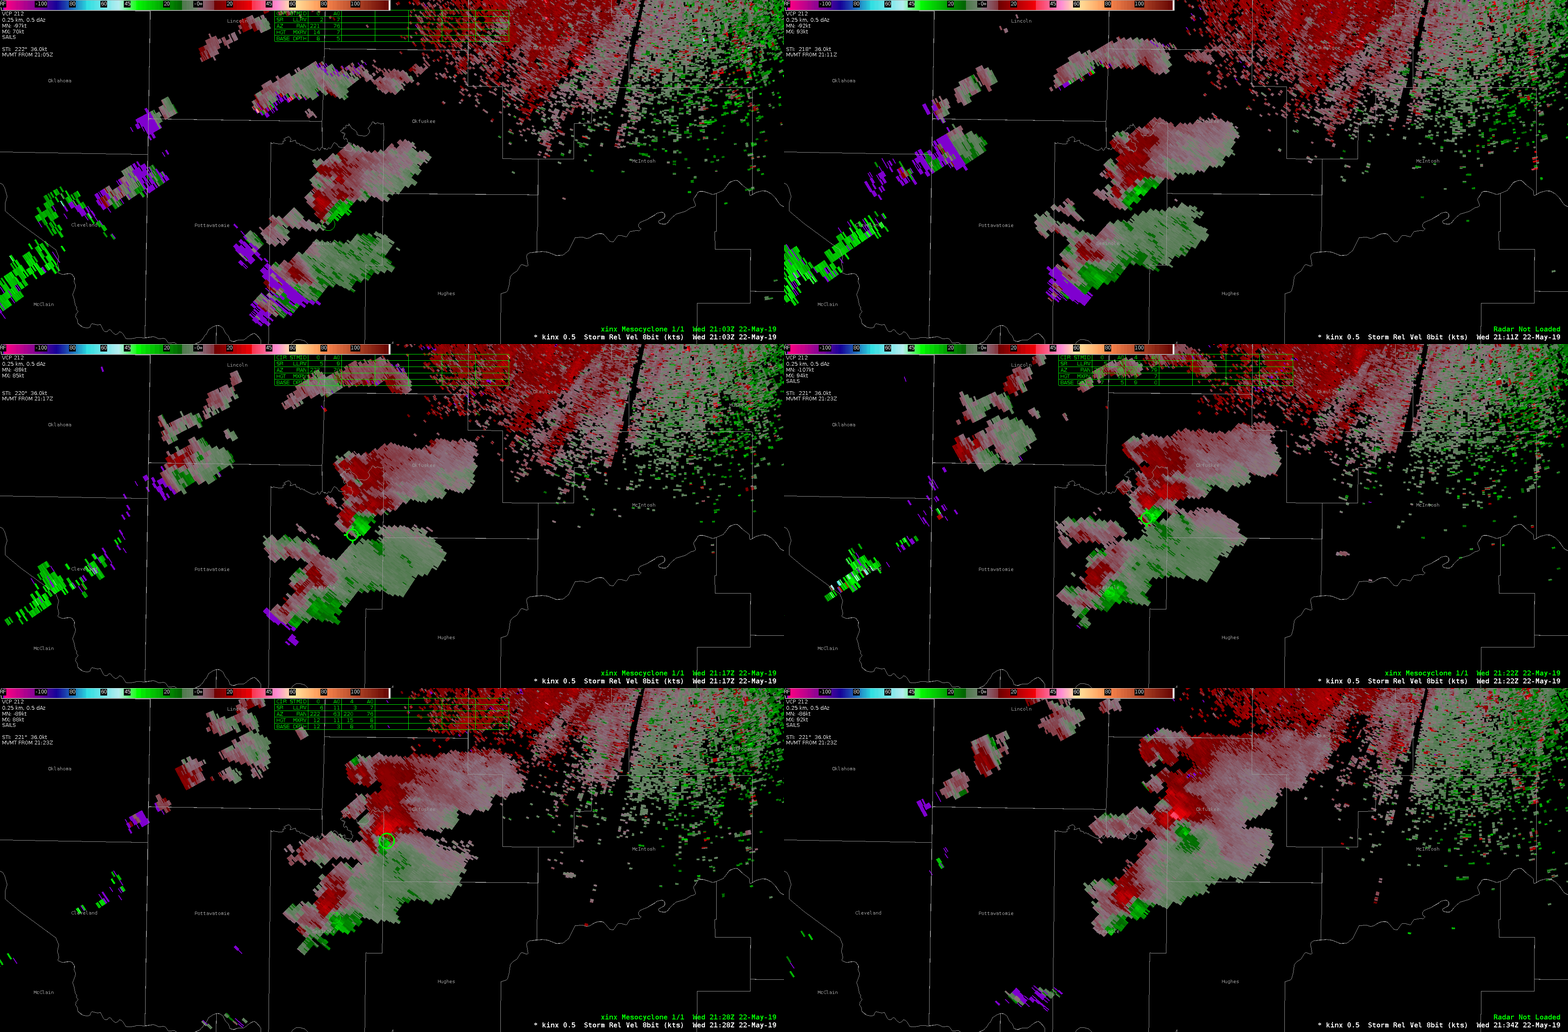
A cluster to 2 merged supercells traversed across northern Oklahoma this evening. The loop below shows the performance of all three mesocyclone detection algorithms.

The legacy MDA performed the most poorly of all 3 detecting several inaccurate mesocyclones with inconsistent tracking. The DMD performed remarkably well in both tracking and intensity on the main meso  The NMDA experienced occasional dropouts where data was unavailable, but also performed pretty well on this storm. It particularly detected intensity well through the lifecycle of the meso.  The AzShear product also tracked the main mesocyclone very well. The DMDA performed best of all three for this storm  but the NMDA also showed promise. -Atlanta Braves

Lowest-Level Rotational Velocity Product Comparison

I’ve been trying really hard to come up with some useful observations regarding the three mesoscale detection algorithms, but struggling to come up with anything insightful. A loop all 3 algorithms (MDA top left, DMD top right, NMDA bottom left) is below. The three algorithms are overlayed on SRM and the bottom right panel is base V.

Two persistent mesoscyclones in Hall county are largely well-detected by all 3 algorithms with only minor differences is tracking. A relevant limitation for this storm is range from the radar (>65 nm) and interference from range folding. The New Mesocyclone Detection Algorithm (NMDA) is limited in its latency, making its real-time applicability limited. I rarely use the mesoscale detection algorithms operationally because I find the table difficult to read. It is easier for me to interrogate the radar data than to use the MDA or DMD. Perhaps reformatting the data display would help make the NMDA more usable.

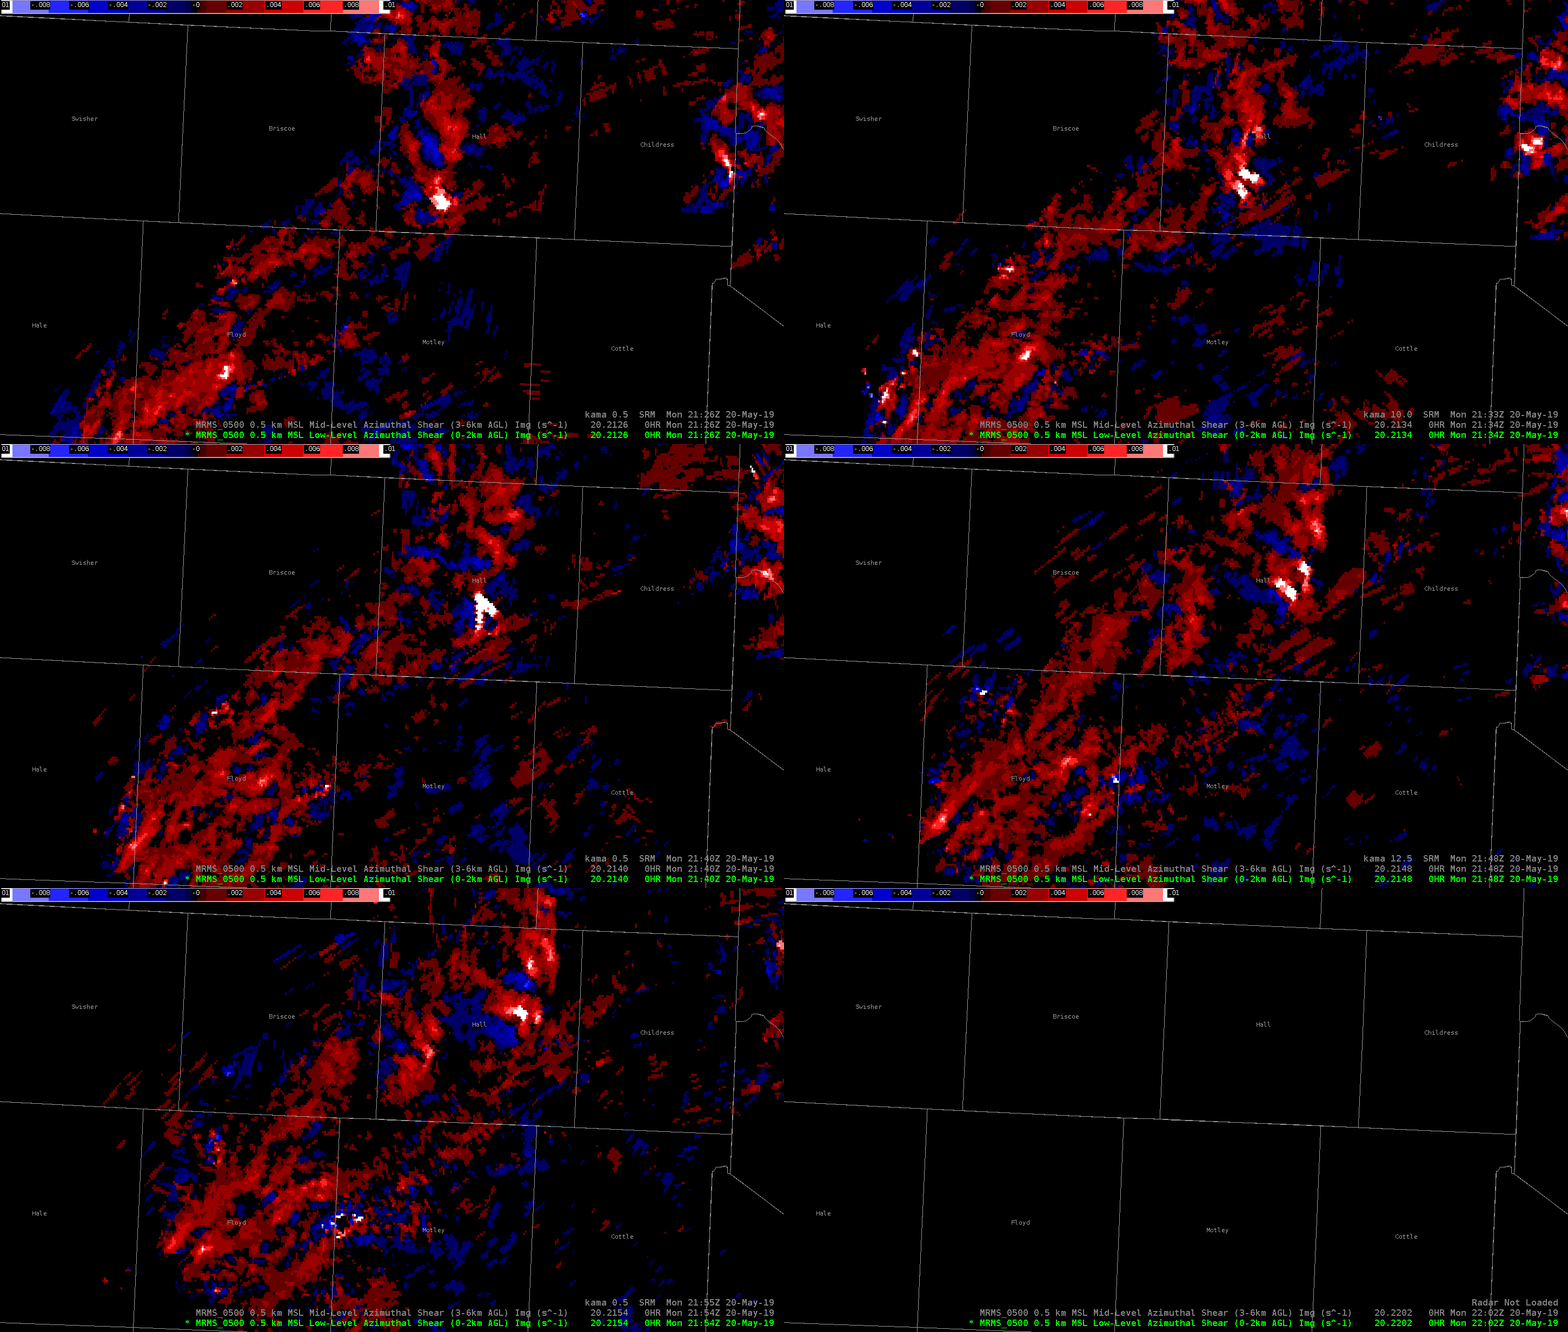
On the contrary, the AzShear product performed remarkably well on this particular cell. It is more visually obvious and helps focus forecaster attention in a very simple way. The loop is below:

For the purpose of identifying low-level rotation, AzShear does a much better job than any of the mesocyclone detection algorithms with respect to low-level rotational velocity. The mesocyclone detection algorithms do not add much value to my warning decision process. -Atlanta Braves

Bad Velocity Data Trips Alogrithms

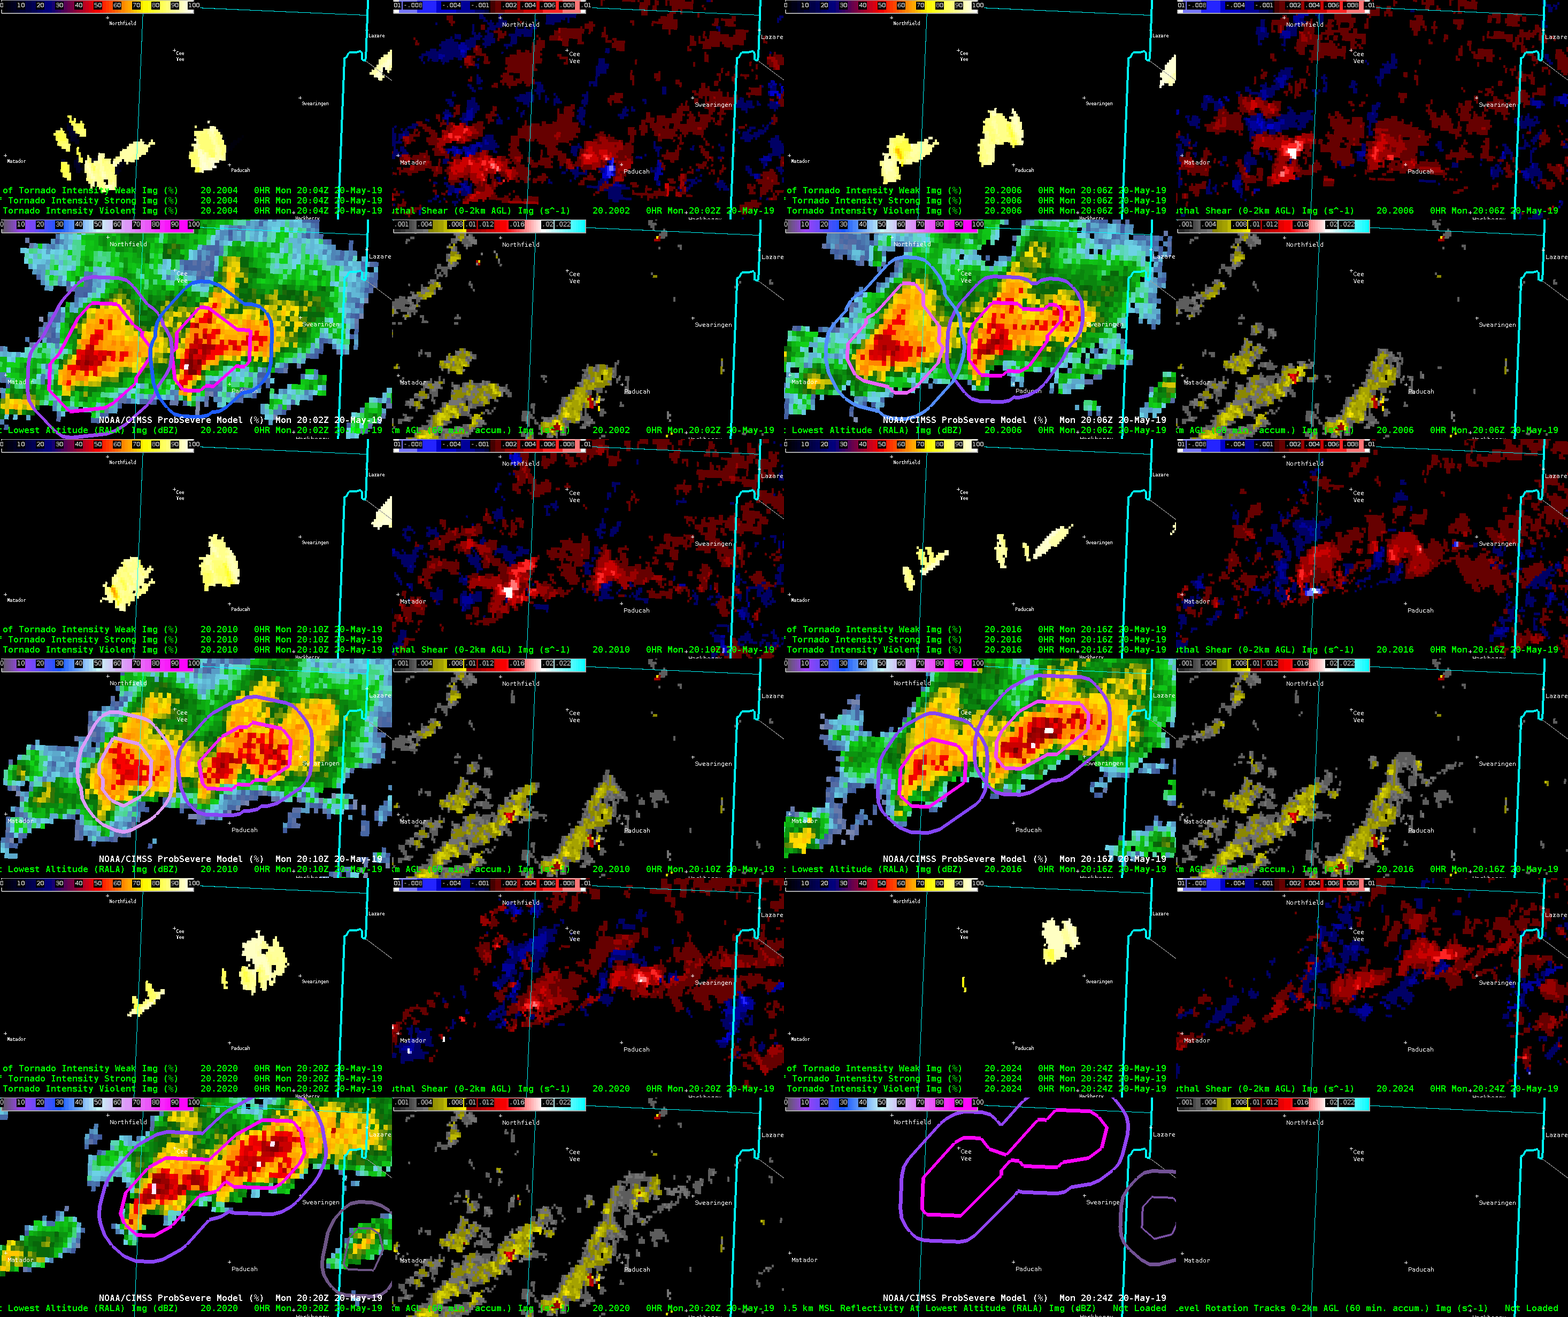
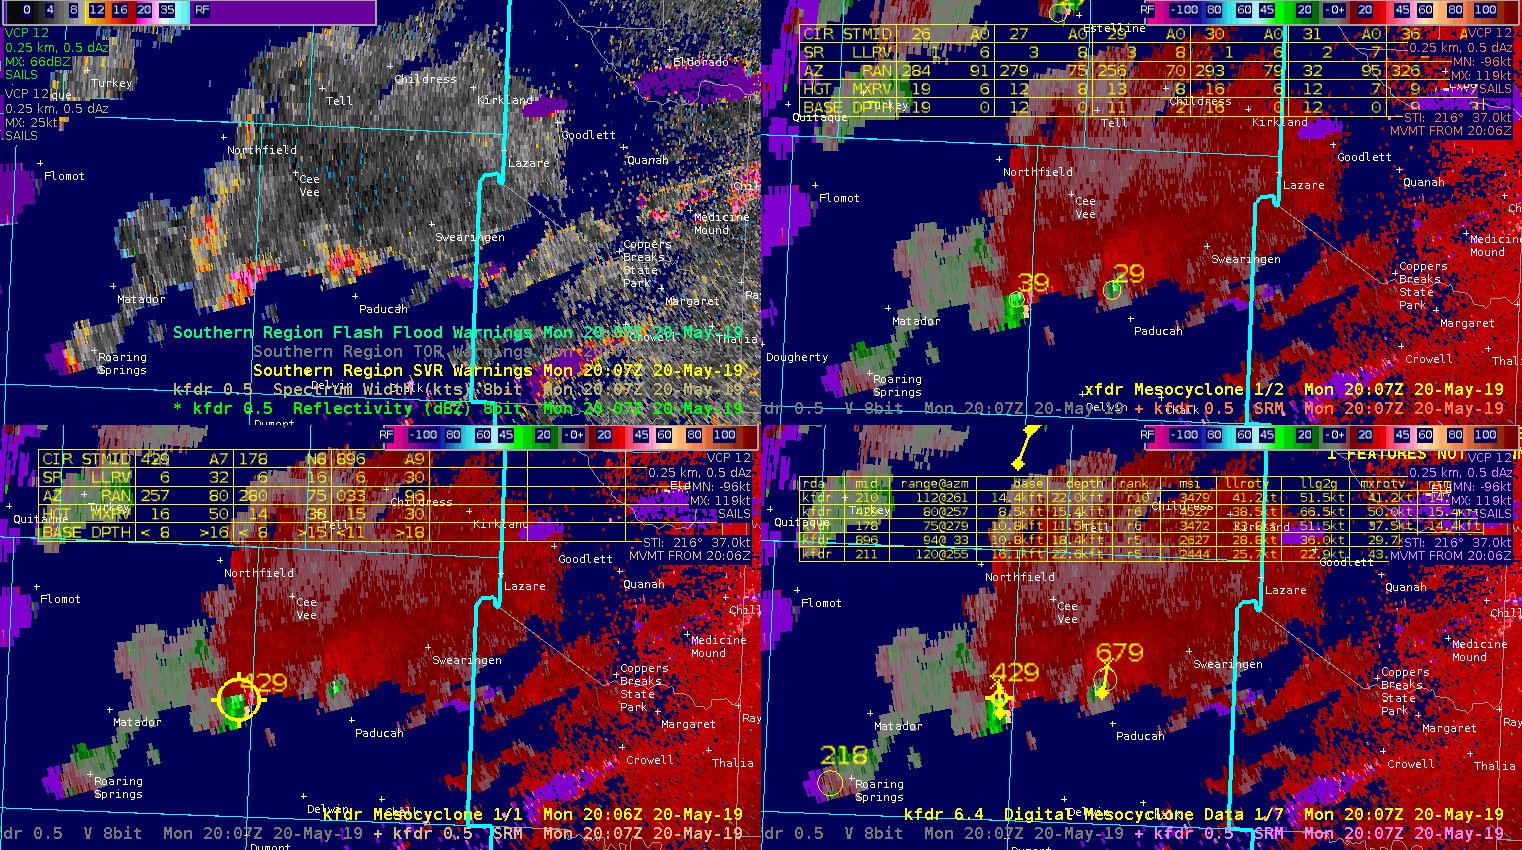
Just after 20z on the eastern fringe of the LUB CWA, the KFDR radar indicated an area of very high inbound velocity. However, this data is in question as the elevated velocity occurred in an area of low Z and high SW, and likely not representative of the actual storm. This may have been caused by a side lobe. This had cascading affects with algorithms being tested which could not filter out the bad data. Low level az shear spiked to over 0.01 in a group of stationary pixels. This caused algorithms that ingest the az shear product to spike including ProbTor which increased to over 90%, as well as CPTI which showed lower end probabilities of a violent tornado in progress.
Dave Grohl

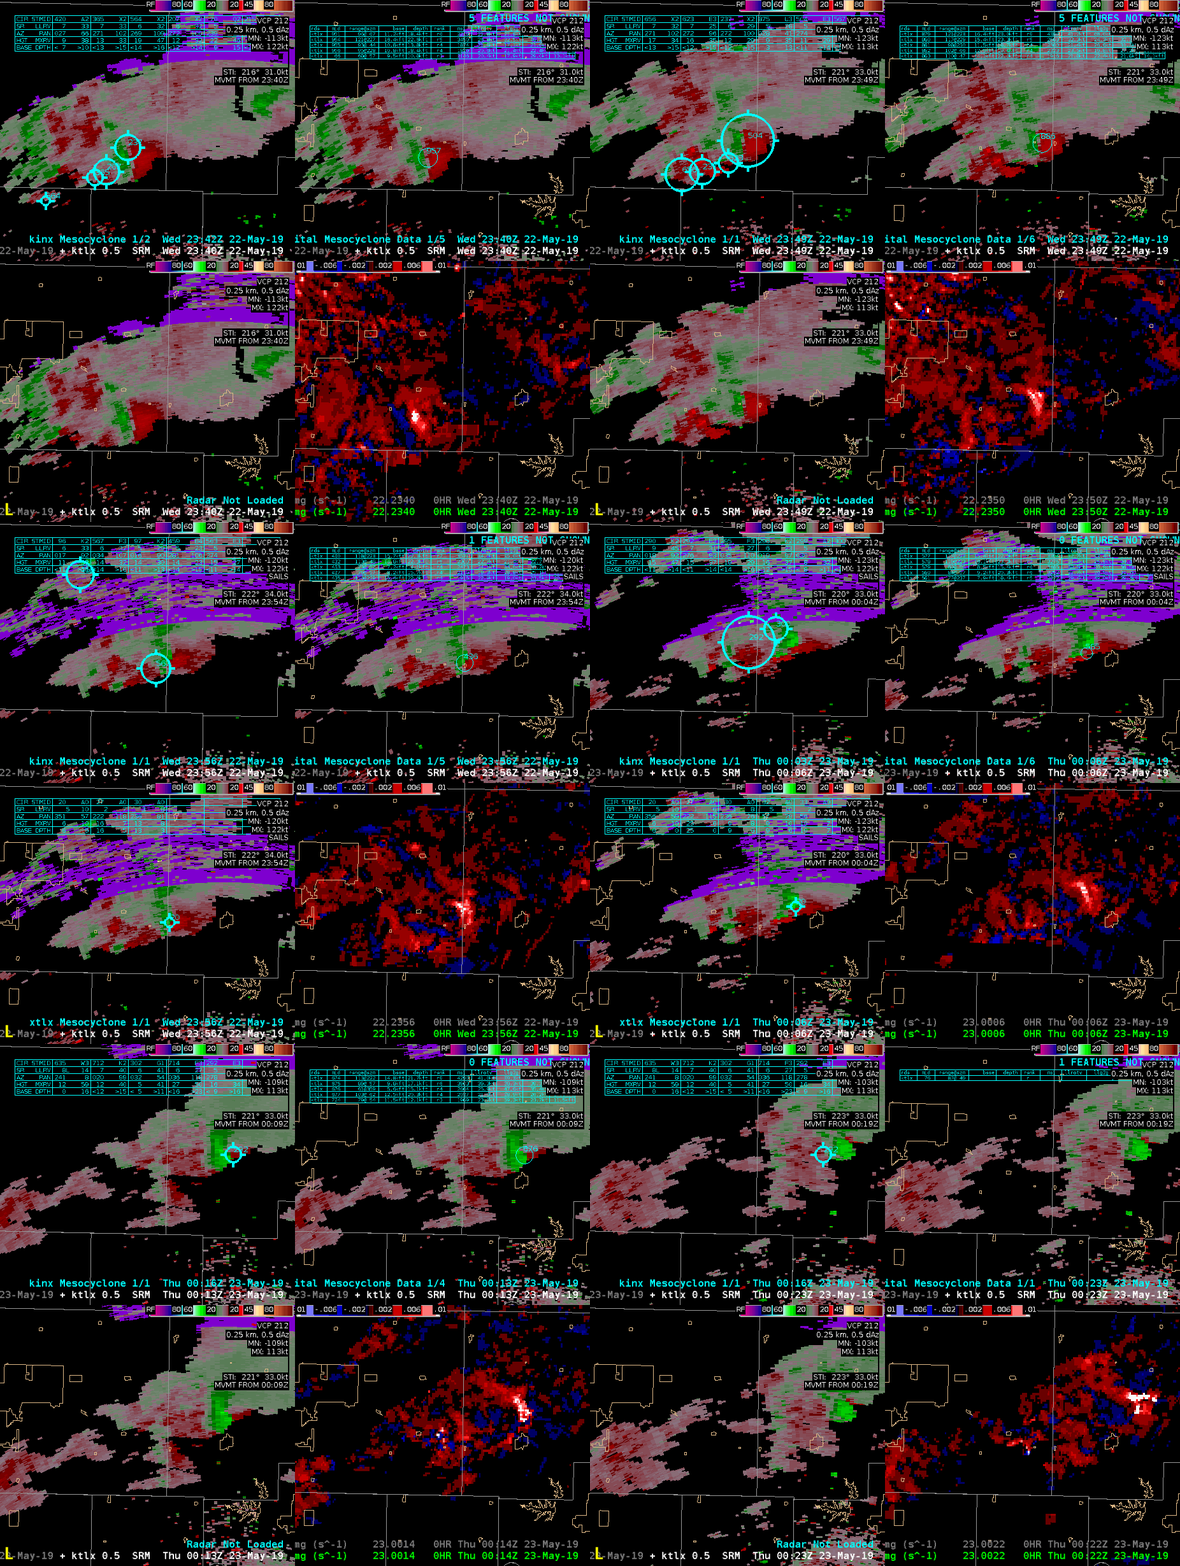
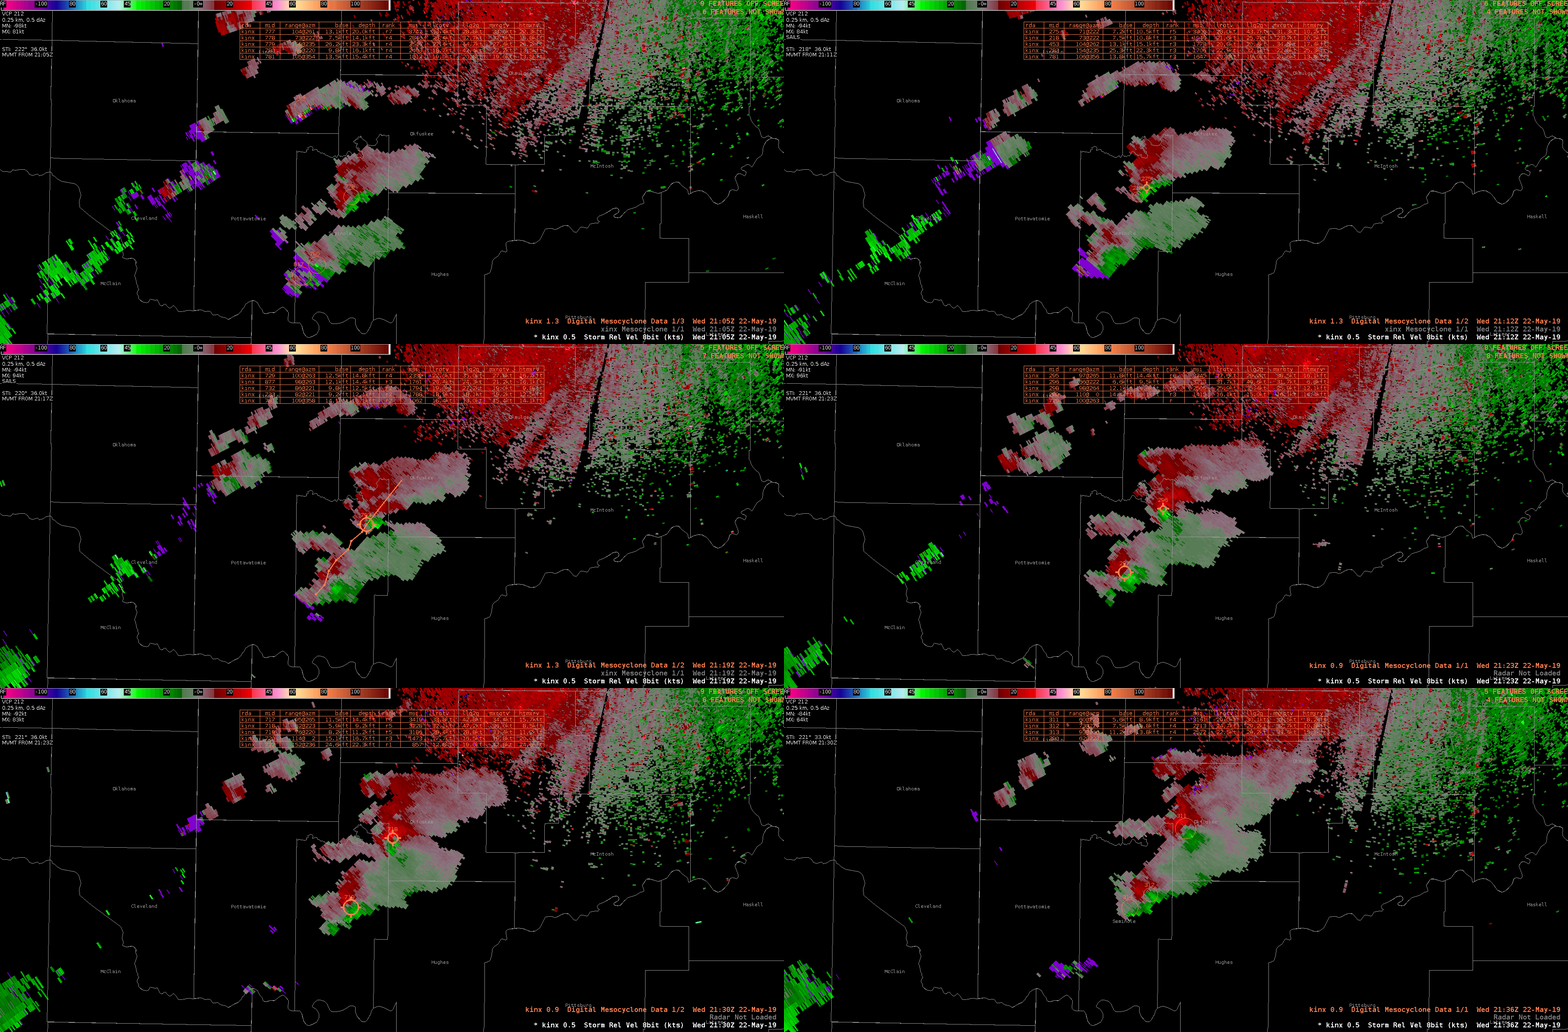
NMDA sensitivity issues. No anticyclonic detection either.

This will be a great case study to follow up on with the NMDA:

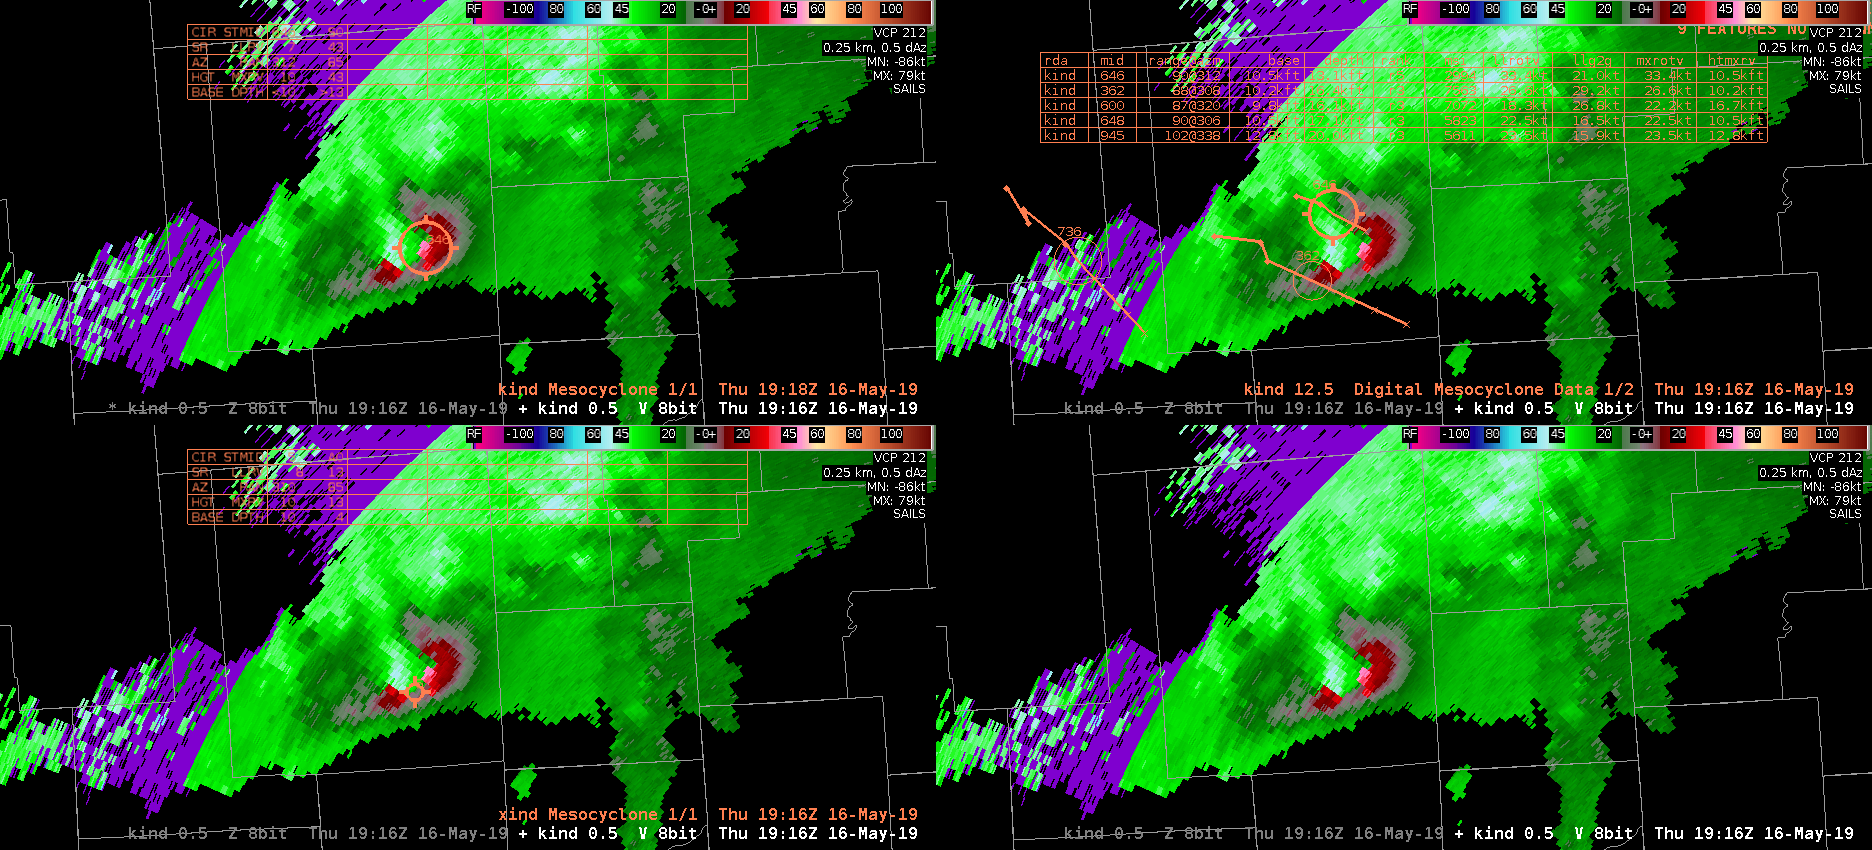
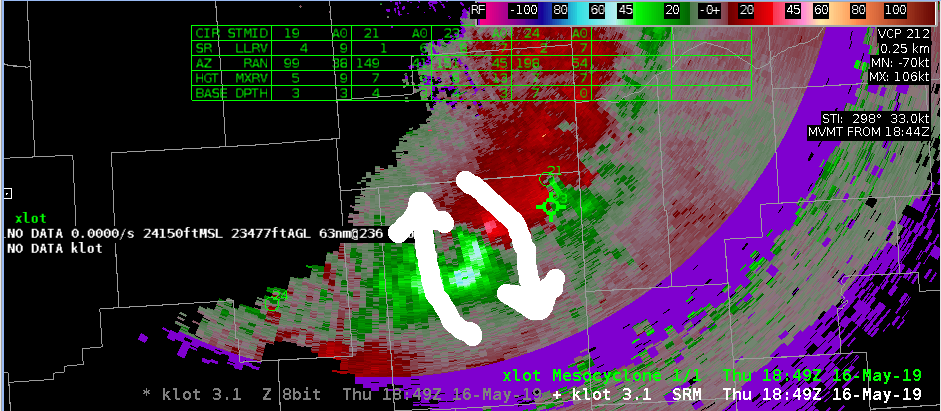
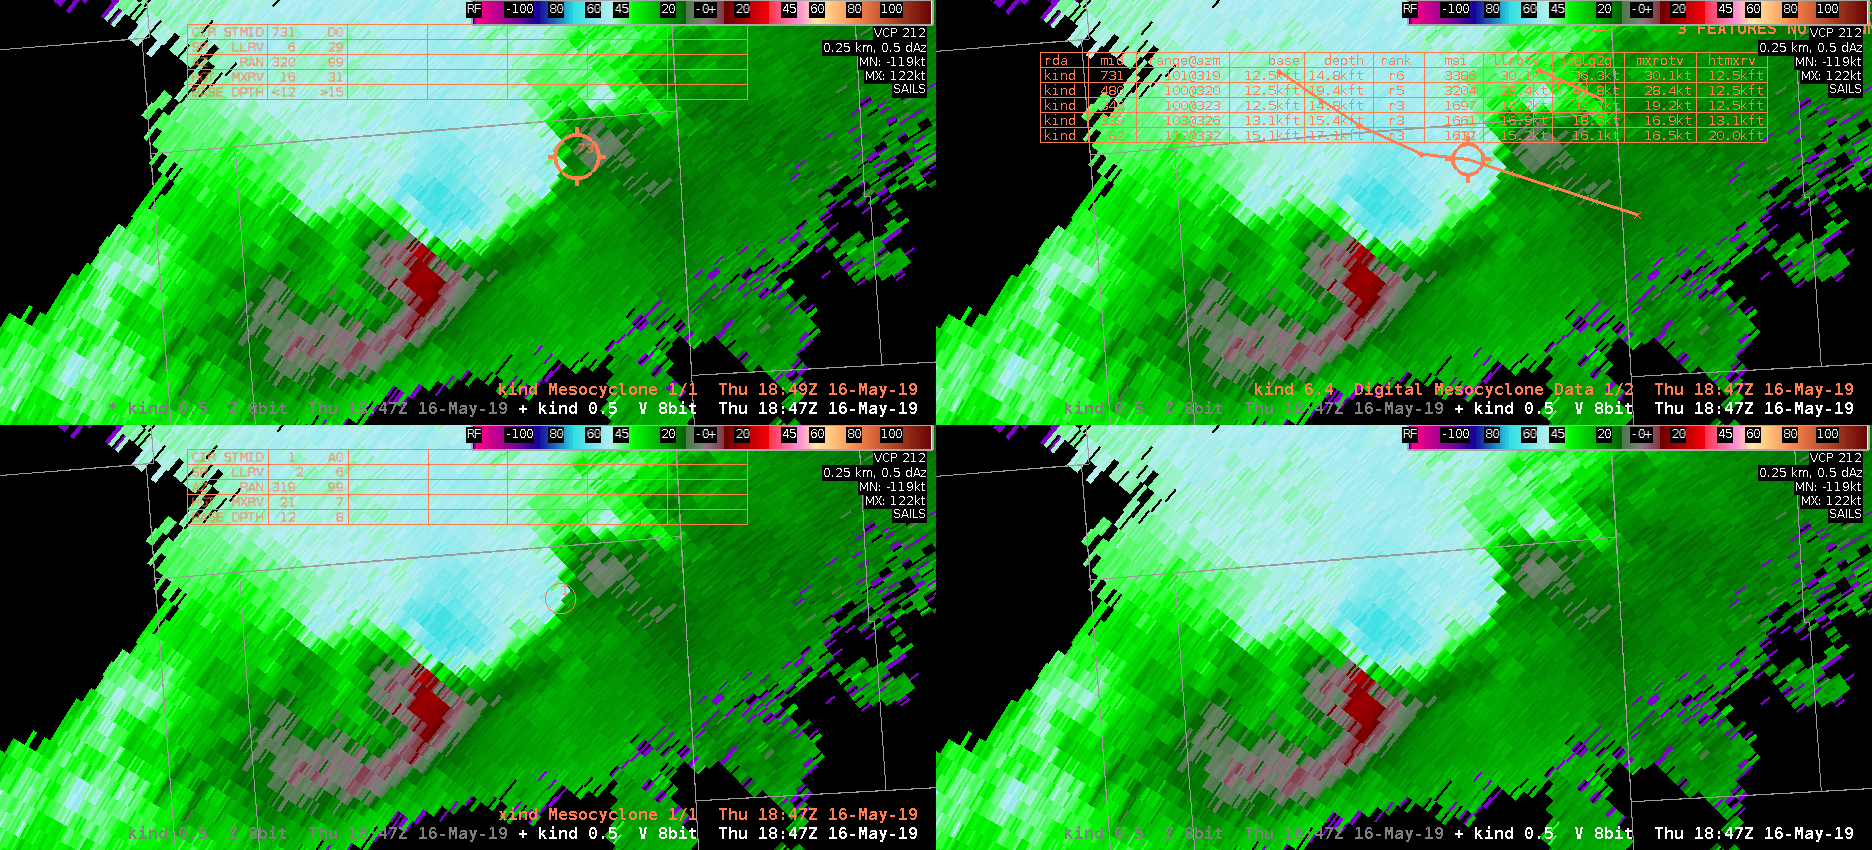
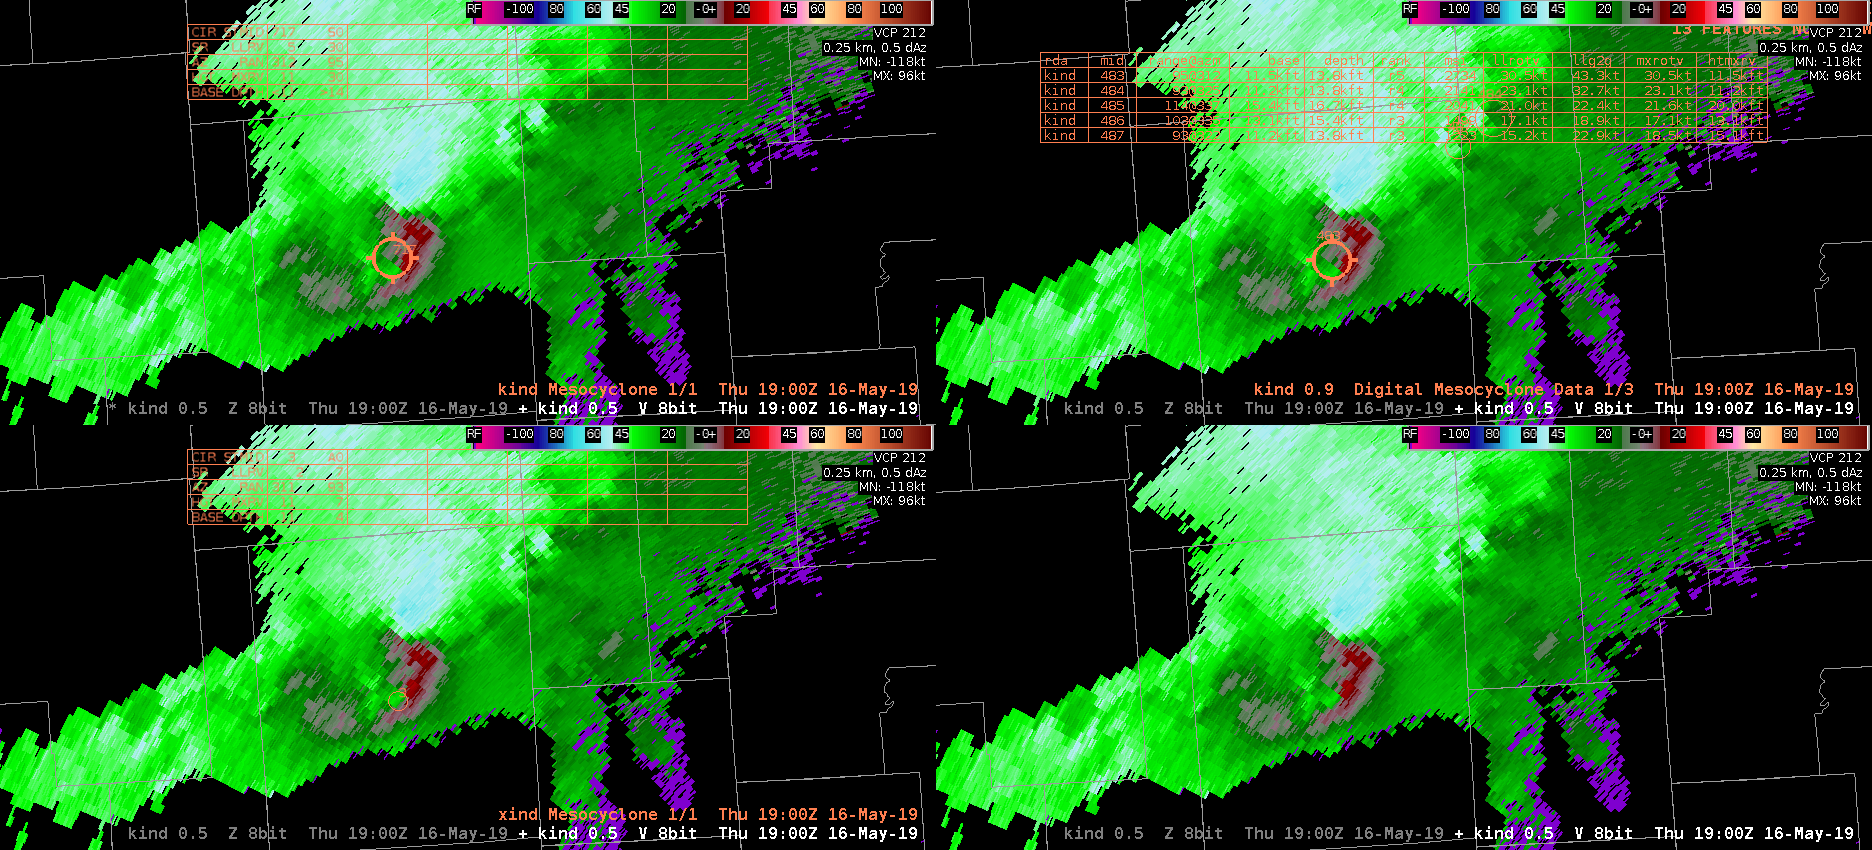
As we were watching the differences between the NMDA compared to the MDA and DMD on a QLCS/squall event over east-central Illinois/northwest Indiana, we noticed some differences in circulation detection. Particularly, it was noted that the detection sensitivity was poor when there was a strong anticyclonic circulation present aloft (KIND ~100nm southeast of storm; 0.5deg; 12kft AGL). Interestingly, all 3 of the algorithms picked up on the weaker cyclonic circulation instead; all with different sizes and intensities.

See below 1847Z: MDA upper left, DMD upper right, NMDA lower left.

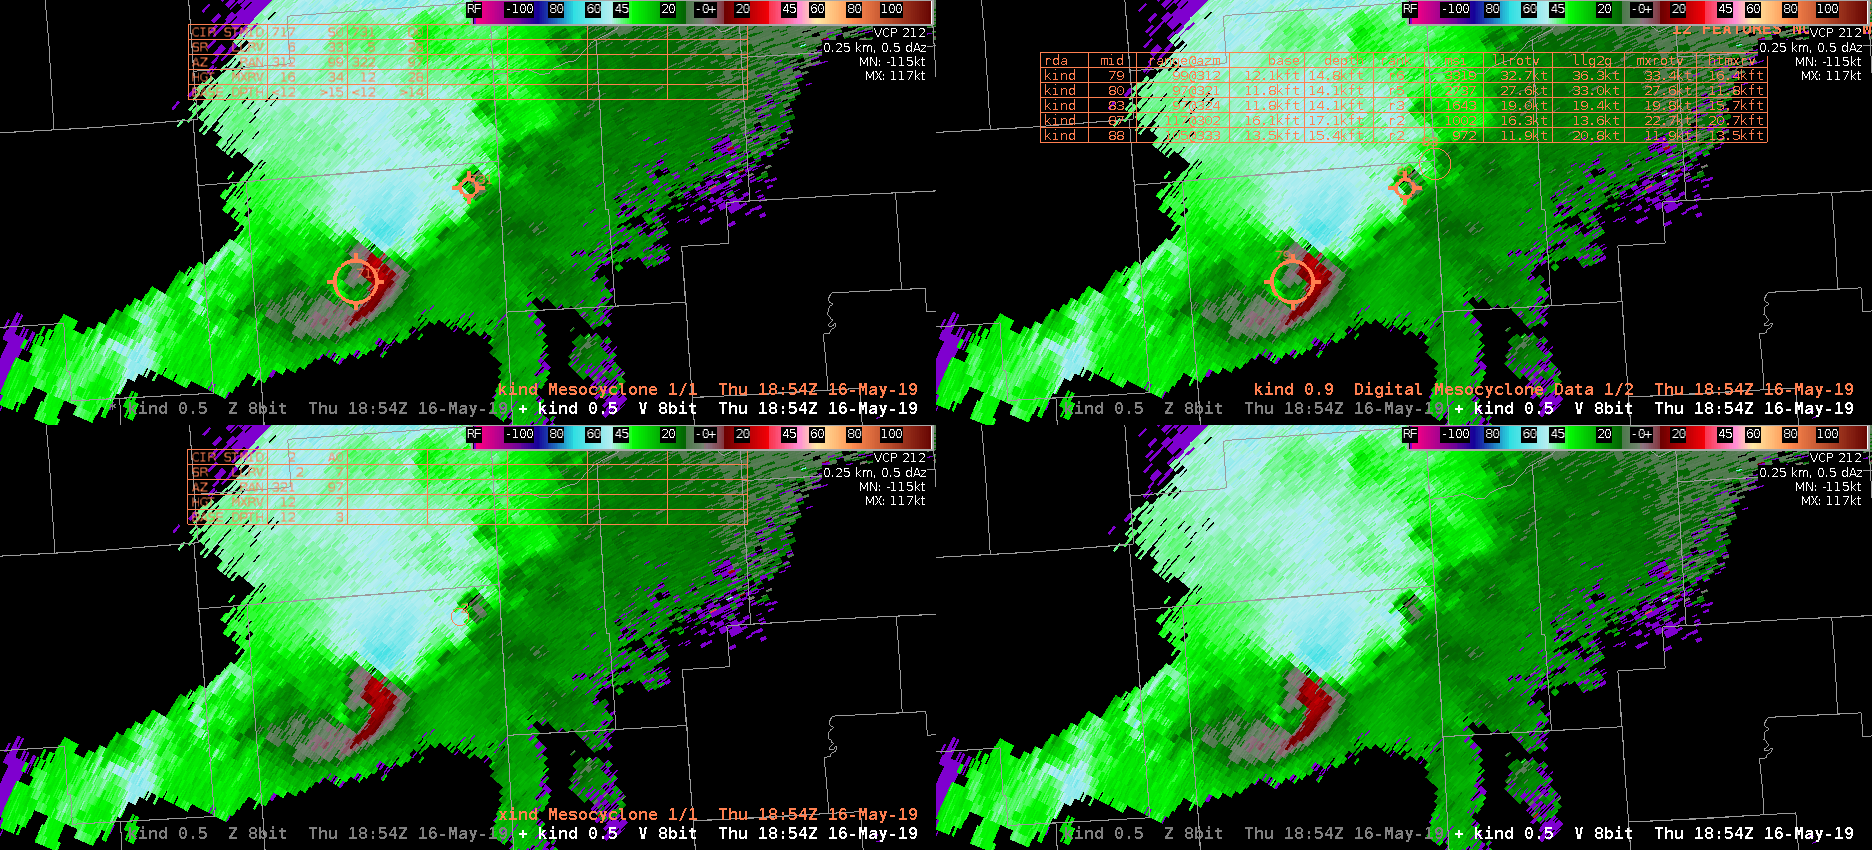
Image below 1854Z: As the storm progressed and started having a cyclonic rotation associated with the area of interest right next to an anticylconic area of rotation, the MDA (upper left), DMD (upper right), picked up that particular circulation first. The NMDA (lower left) was still slow to grasp onto this very strong circulation aloft that could have a Severe lead time significance as the rear inflow and convergence strengthens.

Looking several radar scans forward now below (1900Z), the NMDA finally recognizes significance of this large feature (see below; lower left panel). However, it is still does not signify a strong circulation as denoted by its tiny circle. I’m curious about LSRs during this time.

Finally, 16 min later (1916Z see below; 11kft AGL), the NMDA finally shows a significant circulation center due to a strong descending rear inflow jet/notch. I would suggest that the NMDA does not give me a lot of lead time confidence in issuing a severe thunderstorm warning in this instance (probwind showing over 90% at this time). NMDA only seems to help give confidence once it detects the feature after it has already evolved. What’s also interesting to note from the below image is that the DMD and MDA picked their denotations on (only) the cyclonic circulation, whereas the NMDA only seems to centrally focus on a weird convergence region and not the cylconic side of this lowest scan velocity data (i.e. more localized for NMDA). None of the products seem to attract to the anticyclonic side, which actually strengthens with time due to the descending notch. -shearluck

NMDA QLCS Anticyclonic Meso

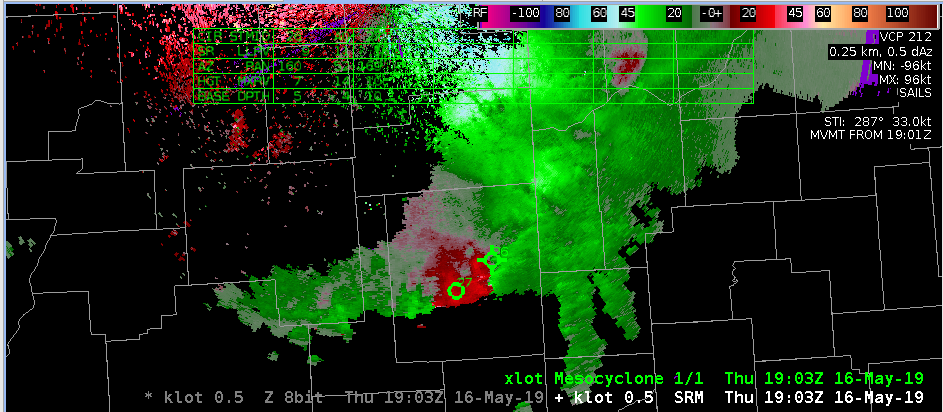
A strong anti-cyclonic mid-level meso developed near the southern end of a QLCS south of Chicago (view form KLOX). NMDA did not pick up on this feature. Would definitely want to have this detection since a warning forecaster may not quickly pick-up on a developing mid-level circulation if they are closely watching for low-level mesovortex spinups, and this may be important in hail development as well as focusing and outflow wind surge.

11 minutes later on the 0.5 degree tilt, one the developing rear inflow jet starts to develop, the NMDA keys in the developing low-level cyclonic circulation. However, the additional 11 minutes of being alerted to the developing mid-level meso could help extend warning lead times.

— warmbias —