Springfield Illinois Storms

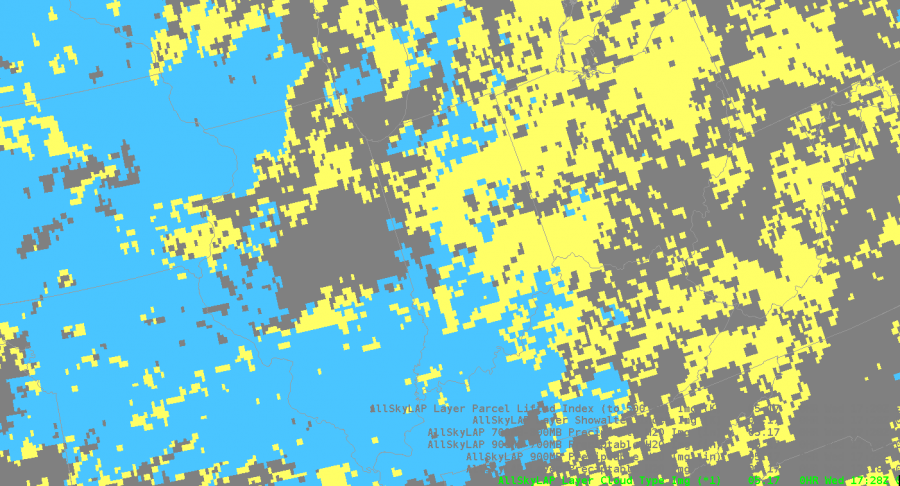
Right now I’m analyzing the various new products to nowcast where and when storms will intensify. Currently I’m comparing ALLsky cape to the mesoanalysis from the spc. Right now the mesoanalysis is higher with cape compared to allsky. Over our area the it’s cloudy so the it’s taking data from the GFS.

A cell in our western counties ramped up very quickly while our computers were down. Prob severe immediately directed our eye to the cell. The probsevere linedĀ  up with an uptick in vil values and velocity.
I’m comparing the actual sounding to what’s shown on nucaps, and allsky to see what’s initializing the best. The actual sounding shows 3025kj of surface lavyer cape and 1453 of mixed layer.
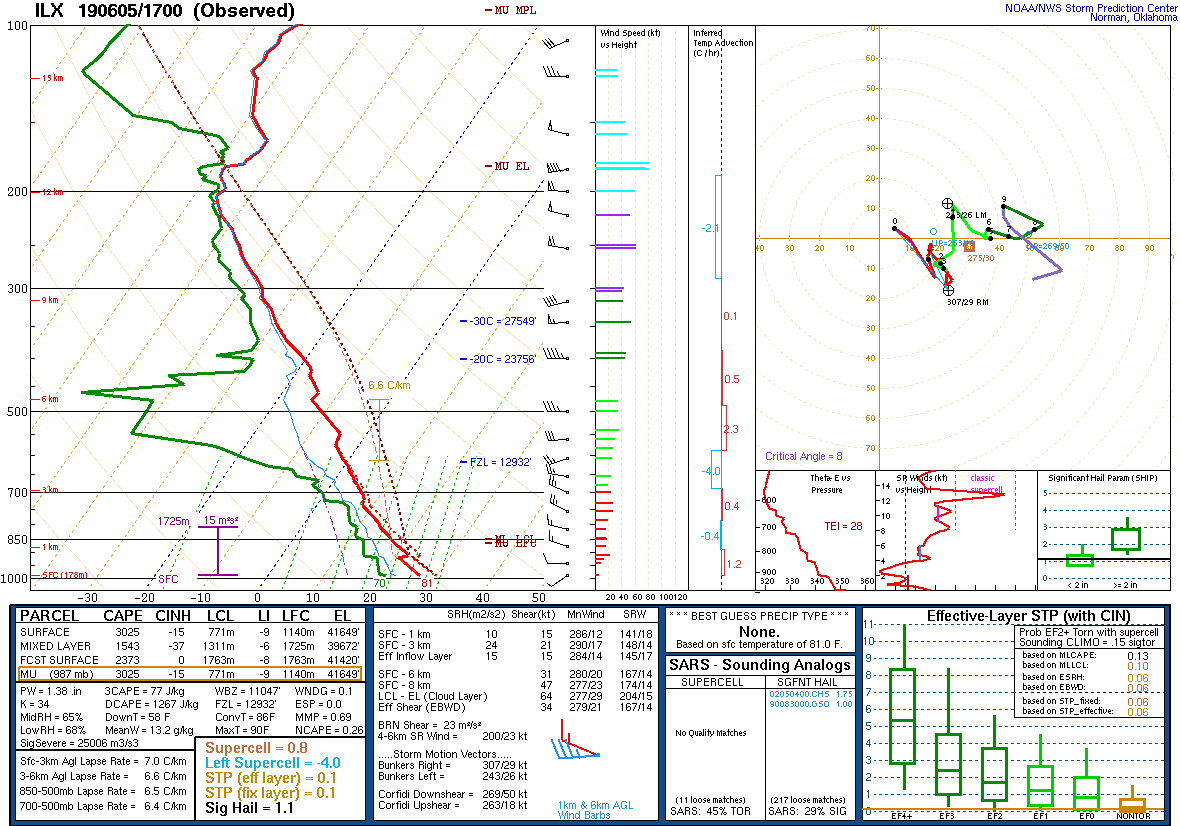
Around the same time allsky shows a similar value of cape.

The modified sounding was closest to the actual sounding with 1515kj of mixed layer cape
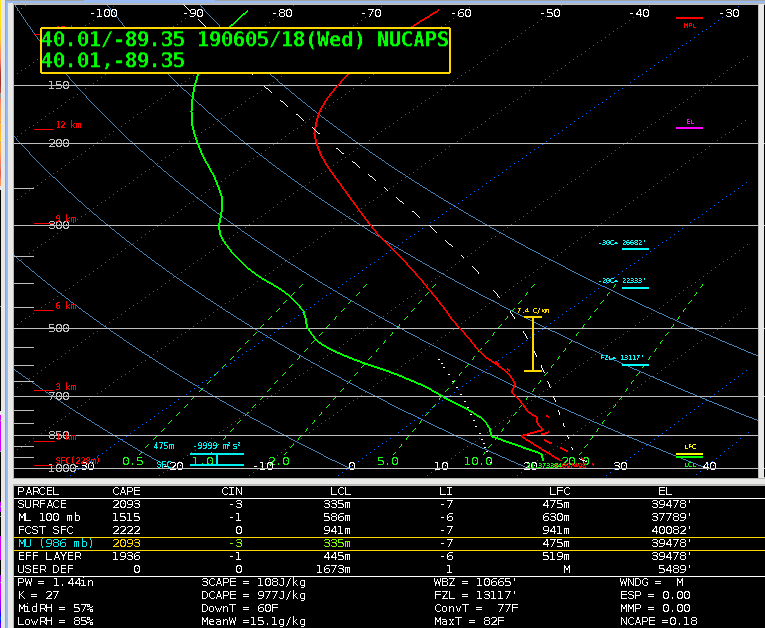
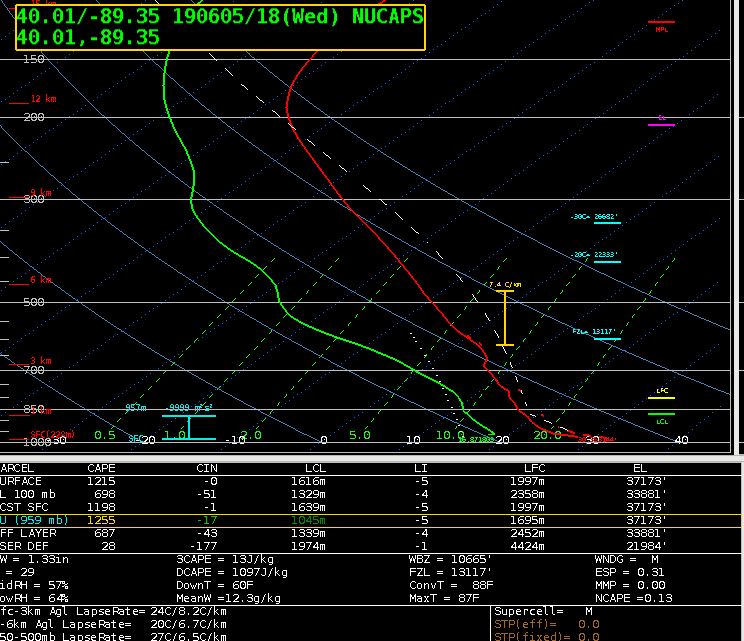
The nonmodified sounding is much lower when it comes to mixed layer and surface cape. In the case the modified sounding was more reliable and gave a more accurate picture of the current state of the atmosphere.
The all sky cape was much higher, around 2300kj.
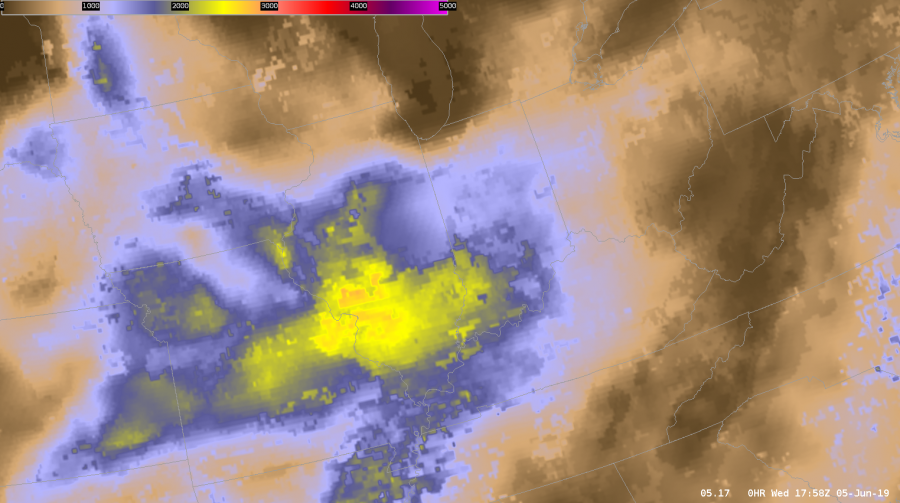
That increase might be due to the fact that the sampled area of interest was filled in by the GFS. Whatever input the GFS was taking into might have lead to it overestimating the amount of CAPE.
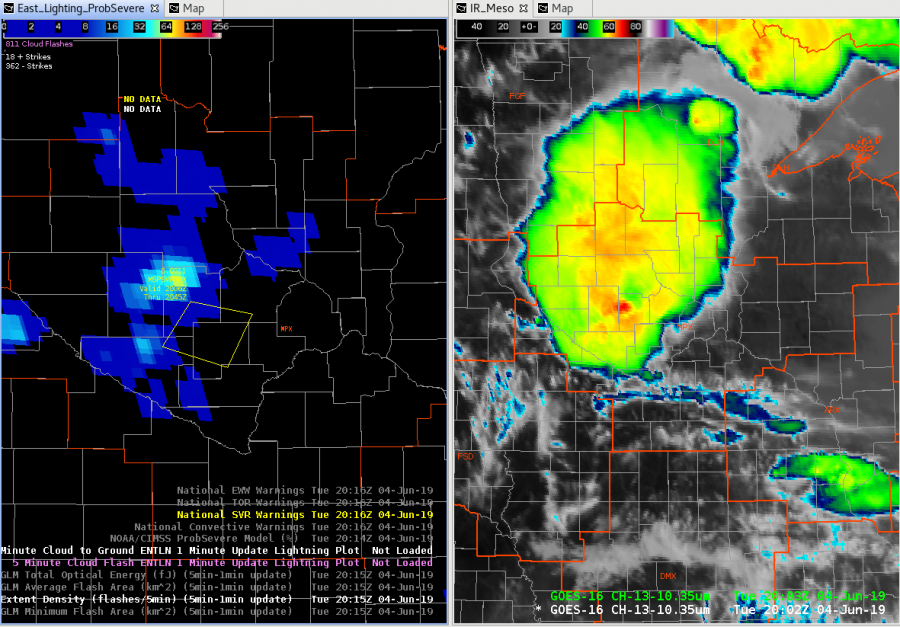
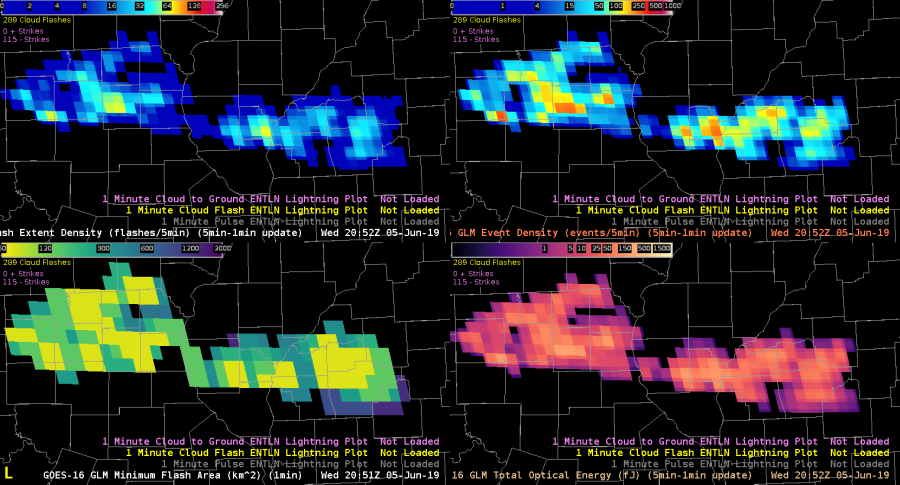
I’m also looking at GLM products to see trends with convection. The combination of event density and GLM minimum flash area help me to see the rapidly growing updrafts as well as cell that are producing hail. That’s the case right now. My warned cell is producing penny size hail.
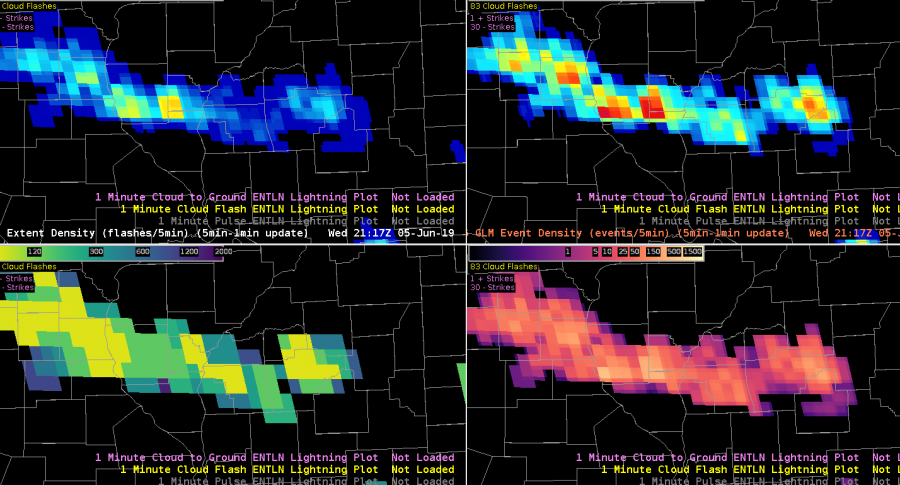
About an hour later the FED Is starting to pick up on longer flashes, but the event density is still showing higher values. The lines up with satellite which shows overshooting tops, but storms are overall keeping their intensity. The overall trend combined with looking at stability indices aids me in nowcasting that storms will at least maintain their strength over the next hour or so.
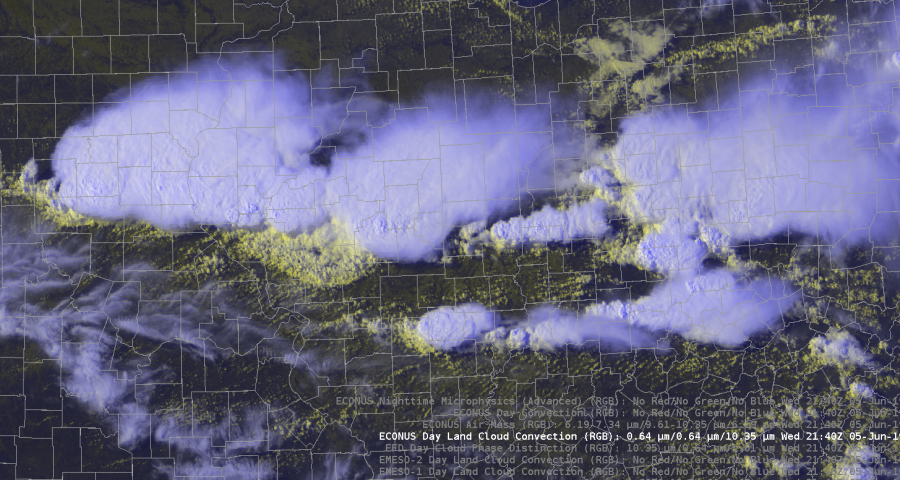
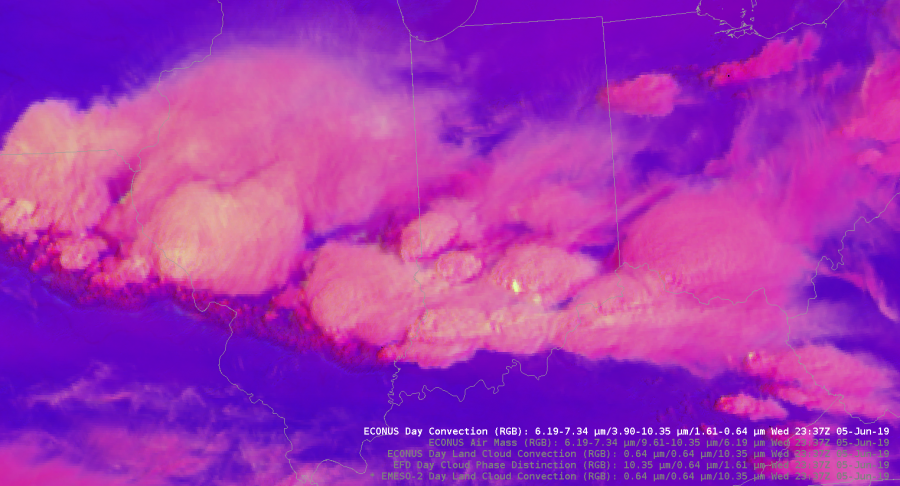
The Day Land Cloud convection RGB was helpful in analyzing different cloud tops. The color scale highlighted the thin cirrus compared to the lower thick clouds. It also dipicted the outflow boundary from our southern storms very well. It gives much more detail to the cloud types compared to the visible satellite.
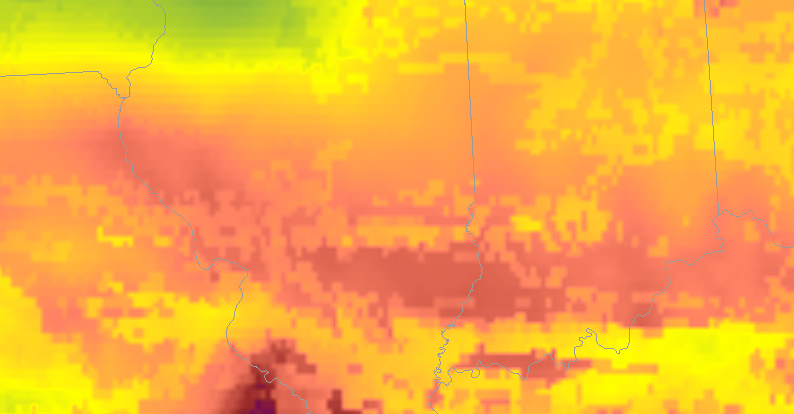
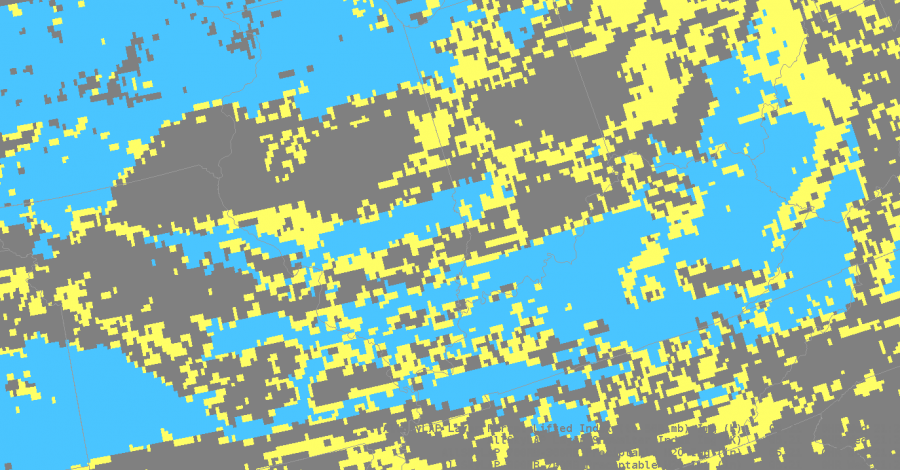
Today I also got the chance to analyze and compare the merged TPW precipital water with the allsky.

During the afternoon the PW values stayed fairly steady across the northern half of the state while moisture increased in southern Illinois.
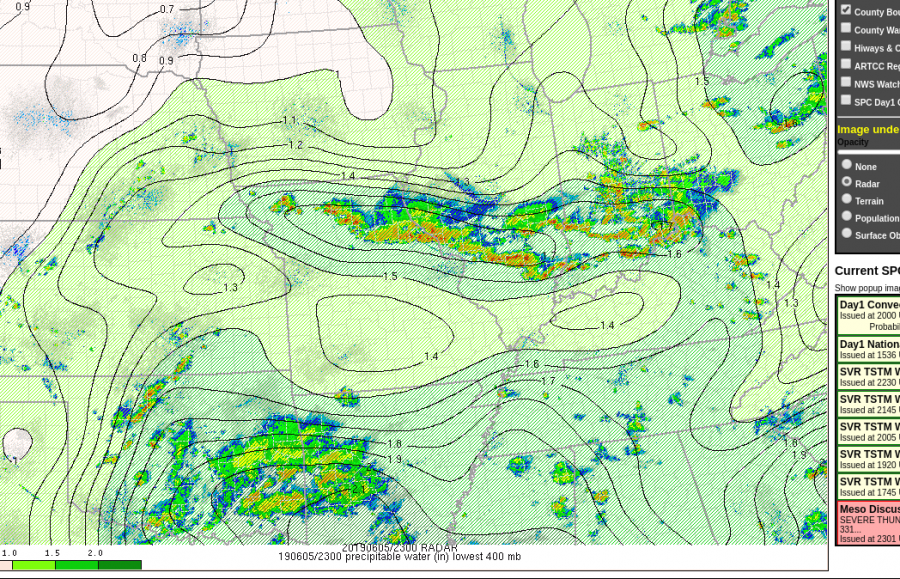
The TPW decreased PWATS to close to 1 inch as storms moved through. T
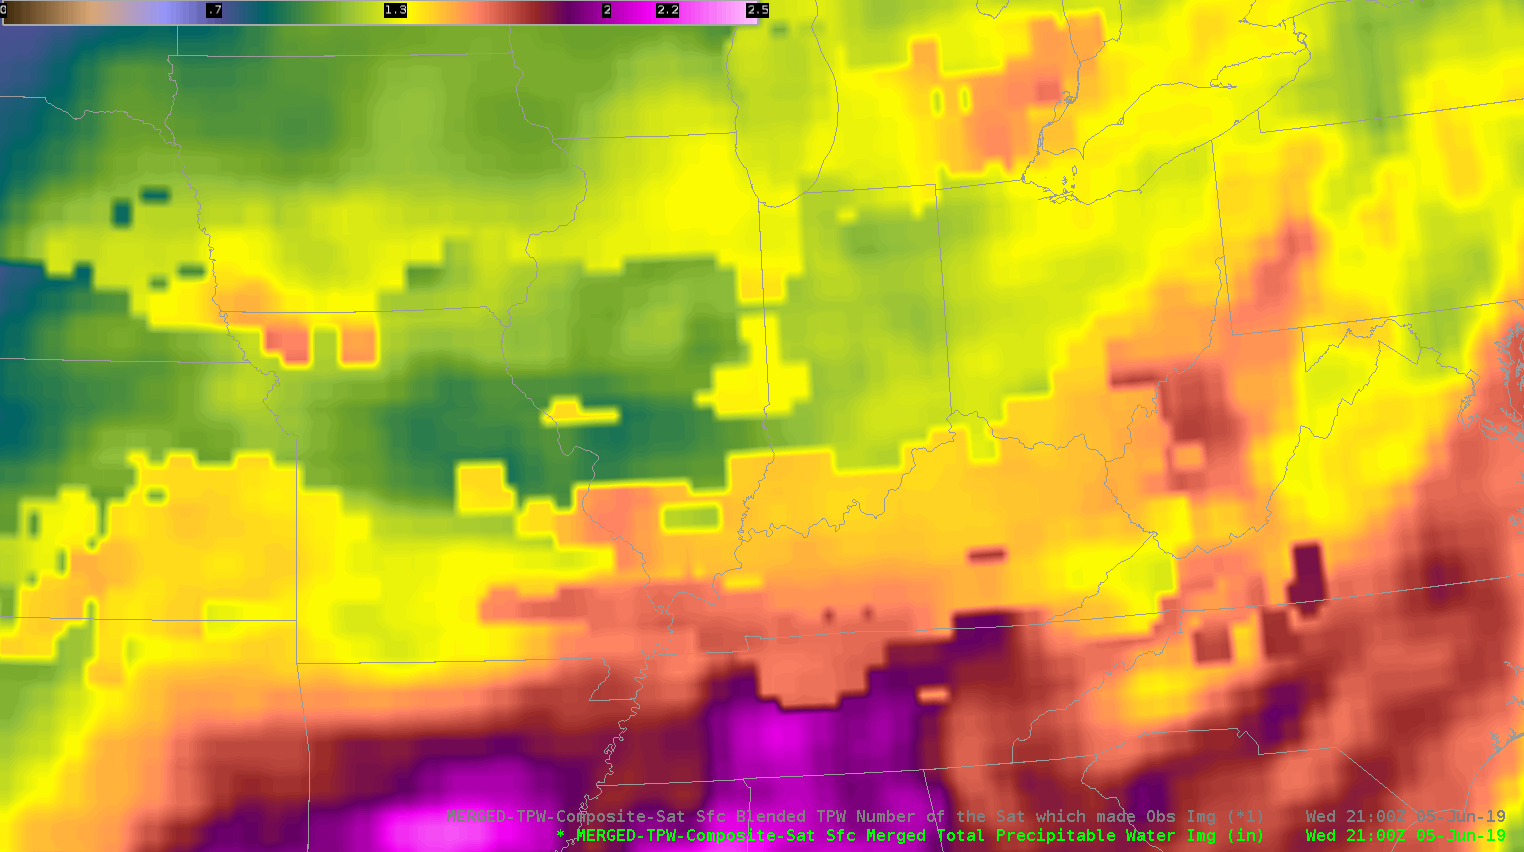
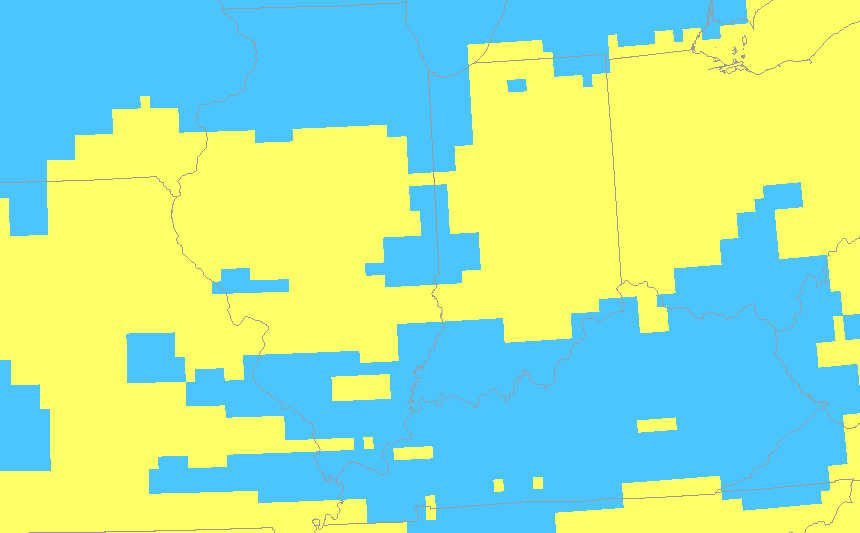
That data was sampled in a cloudy environment.
Meanwhile, the AllSky does show a decrease in PWATS but’s farther north compared to what actually happened. That data was pulled from the GFS since it was in a cloudy location. It was helpful to see how each product performed in this environment. It’s nice to have access to both in order to see which one has the best handle of the current atmosphere. That initialization helps me monitor trends and nowcast.
As storms moved south out of my DMA I used Day convection RGB just to monitor growing cells. It was clear to see the strongest storms because they had the bright yellow maxes.
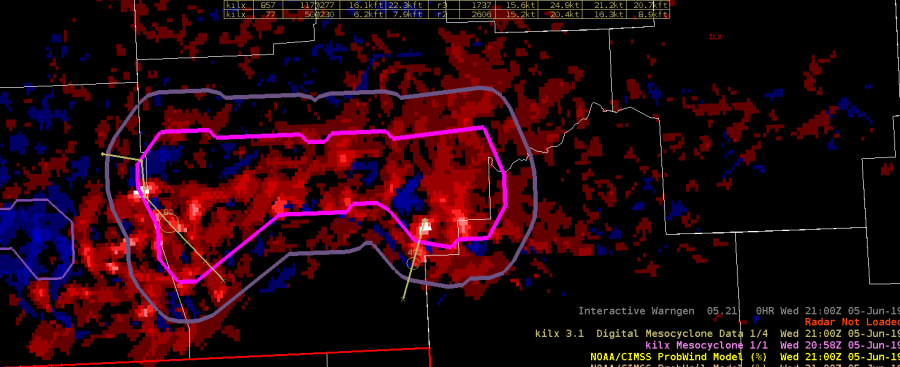
Earlier in the day was able to compare NMDA with the low level azshear. Tornadoes were’t a major threat, but the NMDA did line up with peak areas of Azshear. That storm did produce wind damage, and strong wind gusts.
Taylor Johnson.

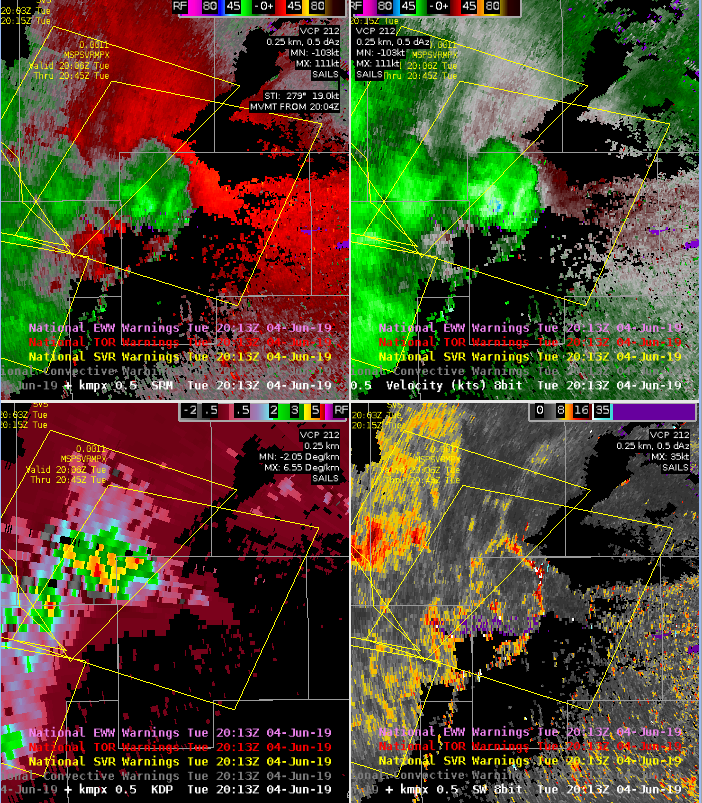
Perhaps tornadogenesis soon?

Lightning on FED starting to go up again, right as cell with rotation starts to meet up with east-west oriented boundary to the east of that cell (see bottom right spectrum width product).

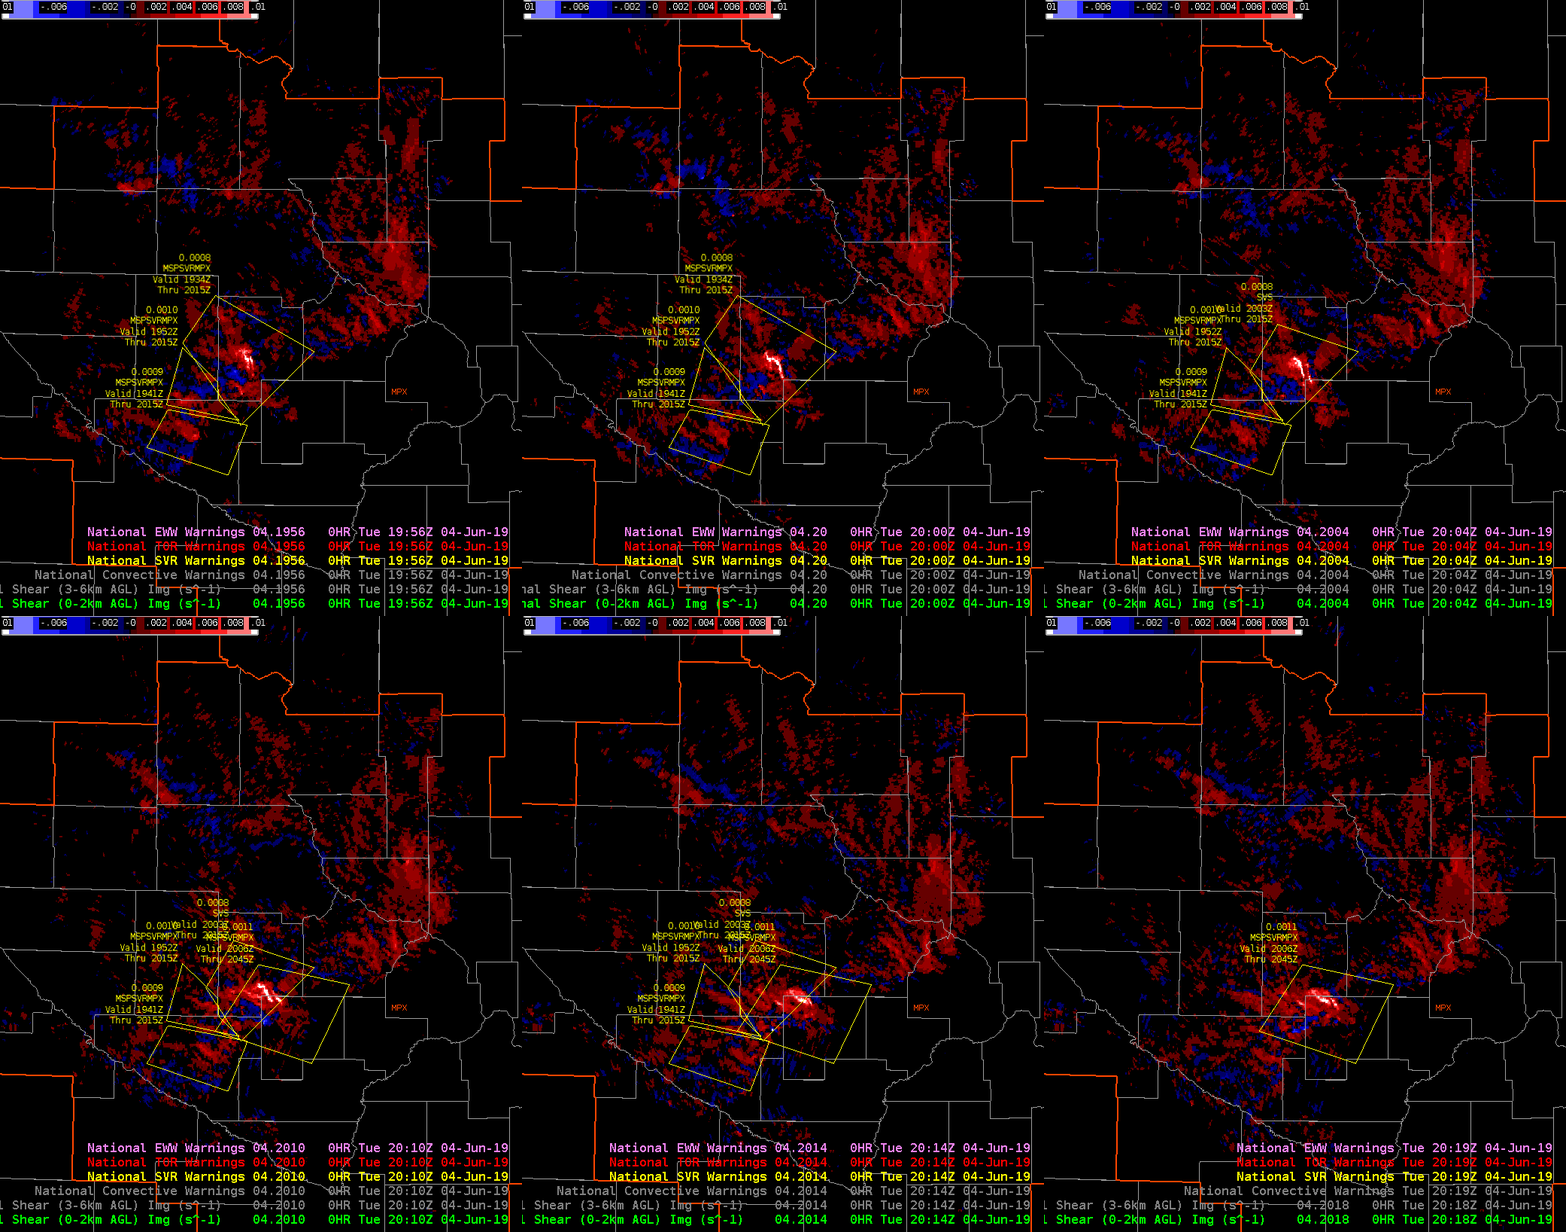
AzShear product following that rotation over time well…watching for increase in intensity there.

AzShear Effectively Detects Anticyclonic Rotation

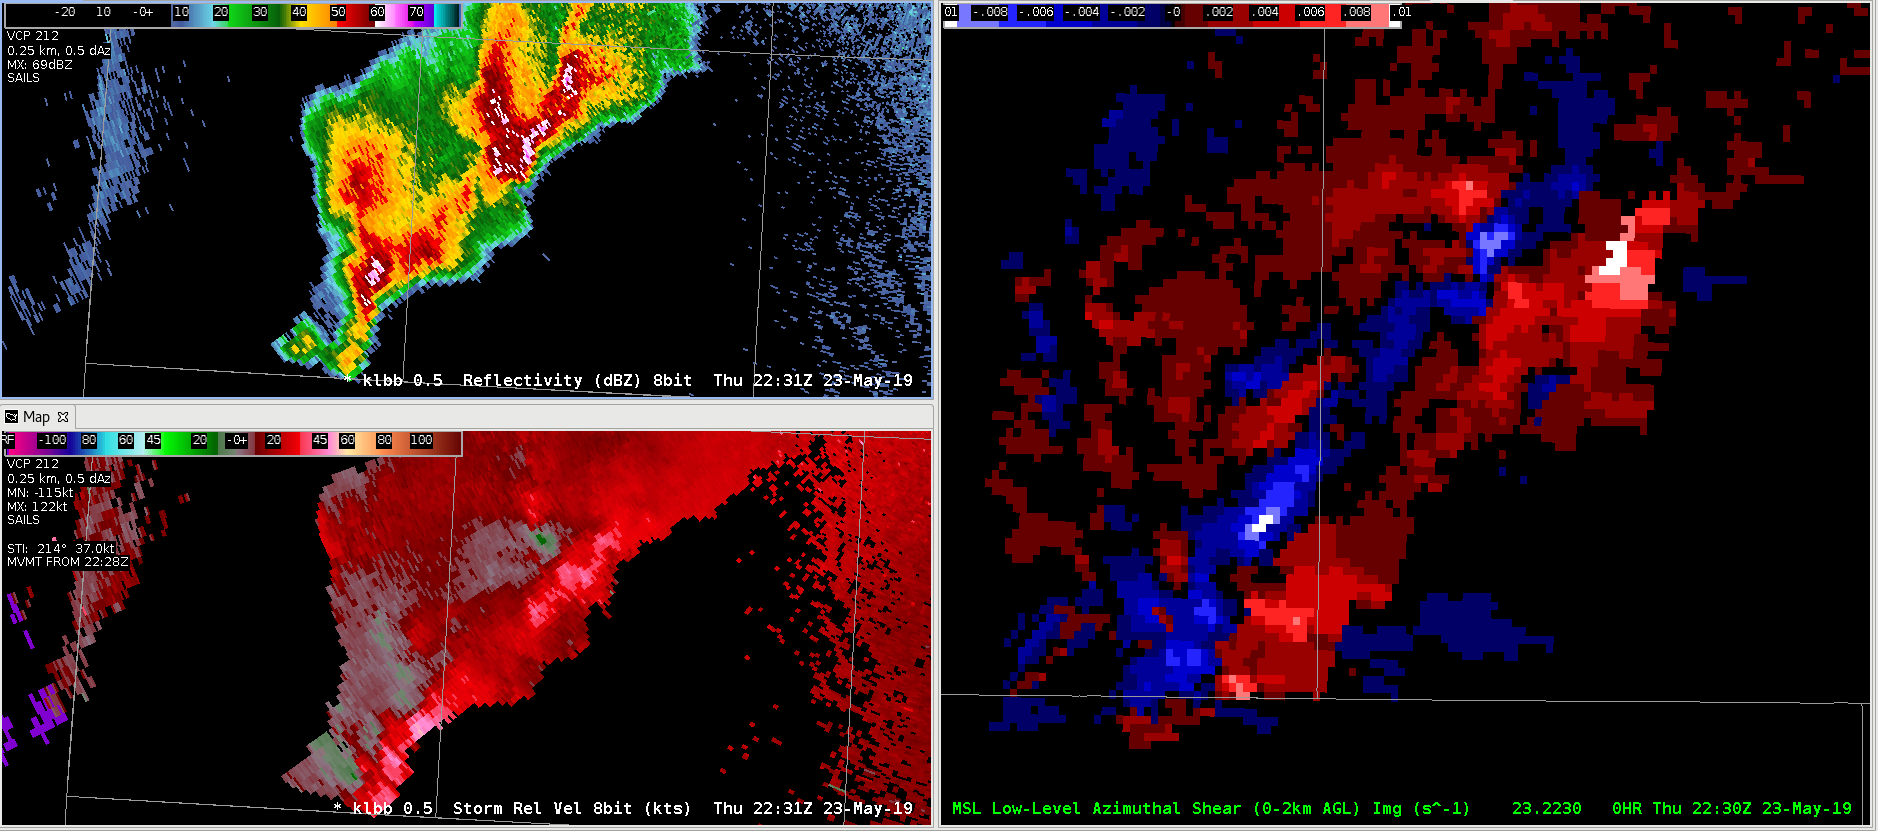
Two supercells southwest of Lubbock produced perplexing base radar signatures with a clear right-mover reflectivity signature but anticyclonic rotation evident in storm-relative velocity. To its credit, the MRMS AzShear product picked up on the anticyclonic circulation effectively and should be able to detect the rare anticyclonic tornado!

None of the mesocyclone detection algorithms picked up on the anticyclonic rotation. Perhaps this is part of their design. The New MDA tried to detect a mesocyclone southeast of the main anticyclonic circulation on the gradient of the strong outbound velocities, but it is incorrect.

-Atlanta Braves

Mid-Level Mesos

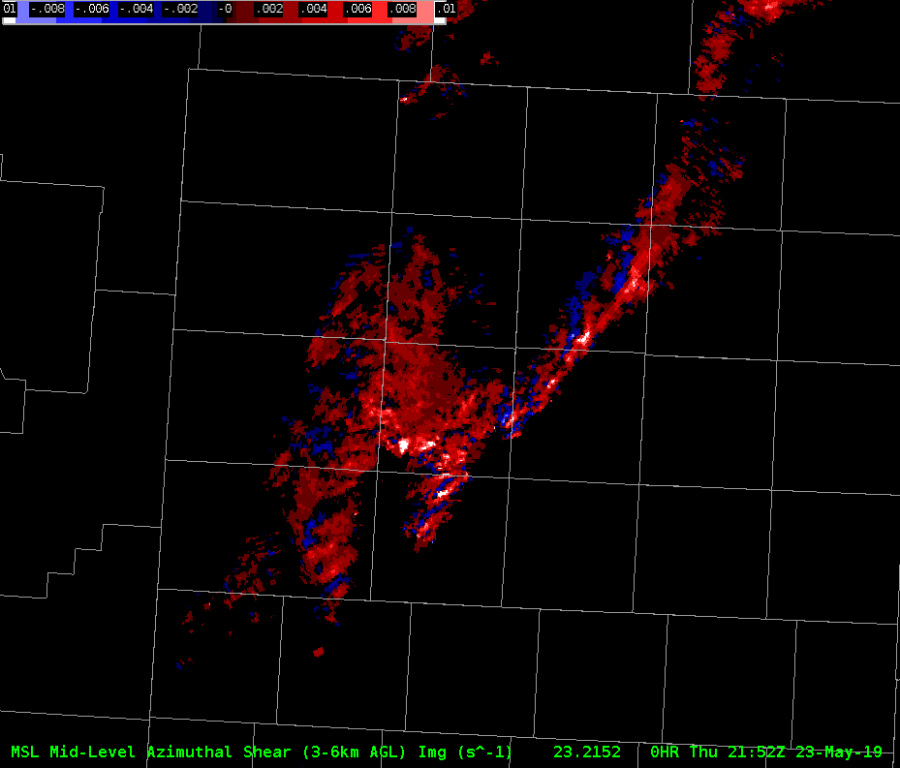
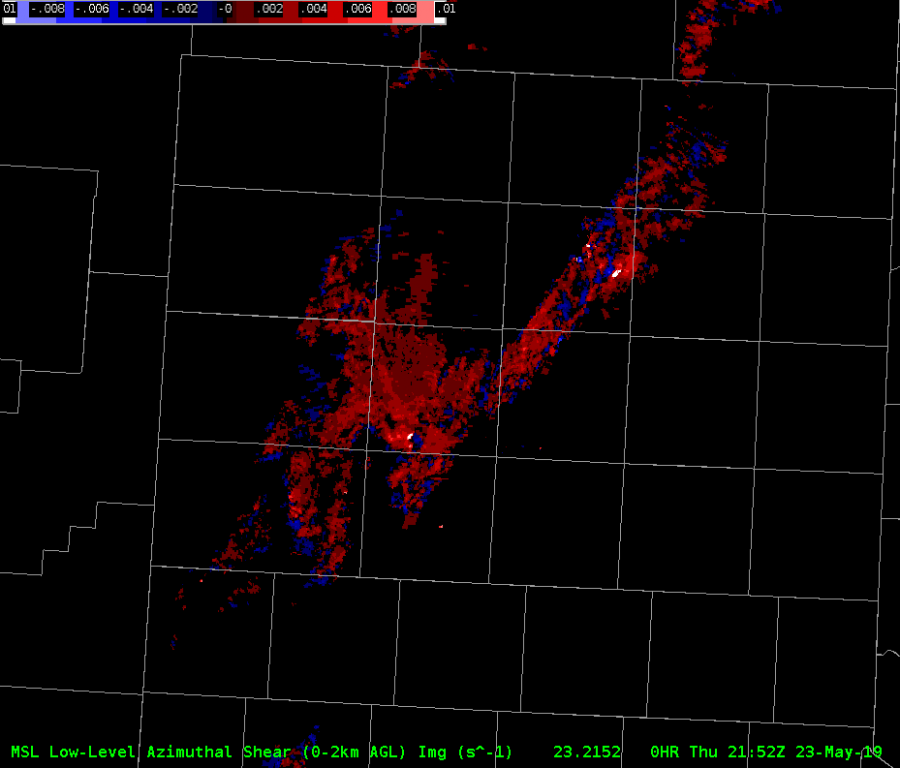
The merged AzShear product has done a solid job keeping up with low & mid level rotation tracks so far this afternoon in the Texas panhandle. Most of the storms over the last hour have exhibited weak low level rotation but much stronger mid level rotation. The merged AzShear product showcases it well with much hotter values on the mid-level product compared to low level. This also matches well with the threats observed so far with several reports of large hail, but any tornado threat has yet to materialize.

Dave Grohl

Single-Radar AzShear Tornadogenesis Success

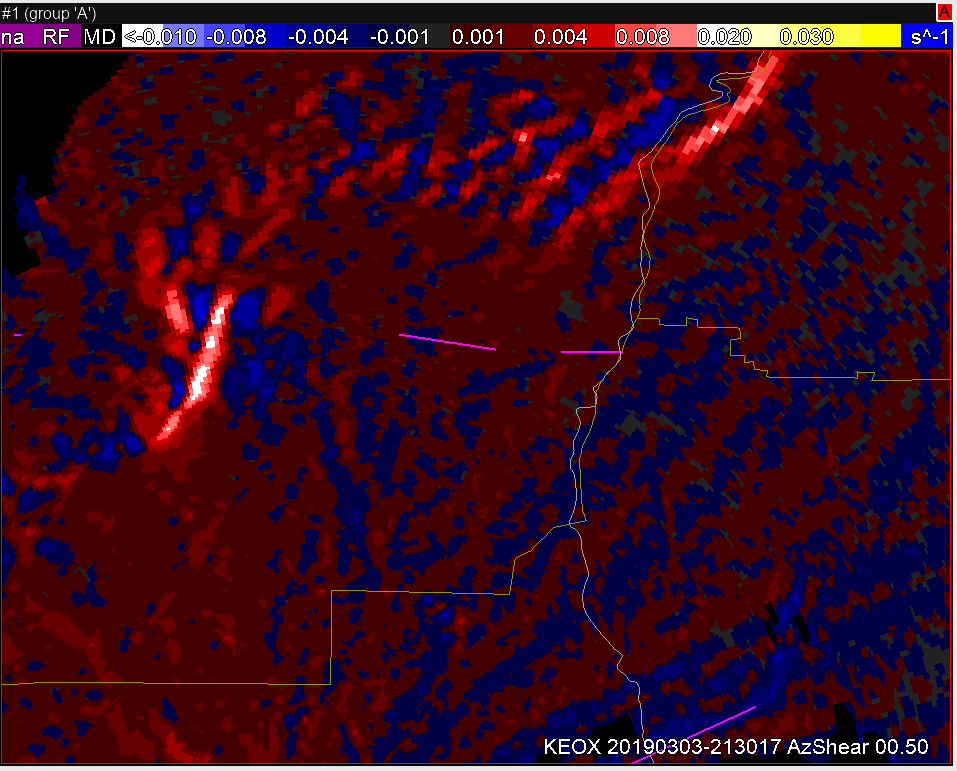
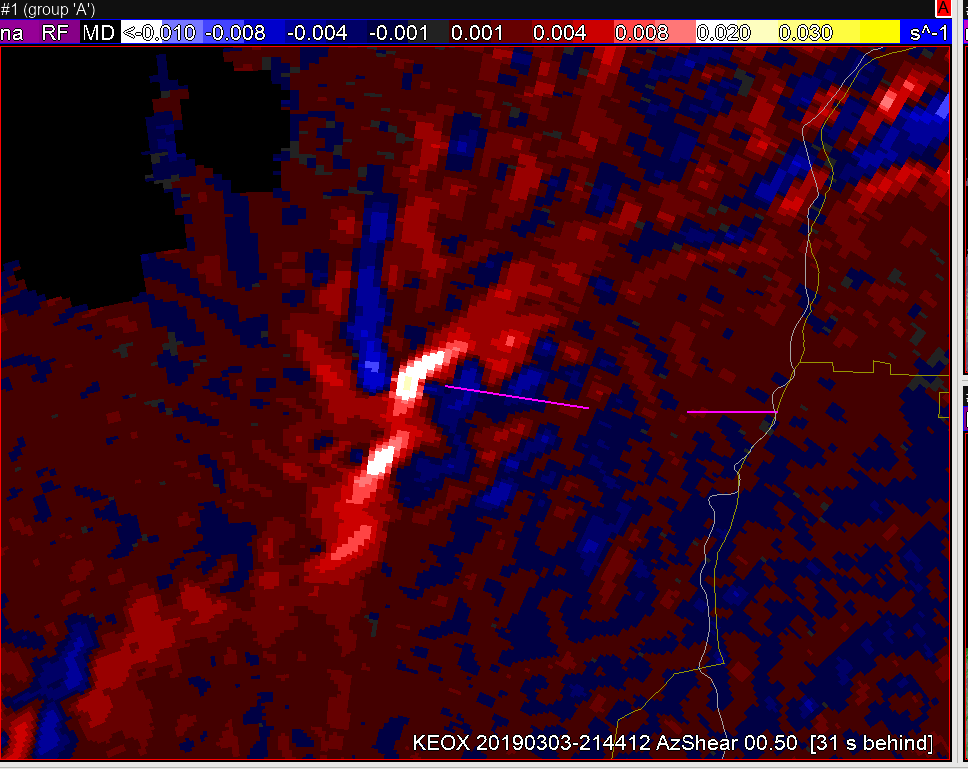
Single-radar AzShear does a really good job of identifying preferred locations of circulation along a QLCS. The bullseye started as an elongated area of enhanced AzShear and then converges into a more concentrated area. This product provides a helpful heuristic for identifying tightening circulations in the midst of noisy velocity data with less-clear signatures.

One can easily see the congealing AzShear bullseye before the circulation tightens the tornado starts.

On the contrary, the Merged AzShear product demonstrated some latency issues that would lead to less confidence in circulation tightening.

This image, taken at the same time as the KEOX AzShear product, shows several unorganized areas of enhanced rotation right before the tornado started in the merged AzShear product. The tightening circulation is an important precursor to tornadogenesis and the merged product seems to struggle. -Atlanta Braves

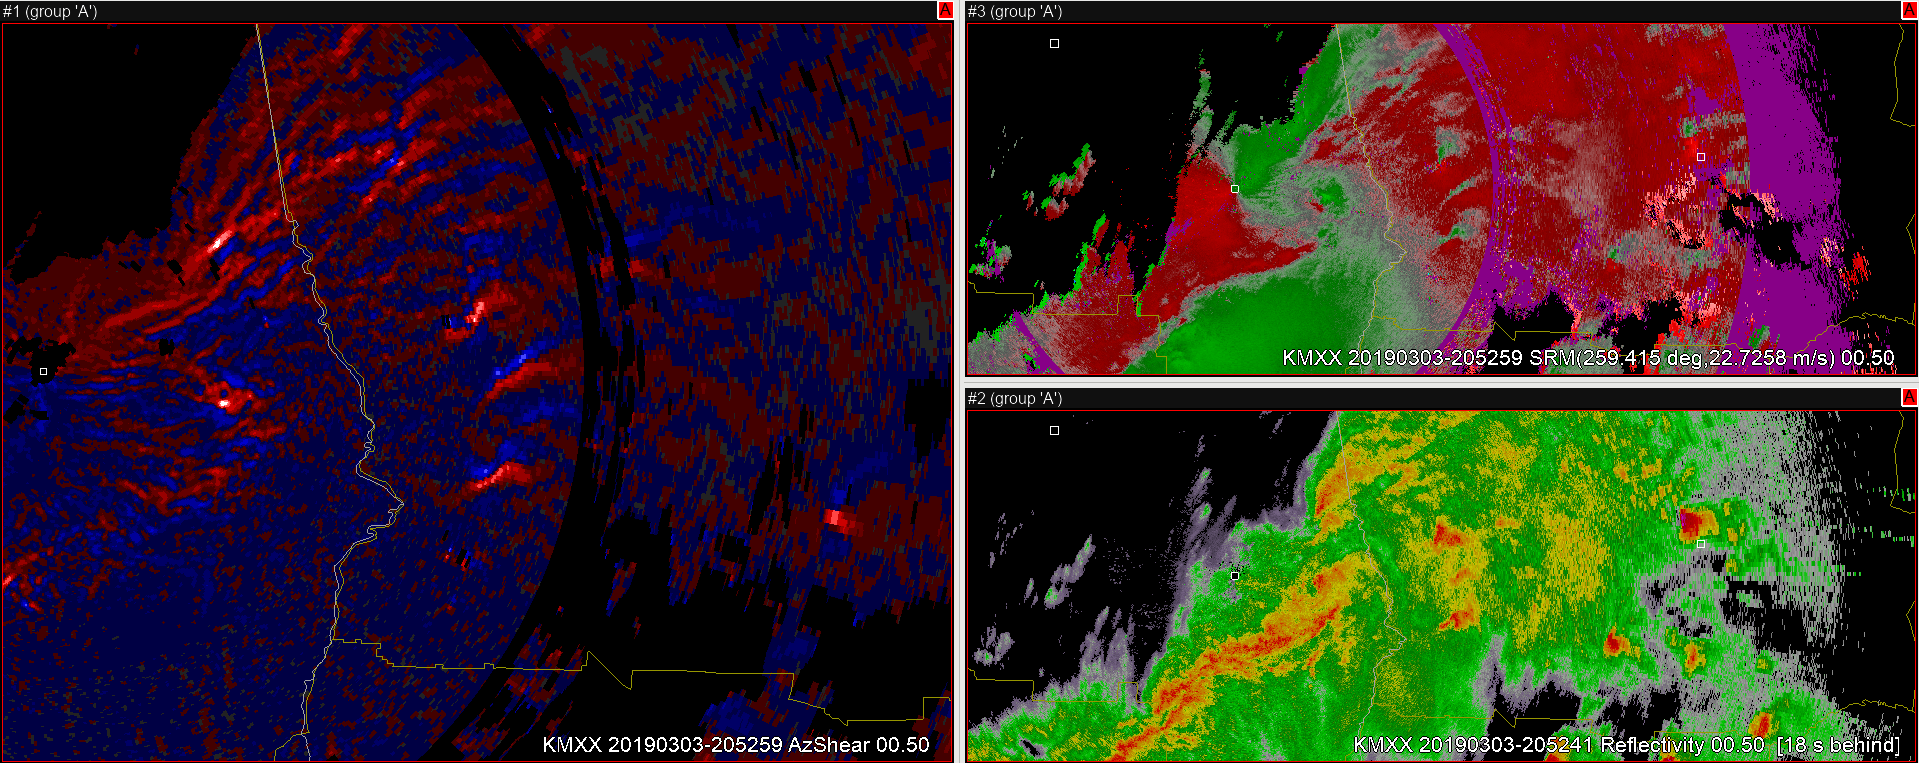
Single-Radar AzShear demonstrates superior performance on variety of thunderstorm modes

The single-radar AzShear product shows demonstrable improvement over MRMS Merged AzShear. The spatial detail of the best circulations is much better than that of MergedAzShear, which introduces spatial discontinuity and broader areas of interest. The AzShear color table, in particular, is exceptional in highlighting developing areas of rotation along with locations of convergence along bowing segments. In the example below, you can see the rotation signatures from several discrete supercells, an embedded supercell along the line, and a couple areas of convergence associated with the QLCS. For each of these cases, the AzShear performs well and gives a representative view of the severity associated with each circulation. -Atlanta Braves

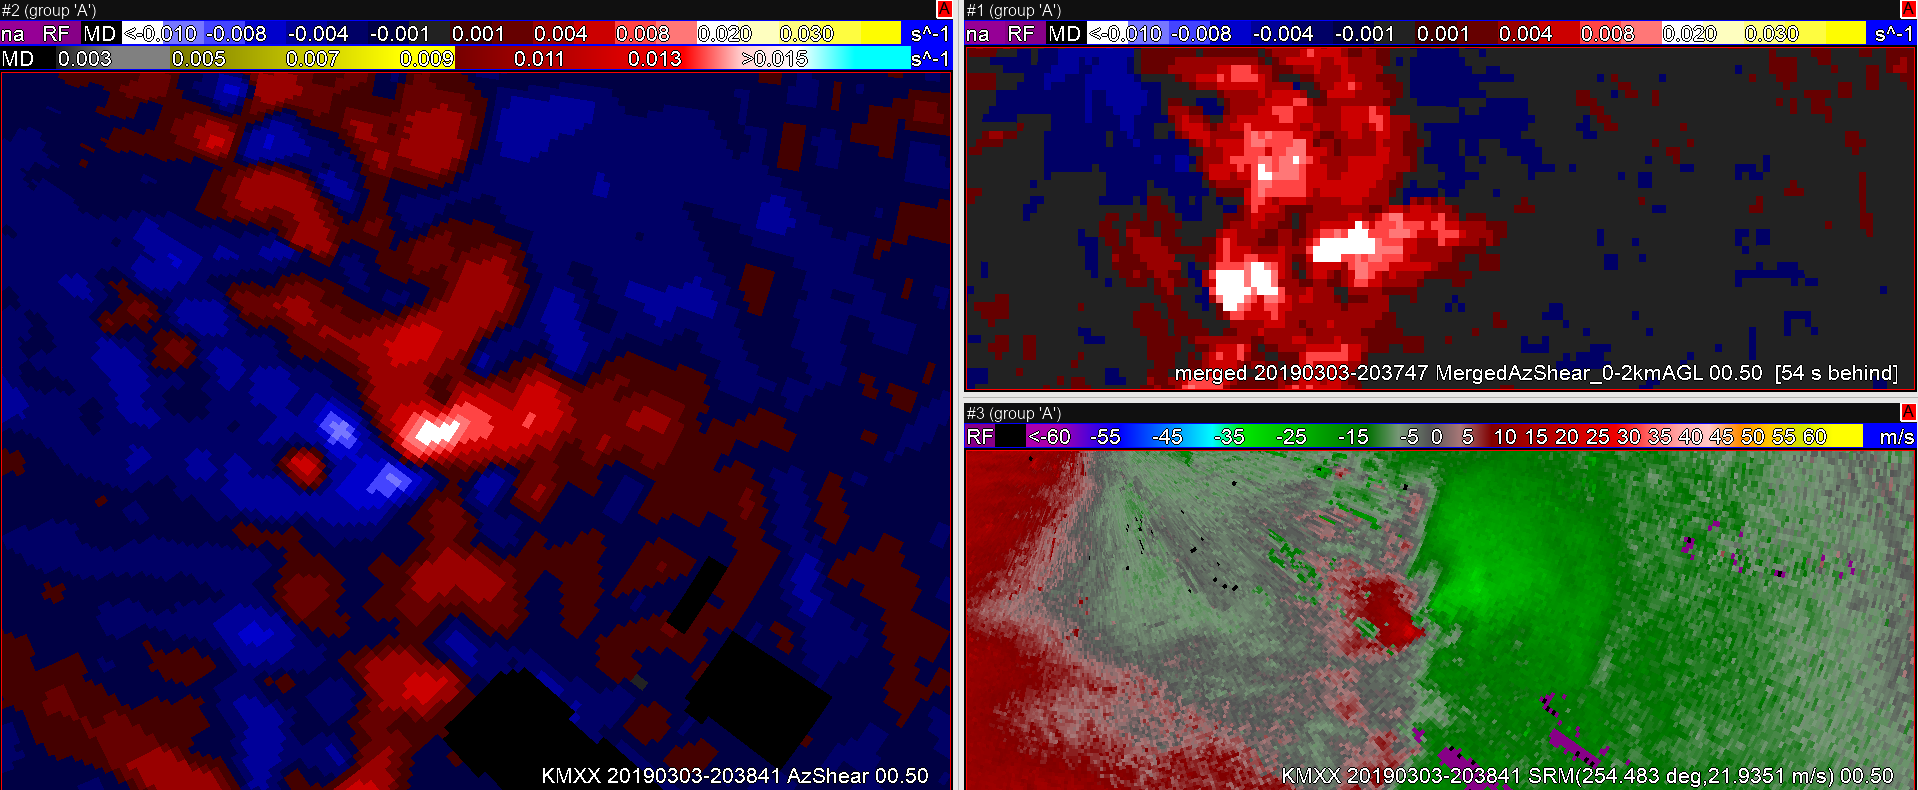
Single-Radar AzShear Product Showing Clearer Signal Compared with Merged Product

The single-radar 0.5 degree AzShear (left pane) shows a coherent area of high values associated with the velocity couplet (bottom right pane). Compare this with the merged product (upper right pane). The merged product shows a few different maxima in AzShear which is probably associated with the multiple radars and beam heights that are used to make the product. The single radar product also tracks the velocity couplet better in real time and is not subject to the lag in the merged product due to the multi-radar processing.

Ron Dayne

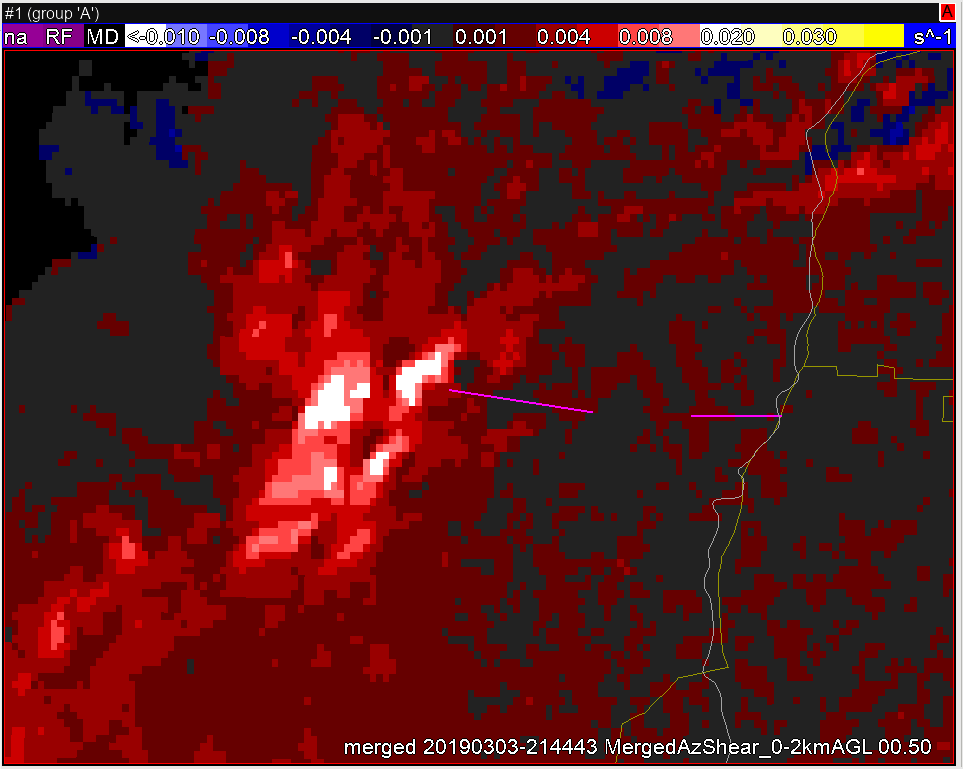
TDS CPTI Evaluation

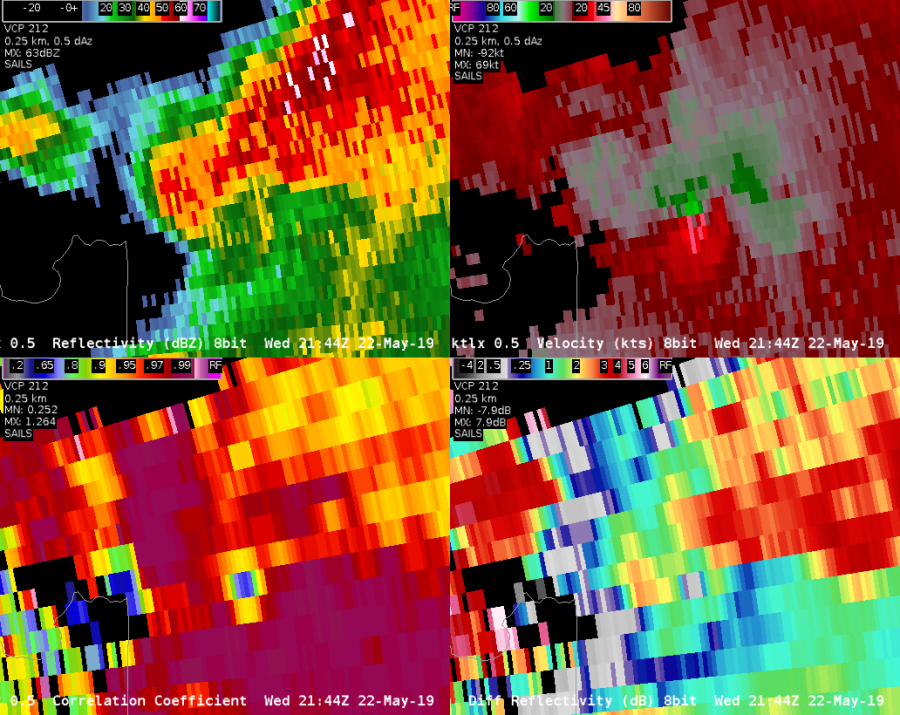
A tornado produced a TDS in the SW part of the Tulsa WFO CWA at 21:44Z. Maximum TDS height was ~6kft.

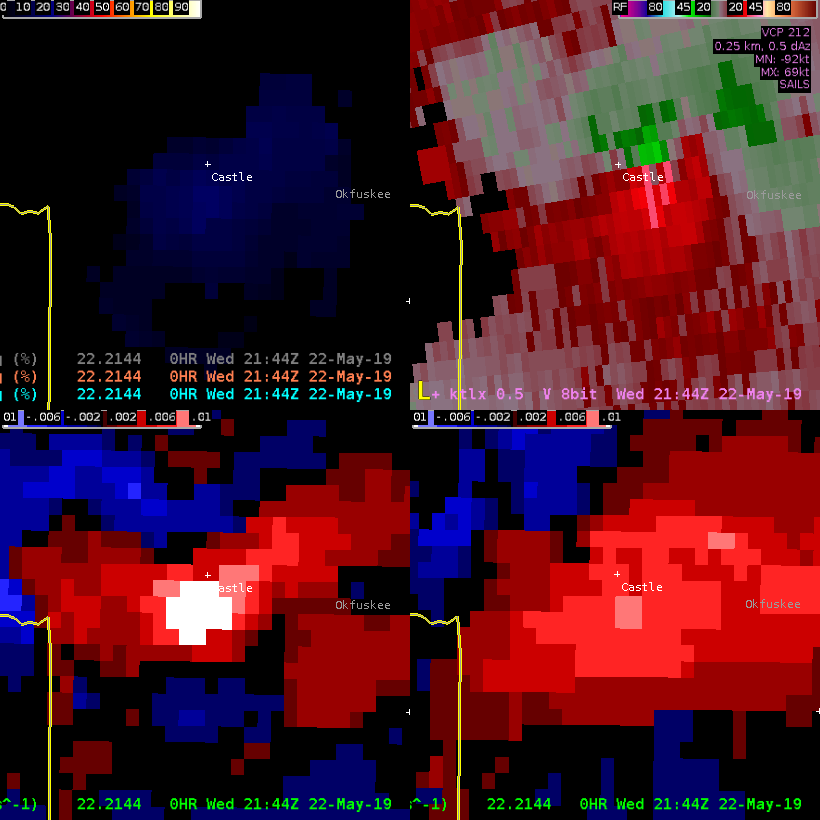
The CPTI adequately represented an increase chance of a strong tornado (18-20%, top left).

It appears this CPTI did not have the same issues with effective STP like yesterday’s St. Louis tornado did. I like this product a lot! -Atlanta Braves

AzShear and CPTI helping to lead to tornado warning decision

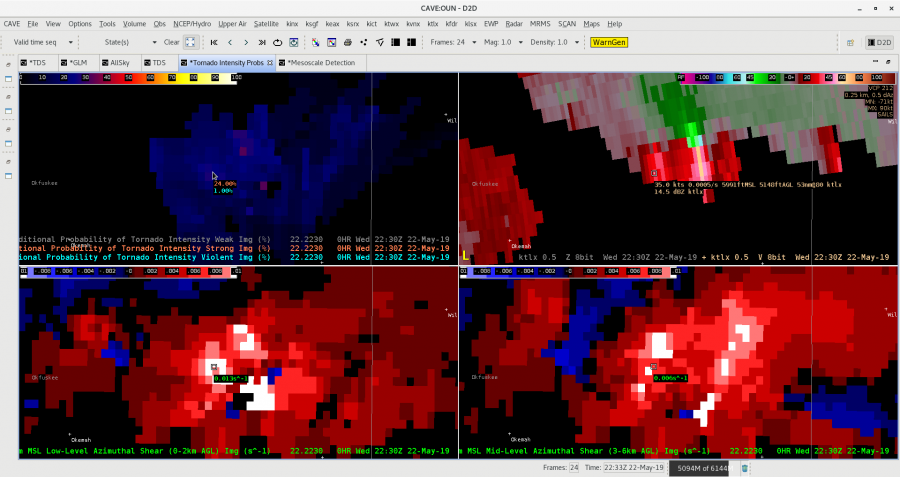
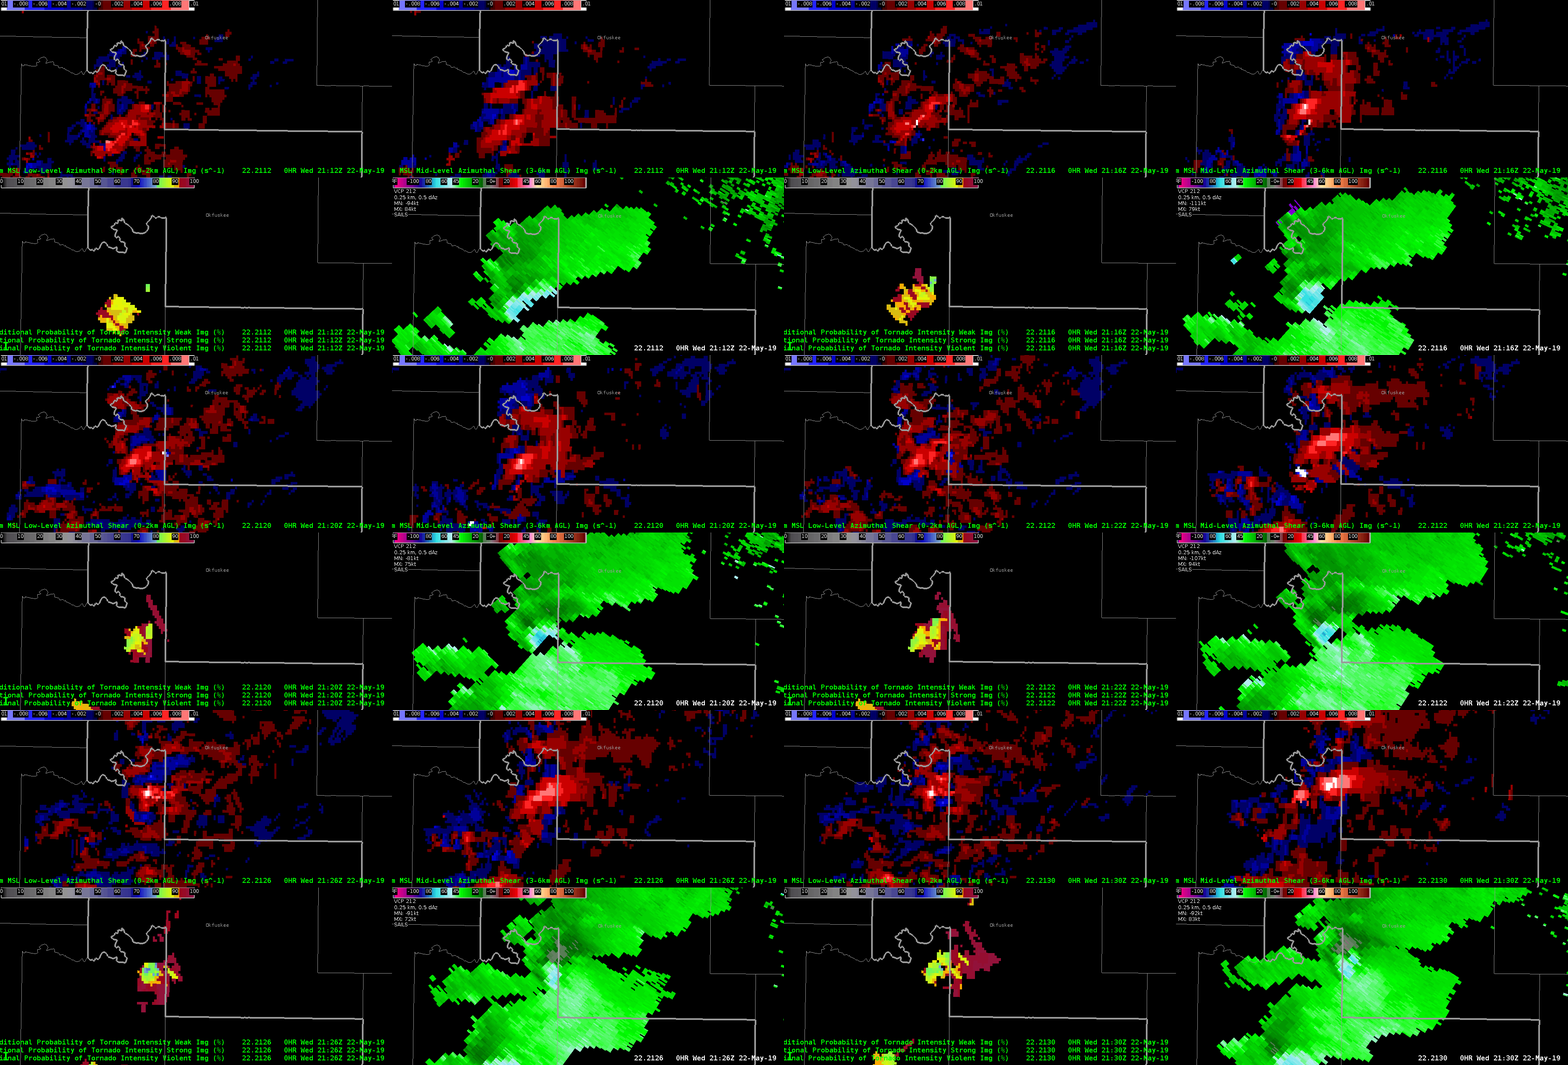
On May 22 at around 2130Z, a tornado warning (test) was issued for Okfuskee County in the Tulsa CWA. Besides the usual examination of base velocity data, other tools that were used to help the decision were the merged AzShear products and the CPTI products. Watch the loop below.

In this four-panel, the upper left has the 0-2 km merged AzShear, the upper right has the 3-6 km AzShear, the lower left has the Weak/Strong/Violent CPTI products overlayed on each other, and the lower right has the 0.5 degree base velocity.

At the beginning of the loop, the max 0-2 km AzShear values were .008 s^-1, but increased throughout the loop, eventually reachingĀ  .012 s^-1, exceeding the .010 threshold. The 3-6 km AzShear showed a similar trend.

The CPTI product showed a noticeable trend as well. At the beginning of the loop the weak/strong/violent values were 89/11/0 %, respectively. Since most every value of AzShear starts with 100% weak, the values were not overly supportive. However, by the end of the loop, the values were 75/23/2 % respectively, a significant increase in the threat of both strong and violent tornadoes. With the limited experience I have using the product, once the strong gets to 20% or higher, and the violent gets to 2% or higher, it greatly increases the confidence in needing a tornado warning.

Thorcaster