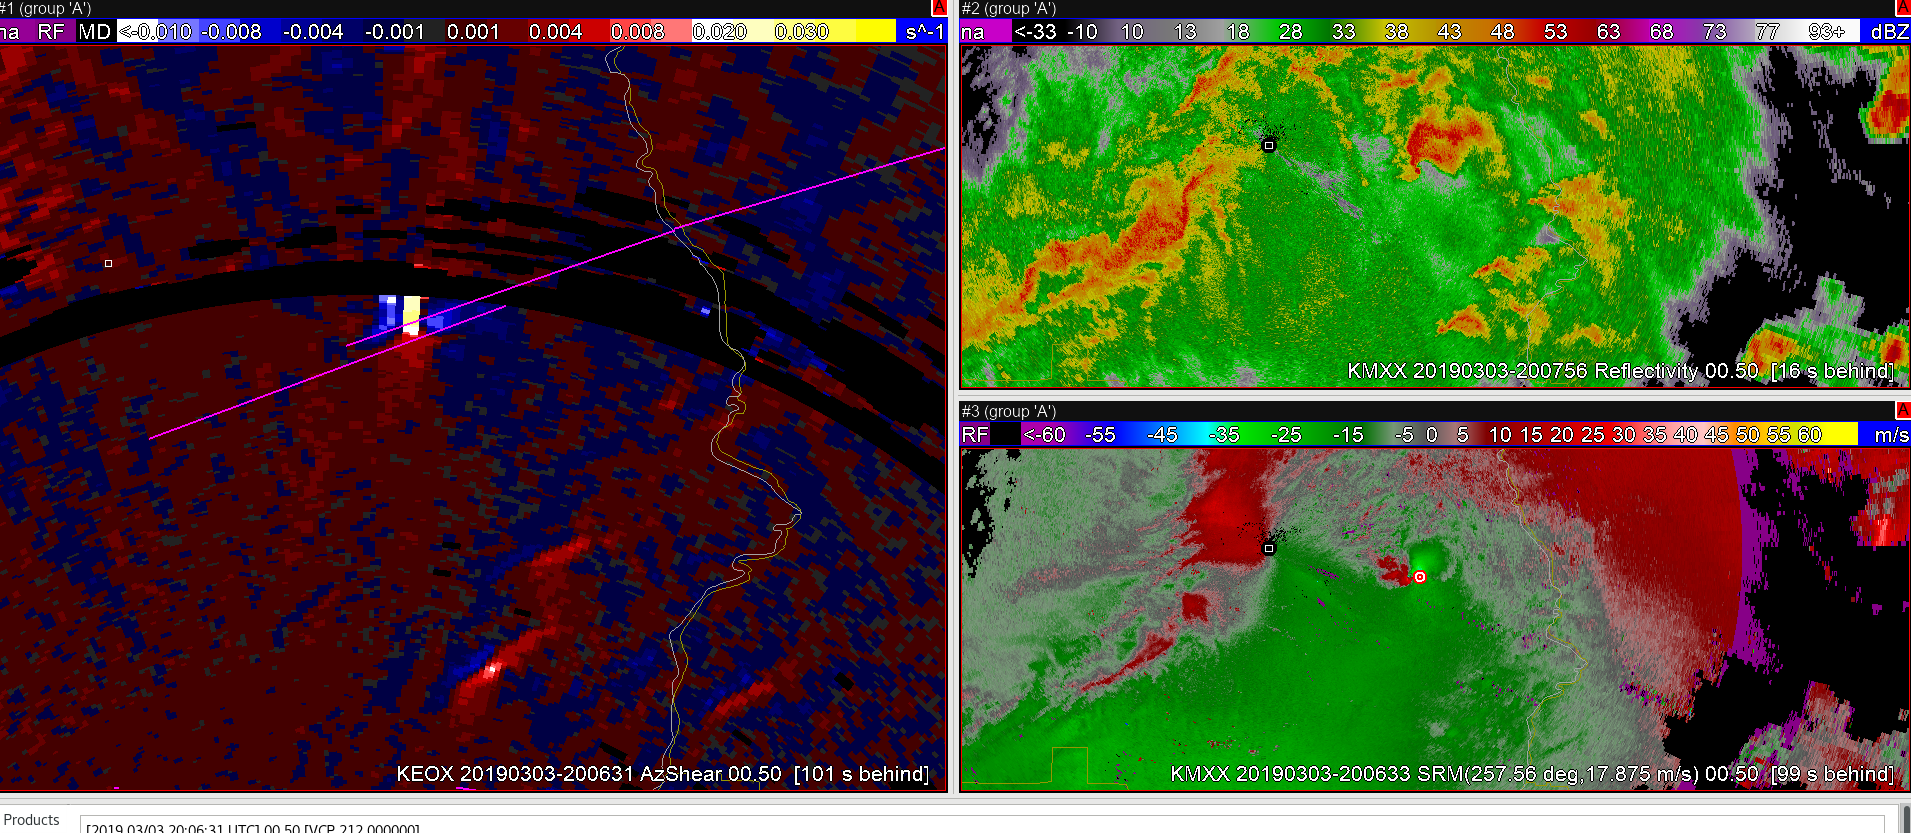
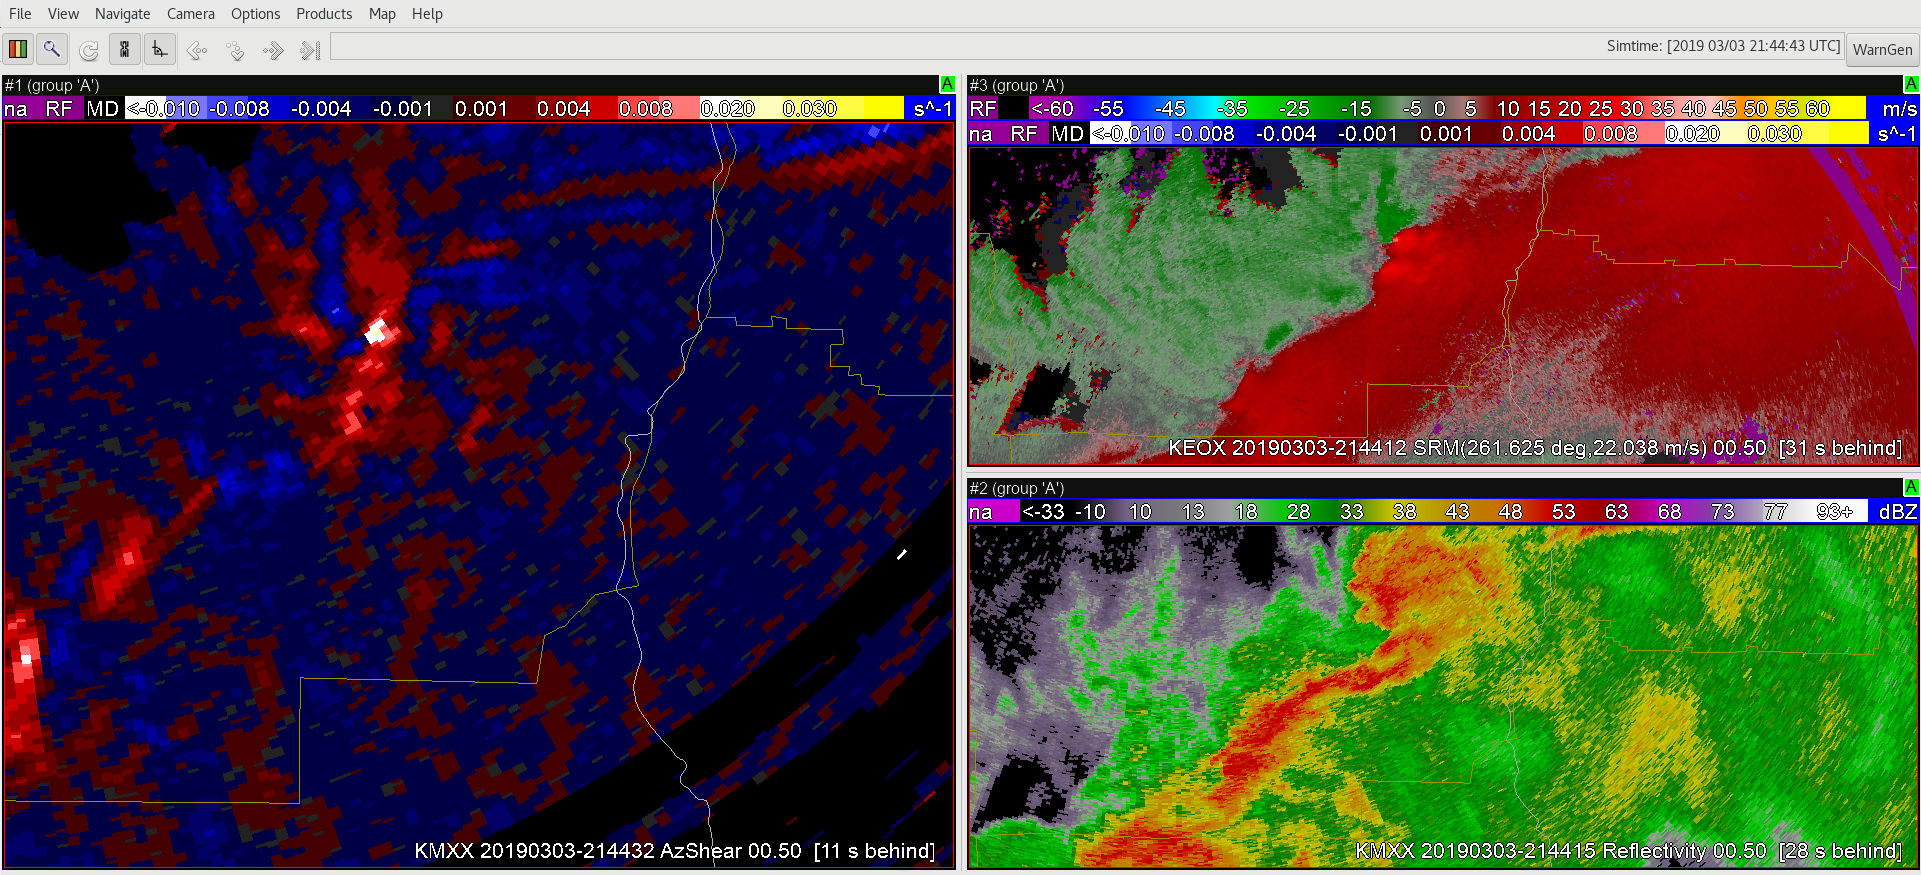
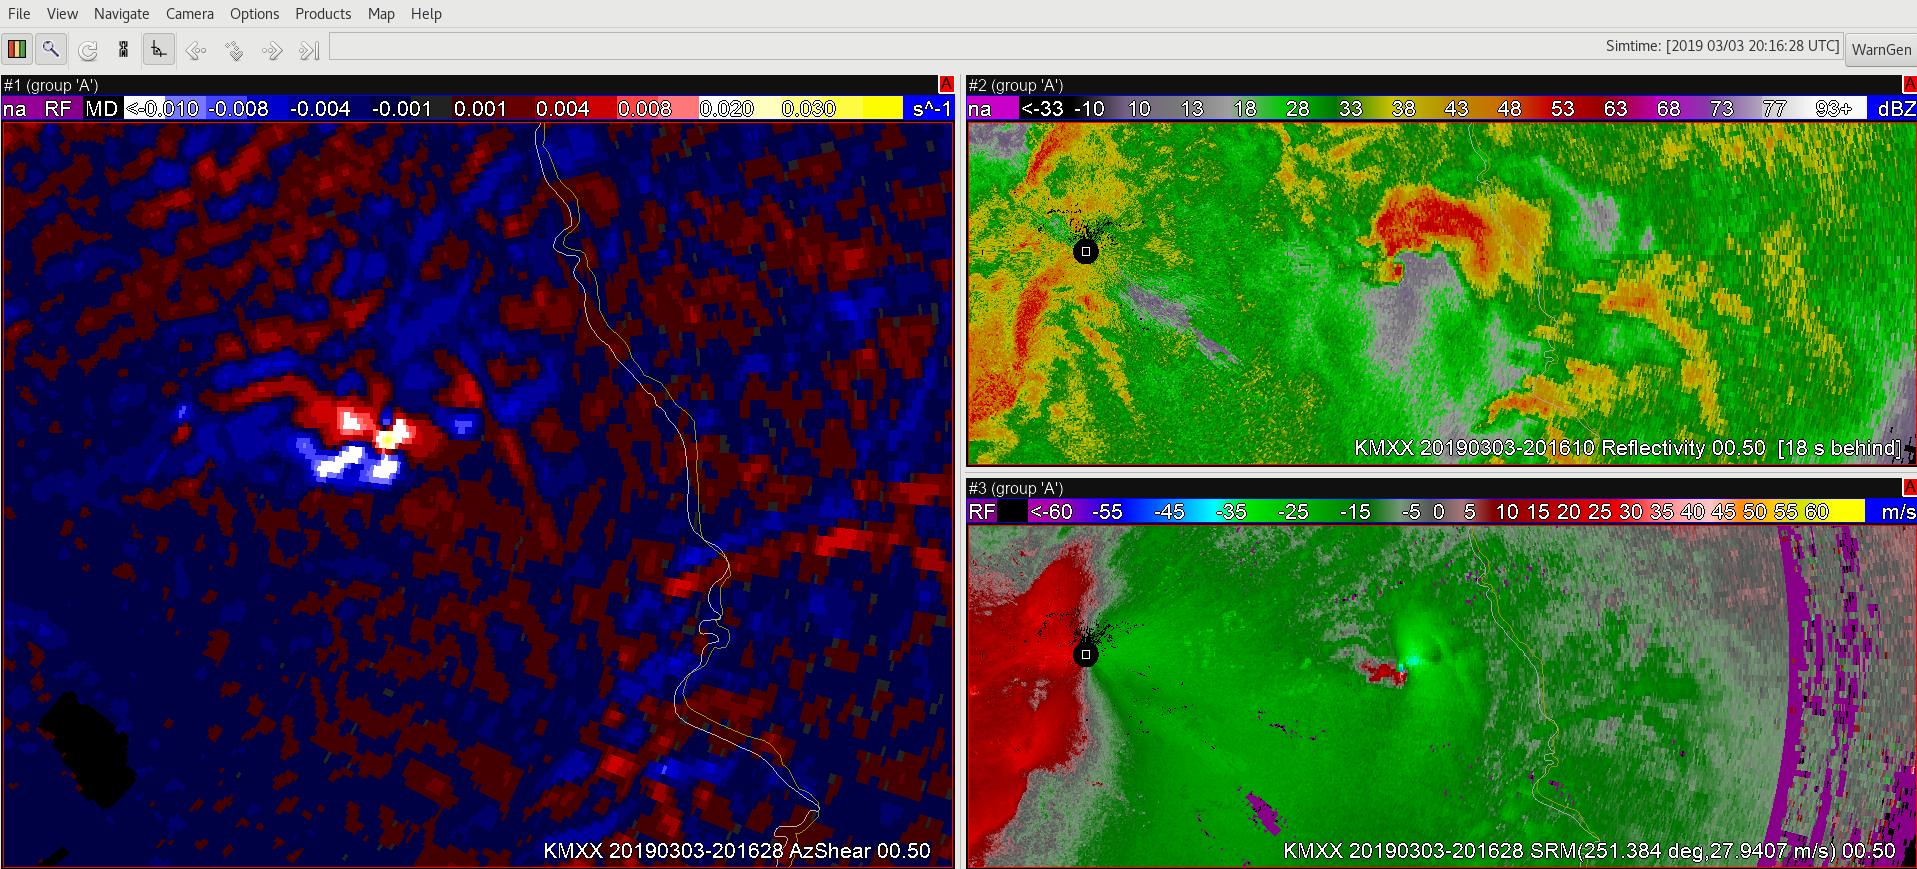
 The Fort Rucker, AL (KEOX) radar, well south of the storm of interest, shows strong azimuthal shear values up to 0.028 S-1. The maximum values are slightly offset to the north of the surveyed tornado track (pink line) likely due to distance from the radar. A mature hook echo is apparent in the reflectivity with a corresponding tight couplet in the 0.5 degree SRM.
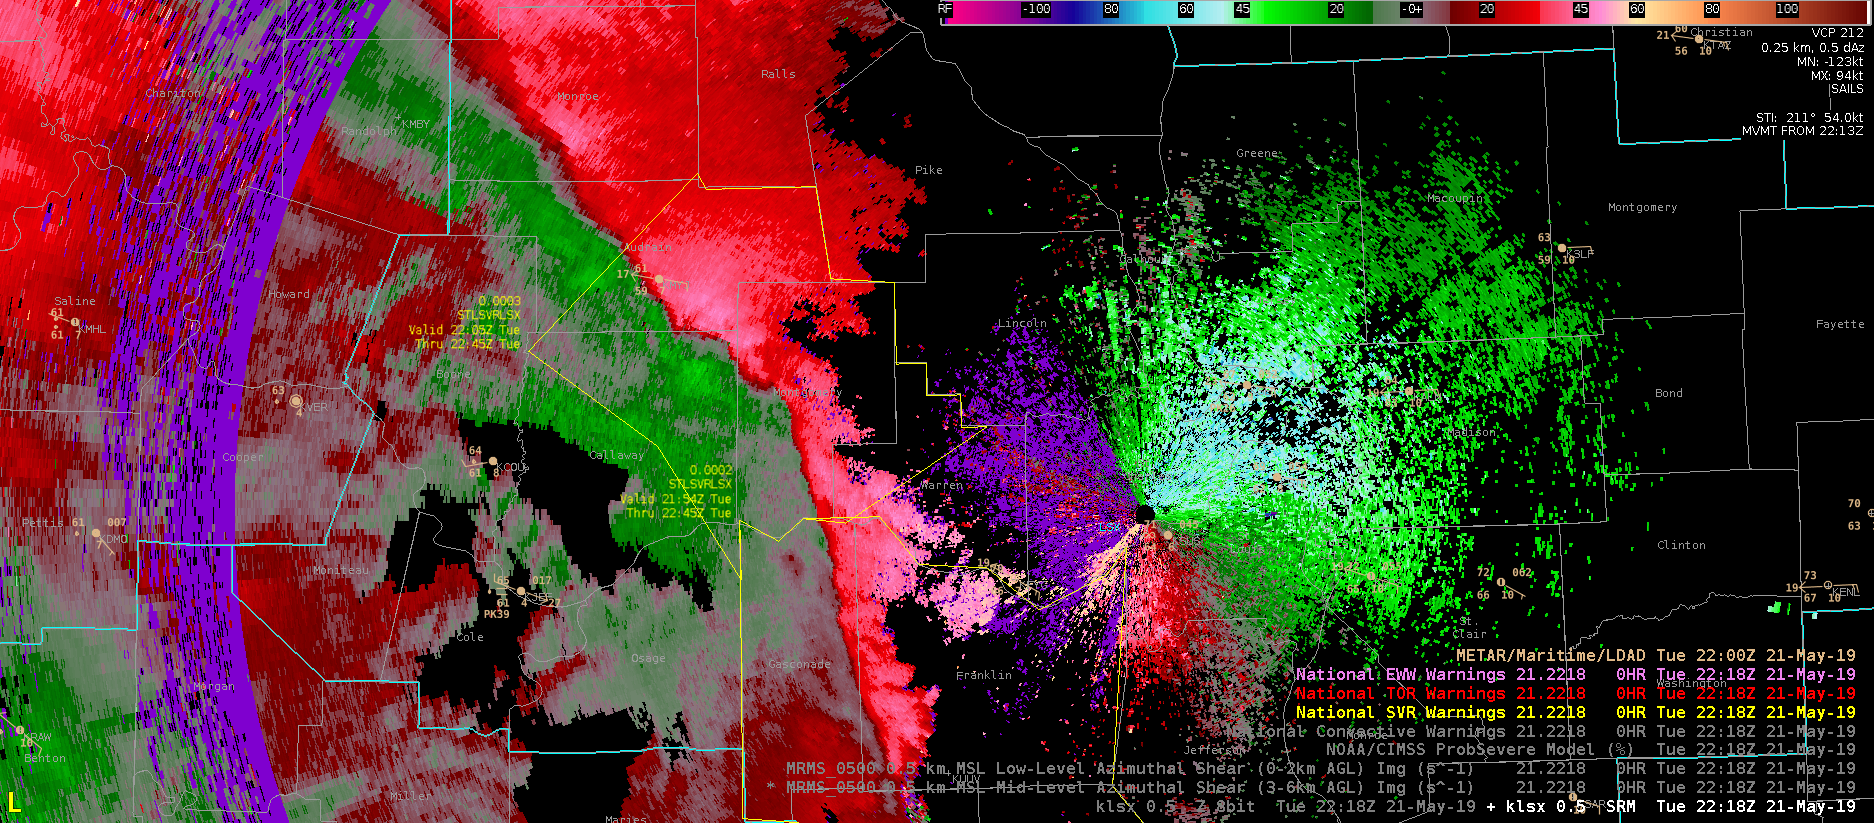
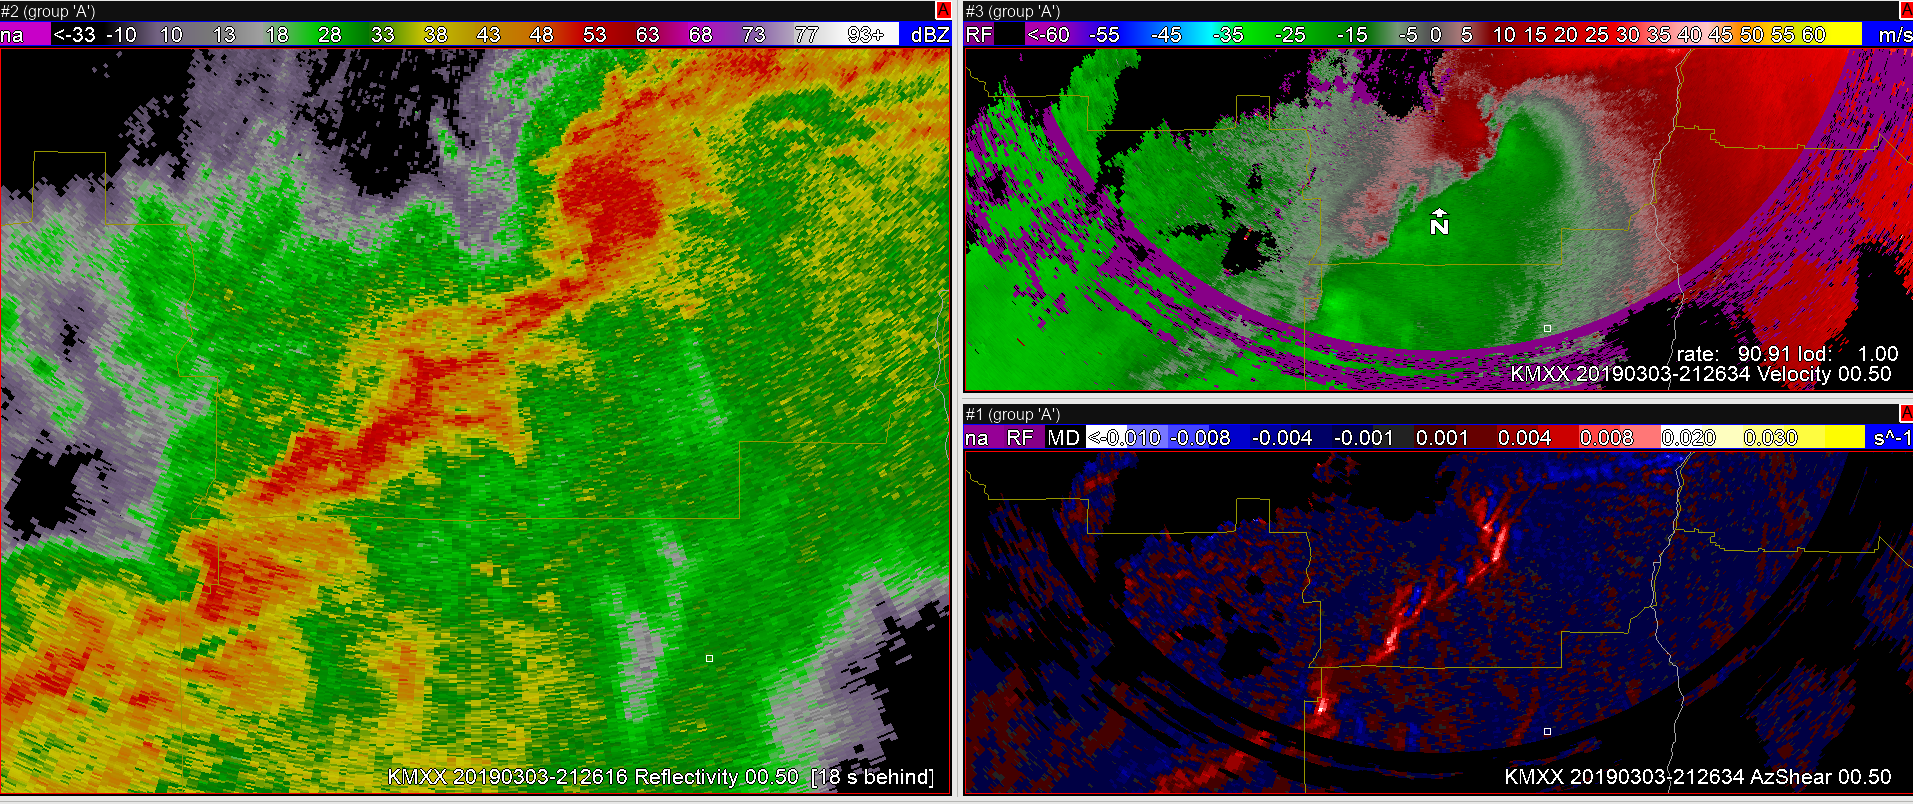
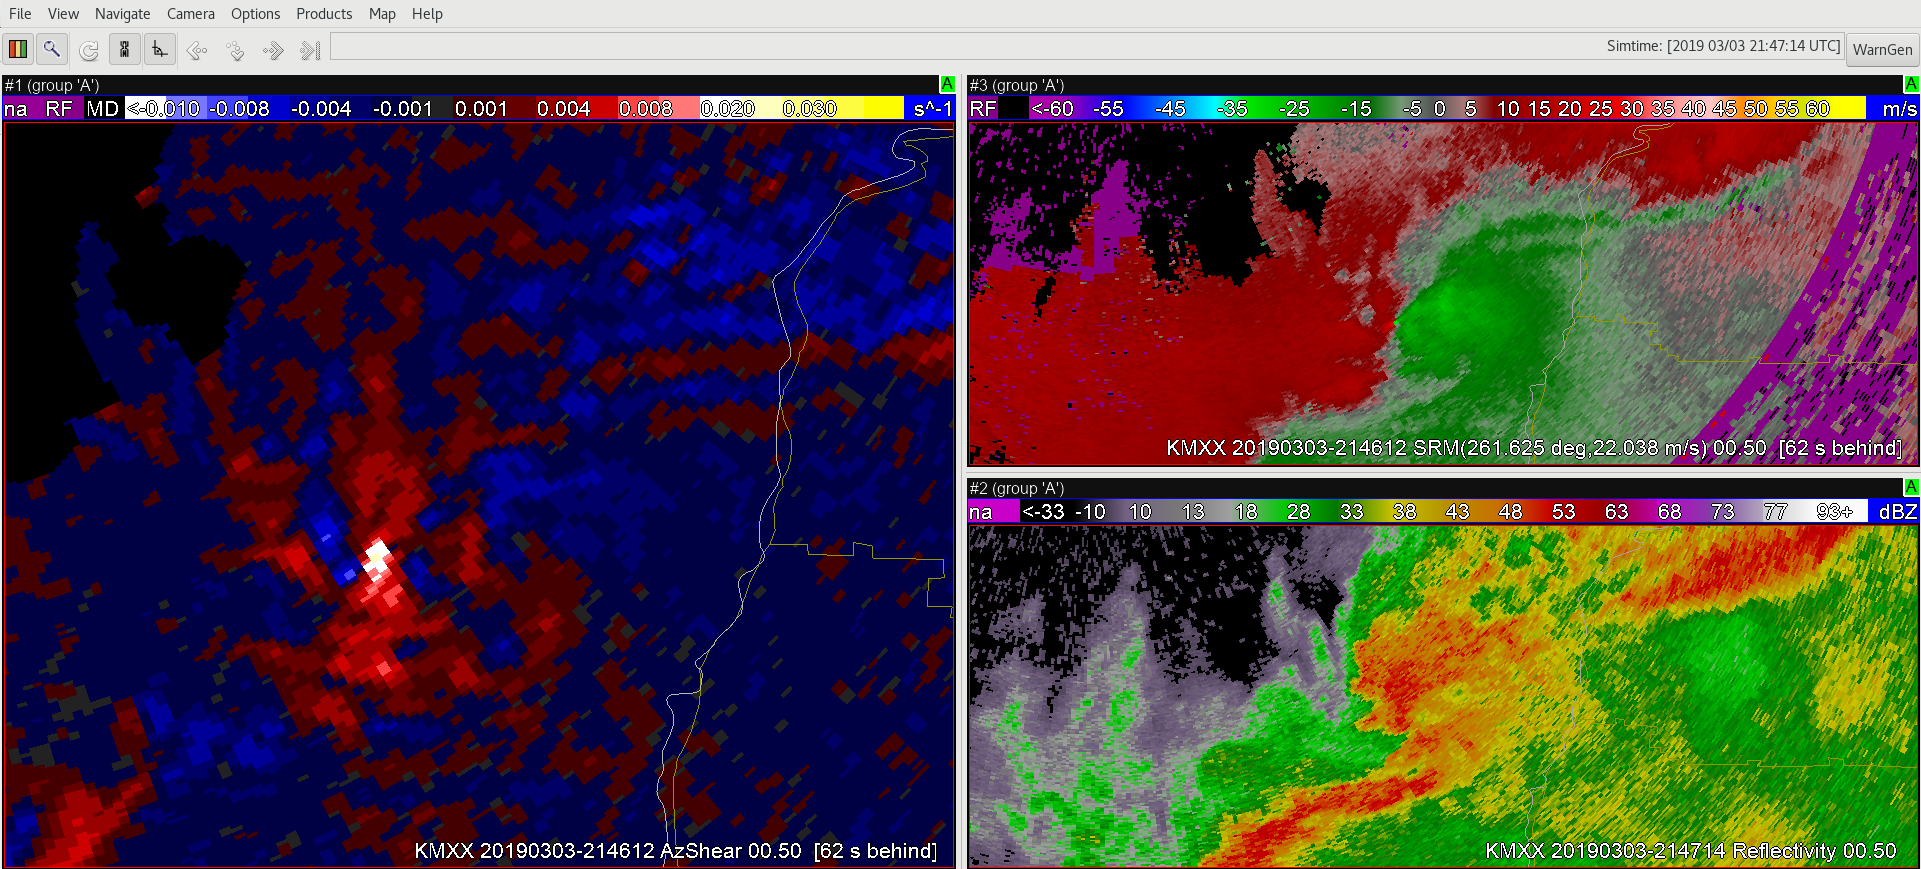
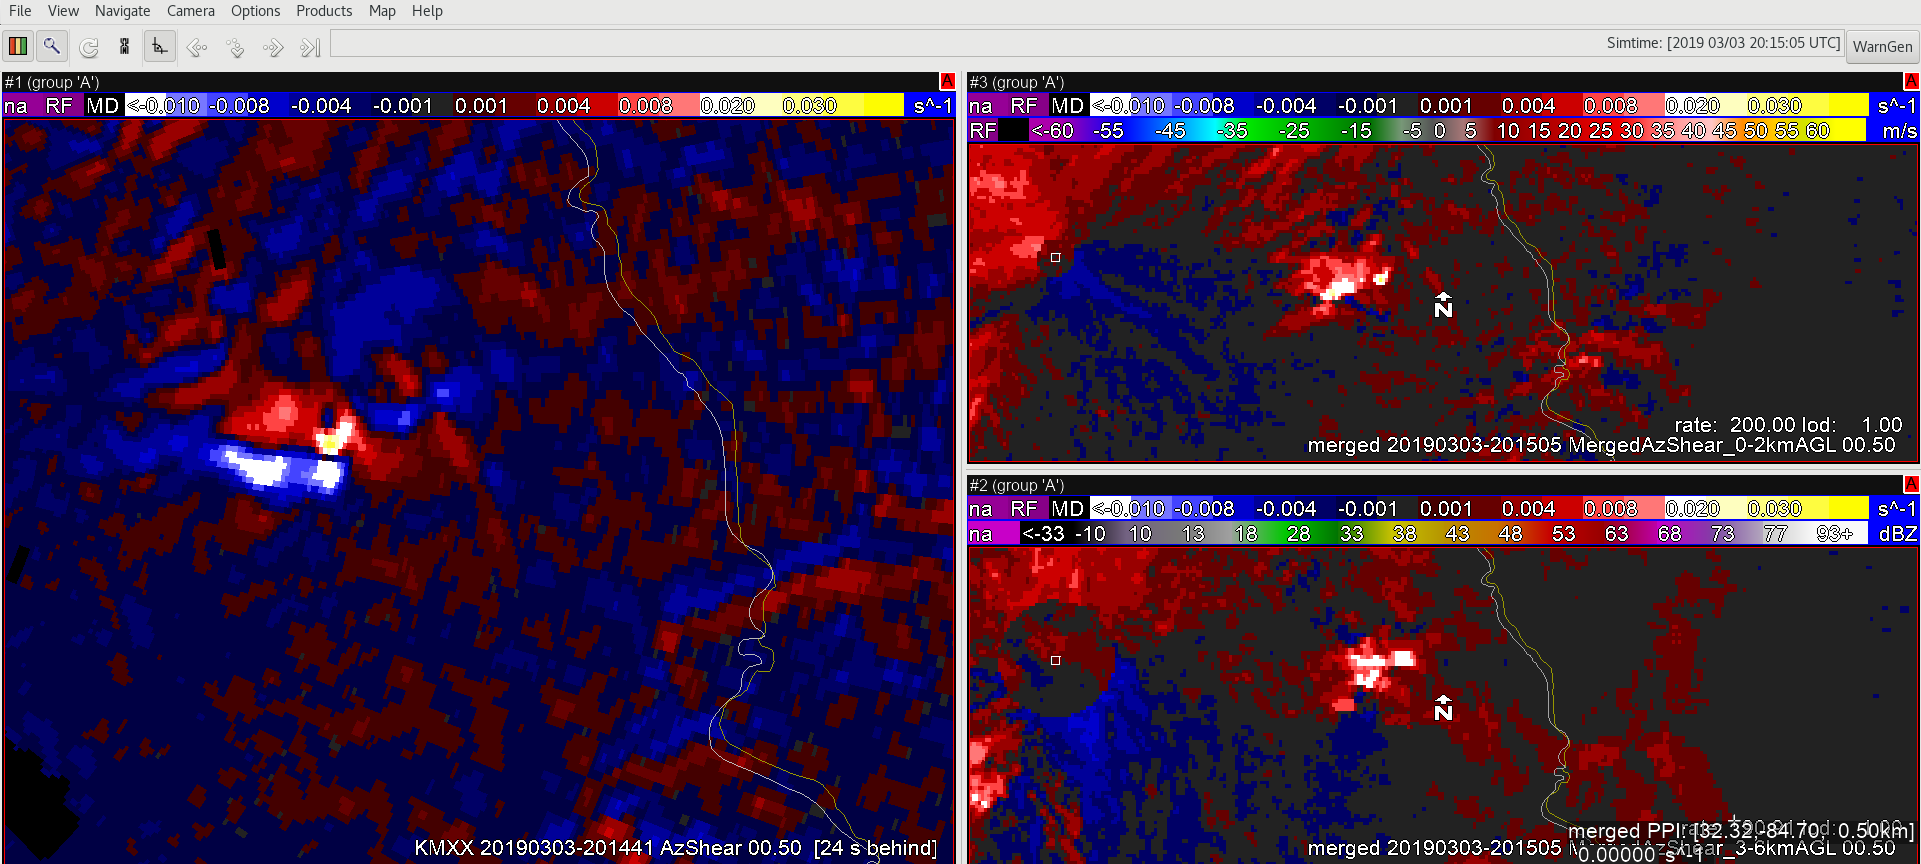
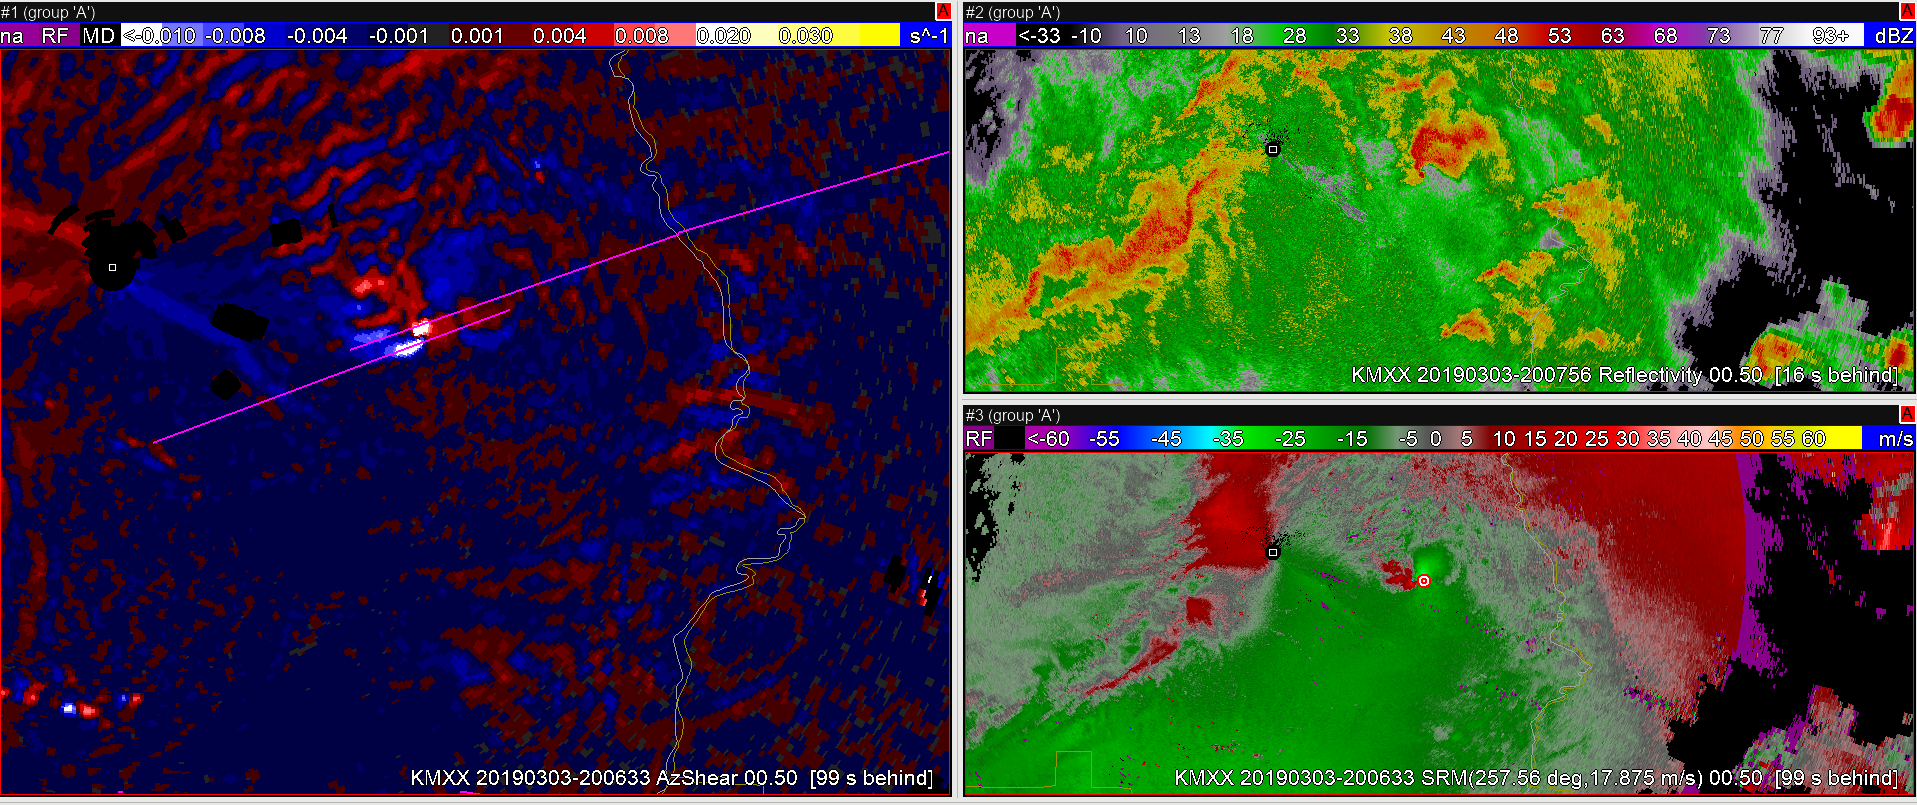 The Maxwell, AL (KMXX) radar, located closer and to the west the tornadic supercell, was also detecting strong azimuthal shear up to 0.021 S-1. An area of negative shear was located immediately to the south of the SRM couplet, along a weaker anticyclonic inbound-outbound interface. This corridor of blue shades to bright white was a bit distracting from the more important red to white positive shear associated with the cyclonic rotation. The maximum positive shear values were located exactly on the track of the surveyed tornado. Reflectivity and SRM KMXX data were similar to KEOX.
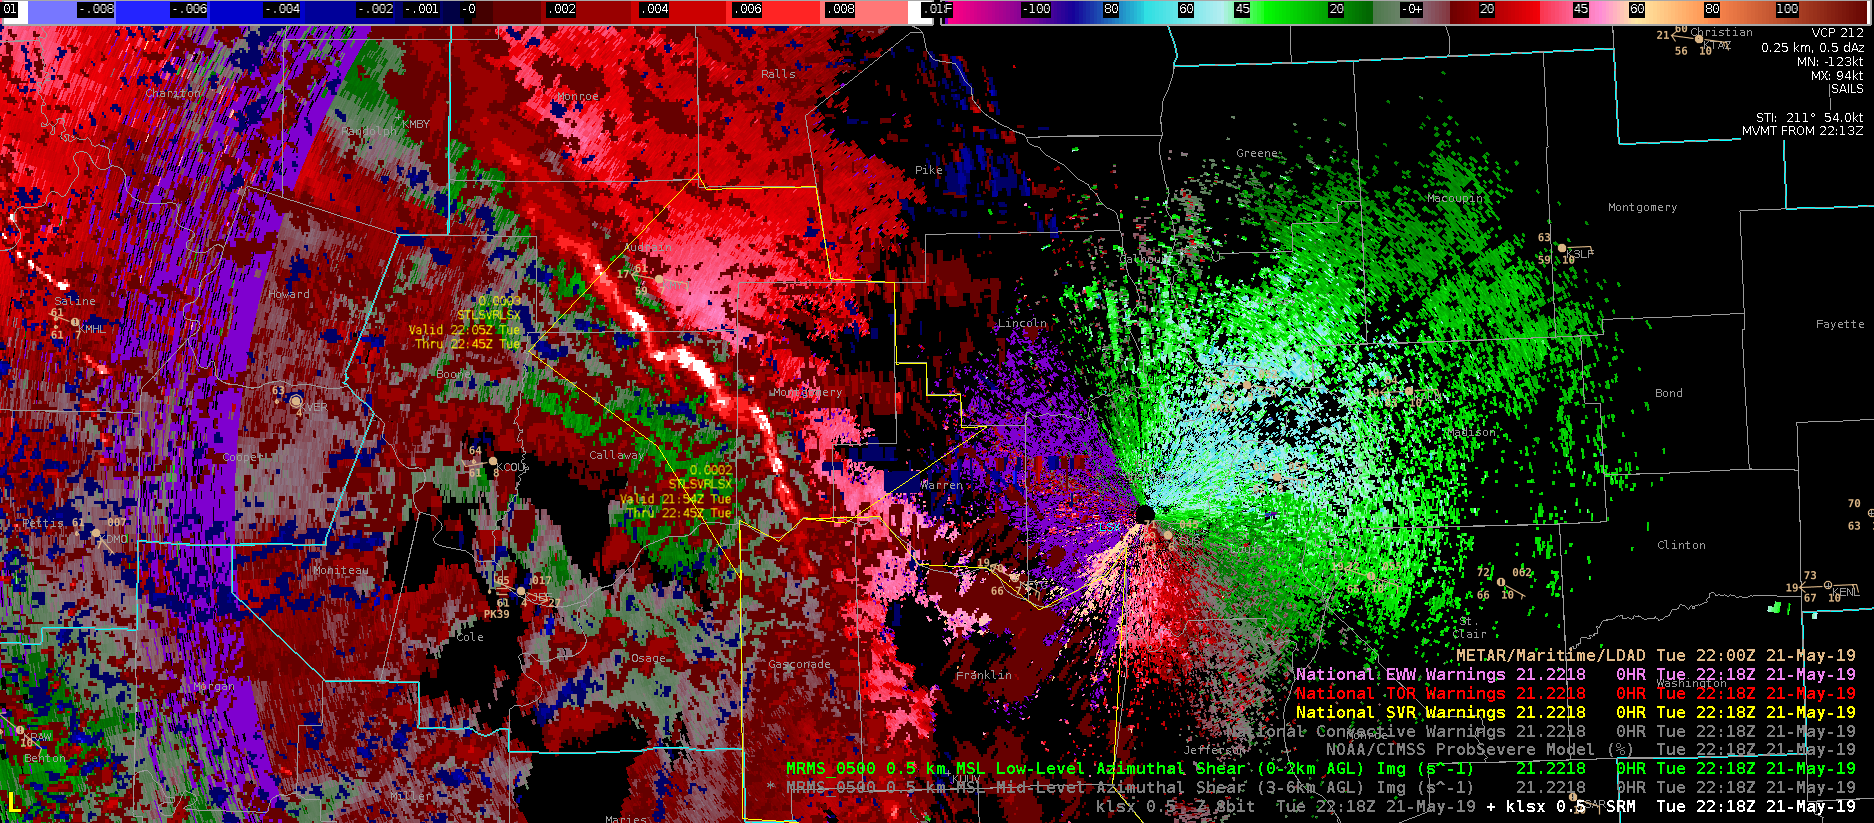
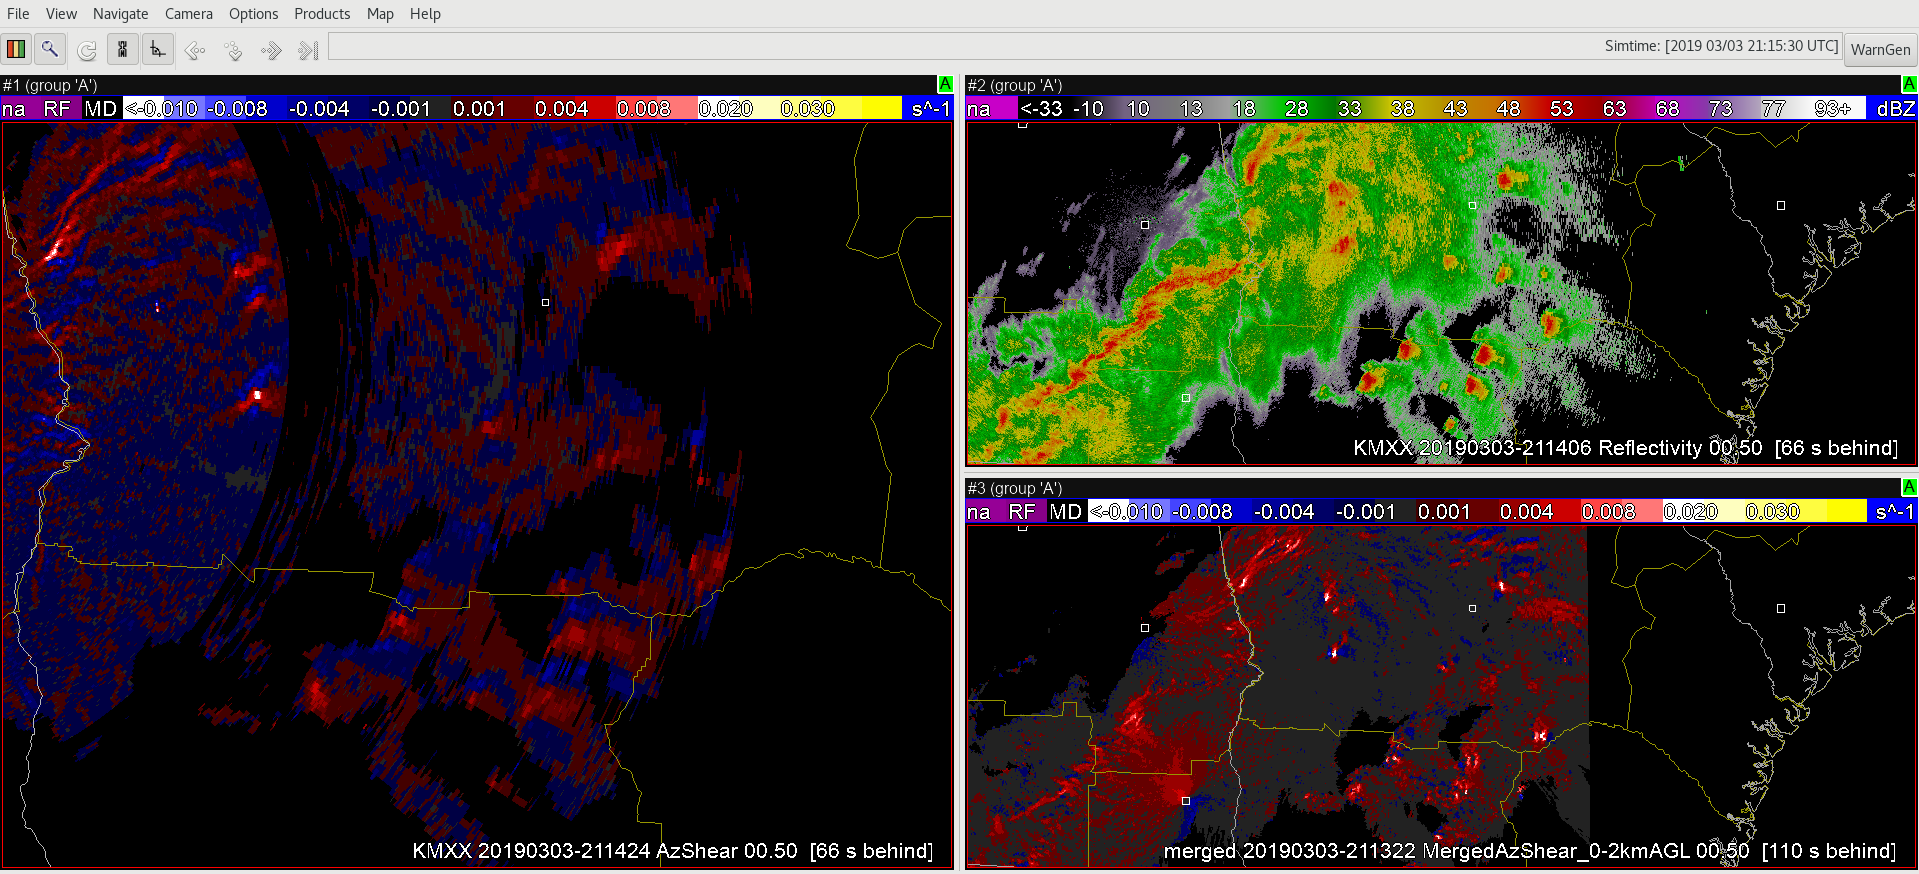
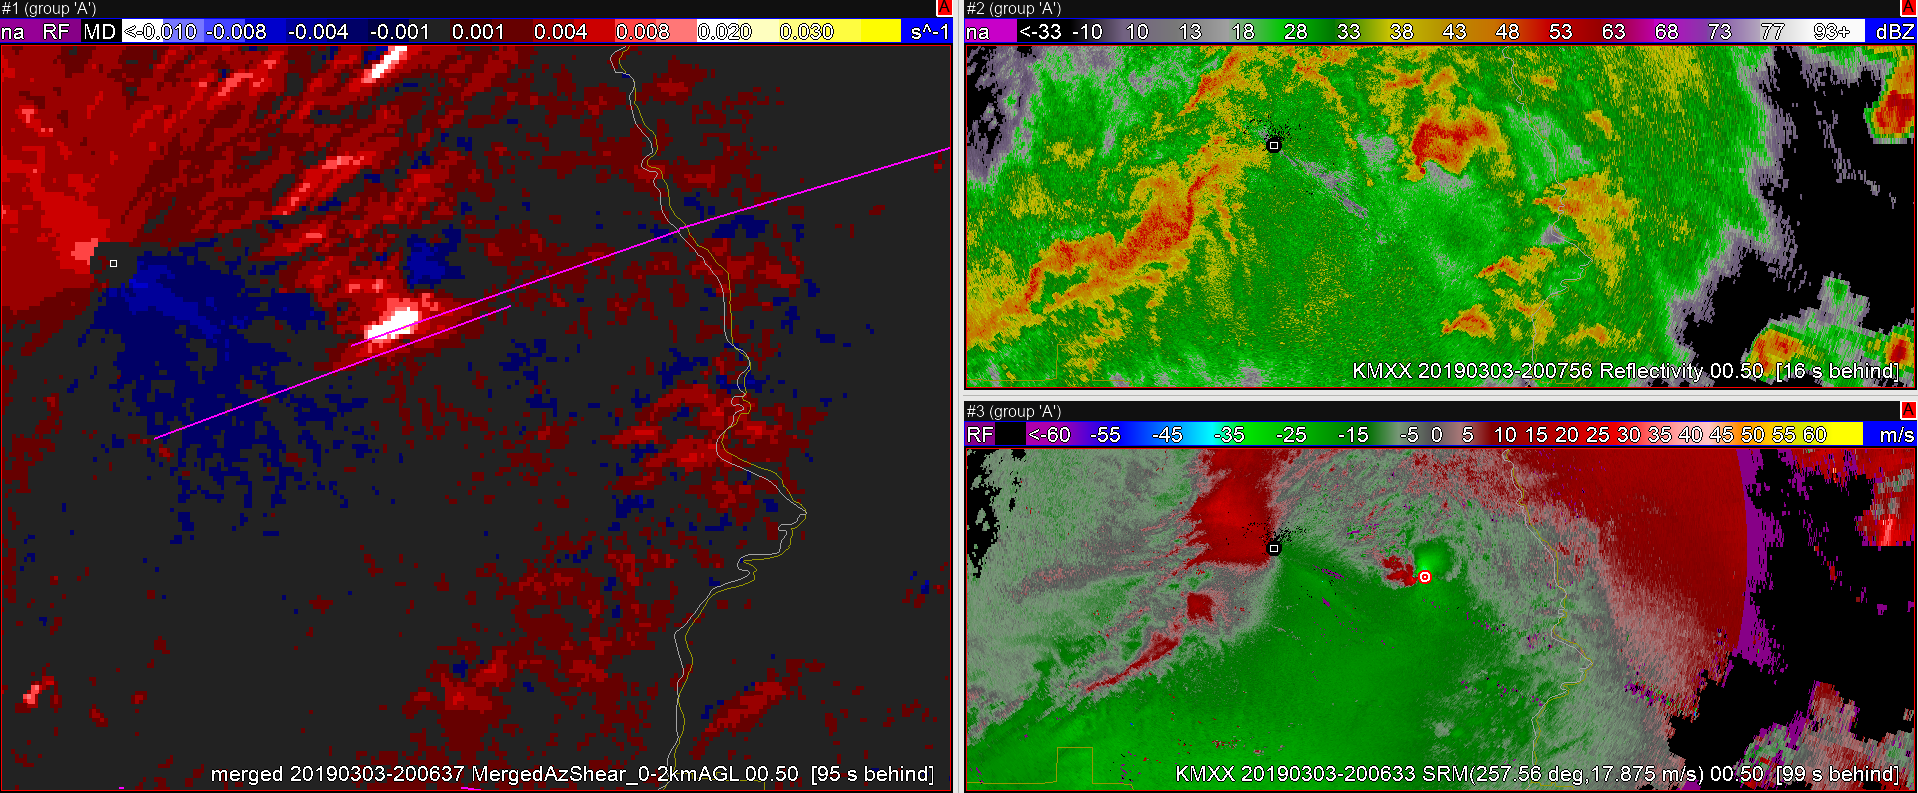 Merged 0-2 km azimuthal shear provided an accurate location of the meso/tornado and washed out the negative shear signal from the KMXX data. The shear values are lower than the single radar data.
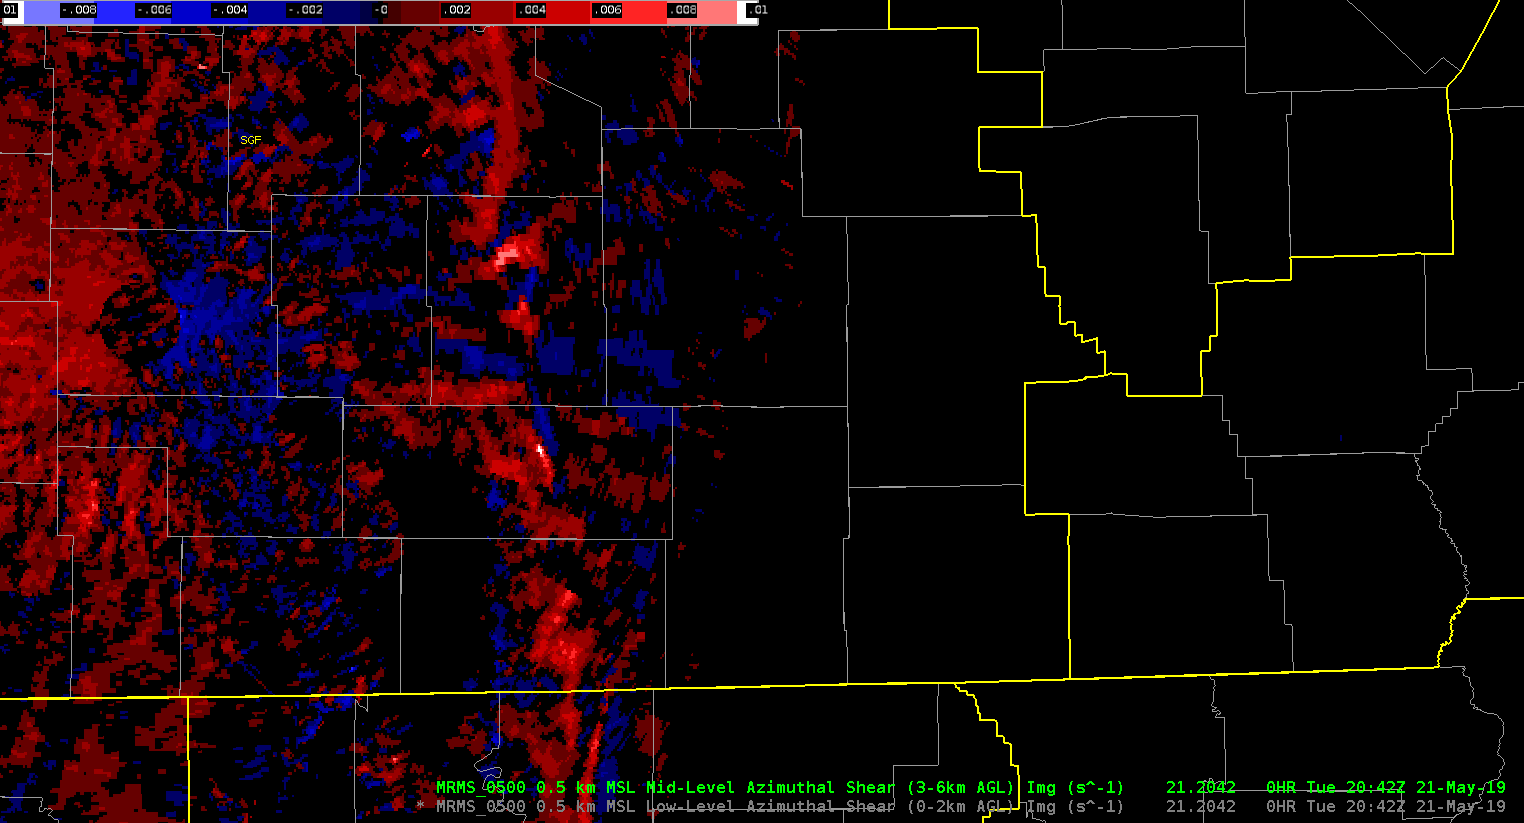
 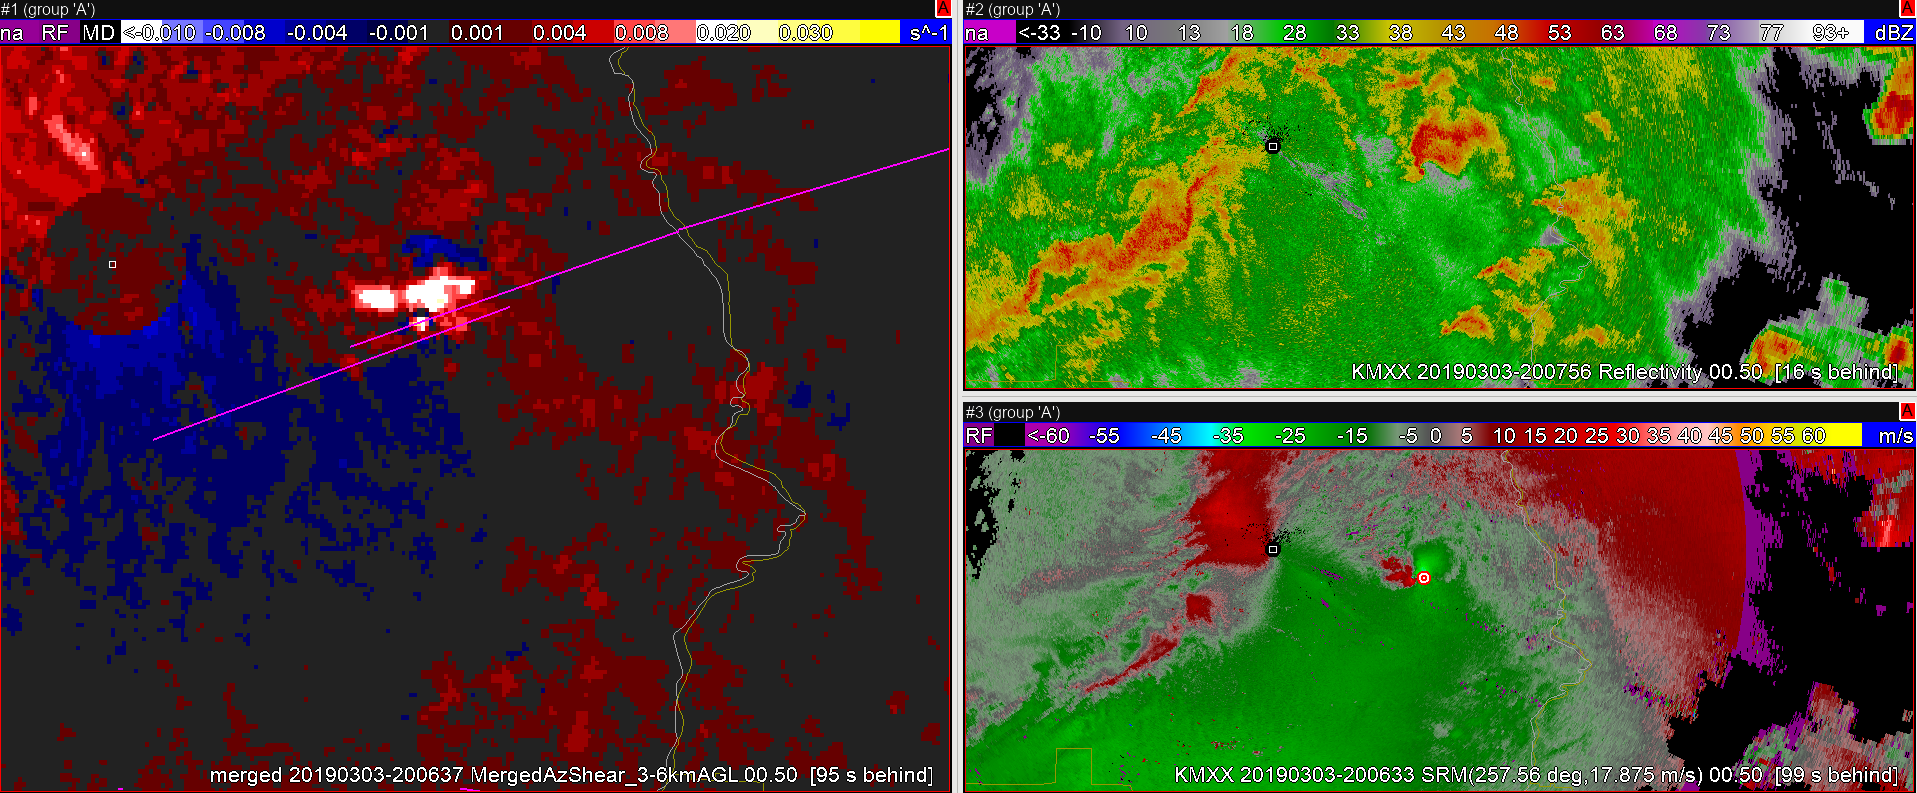 Merged 3-6 km azimuthal shear is displaced to the north of the tornado path (pink line).
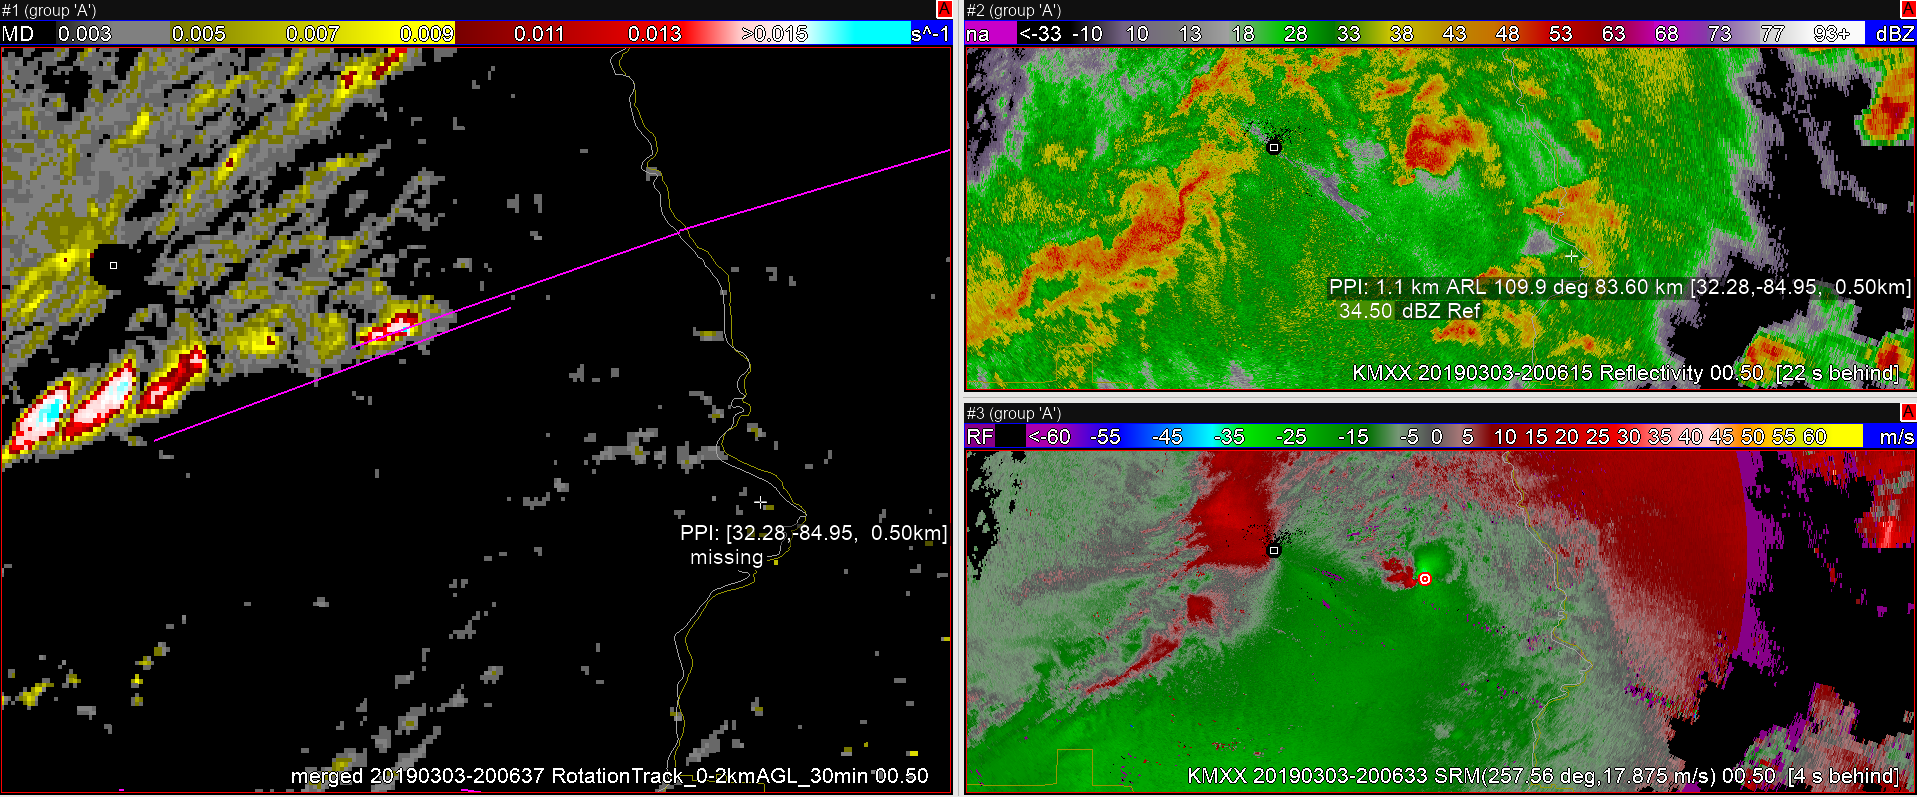 The merged 0-2 km rotation track has a very nice color scale (yellow to red to cyan) — key features really stand out.
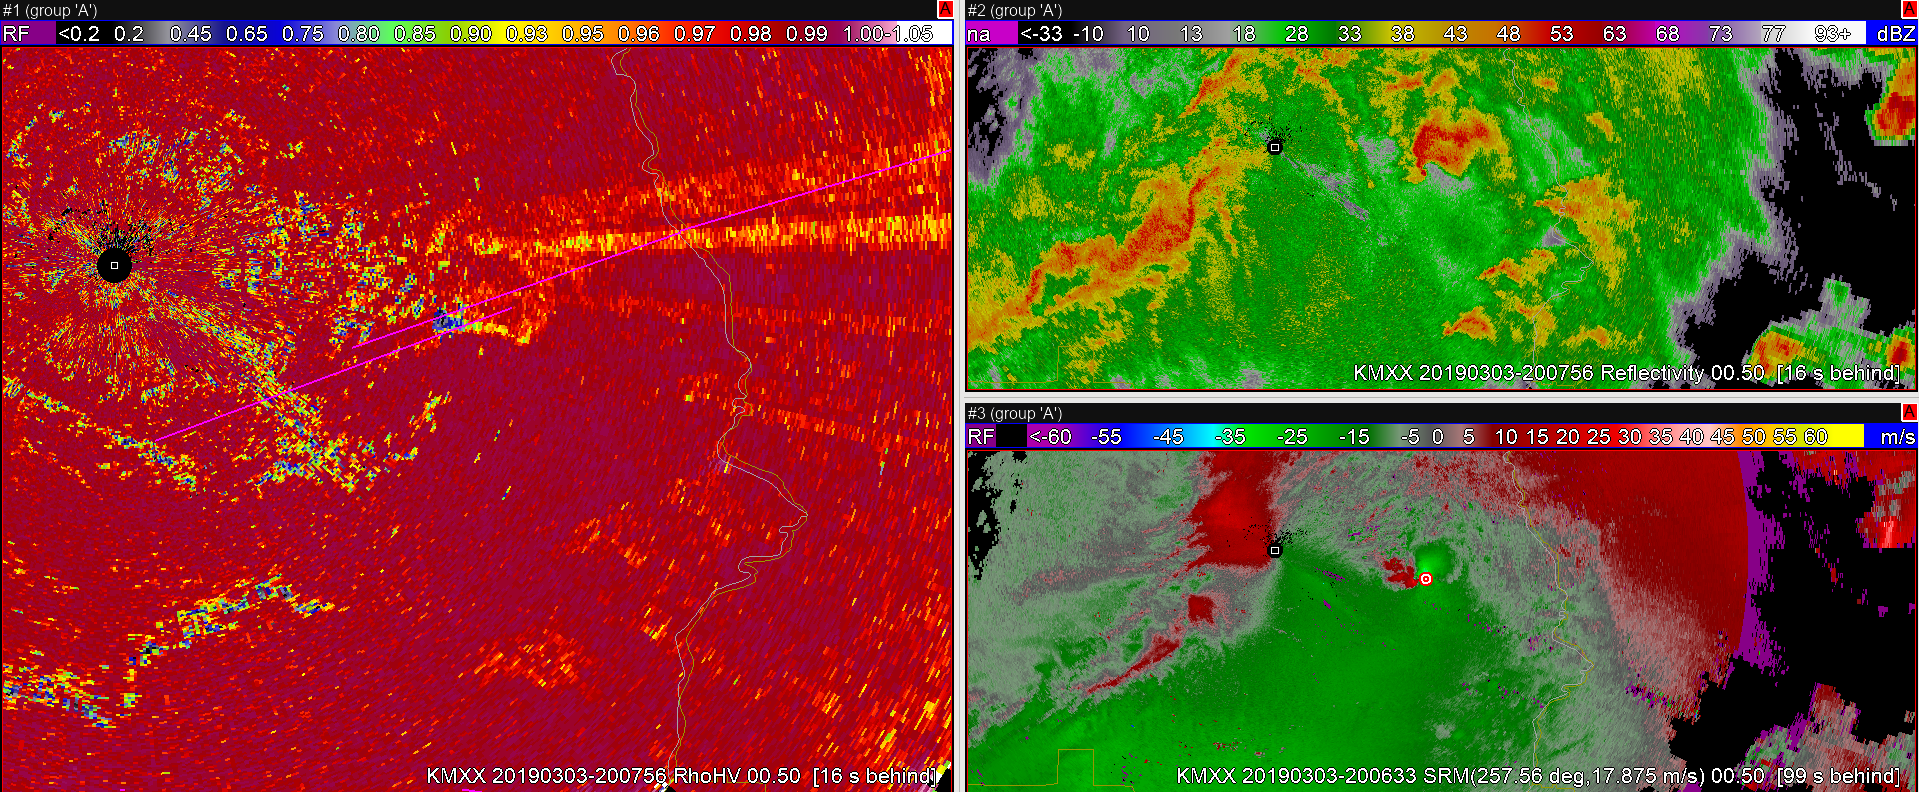
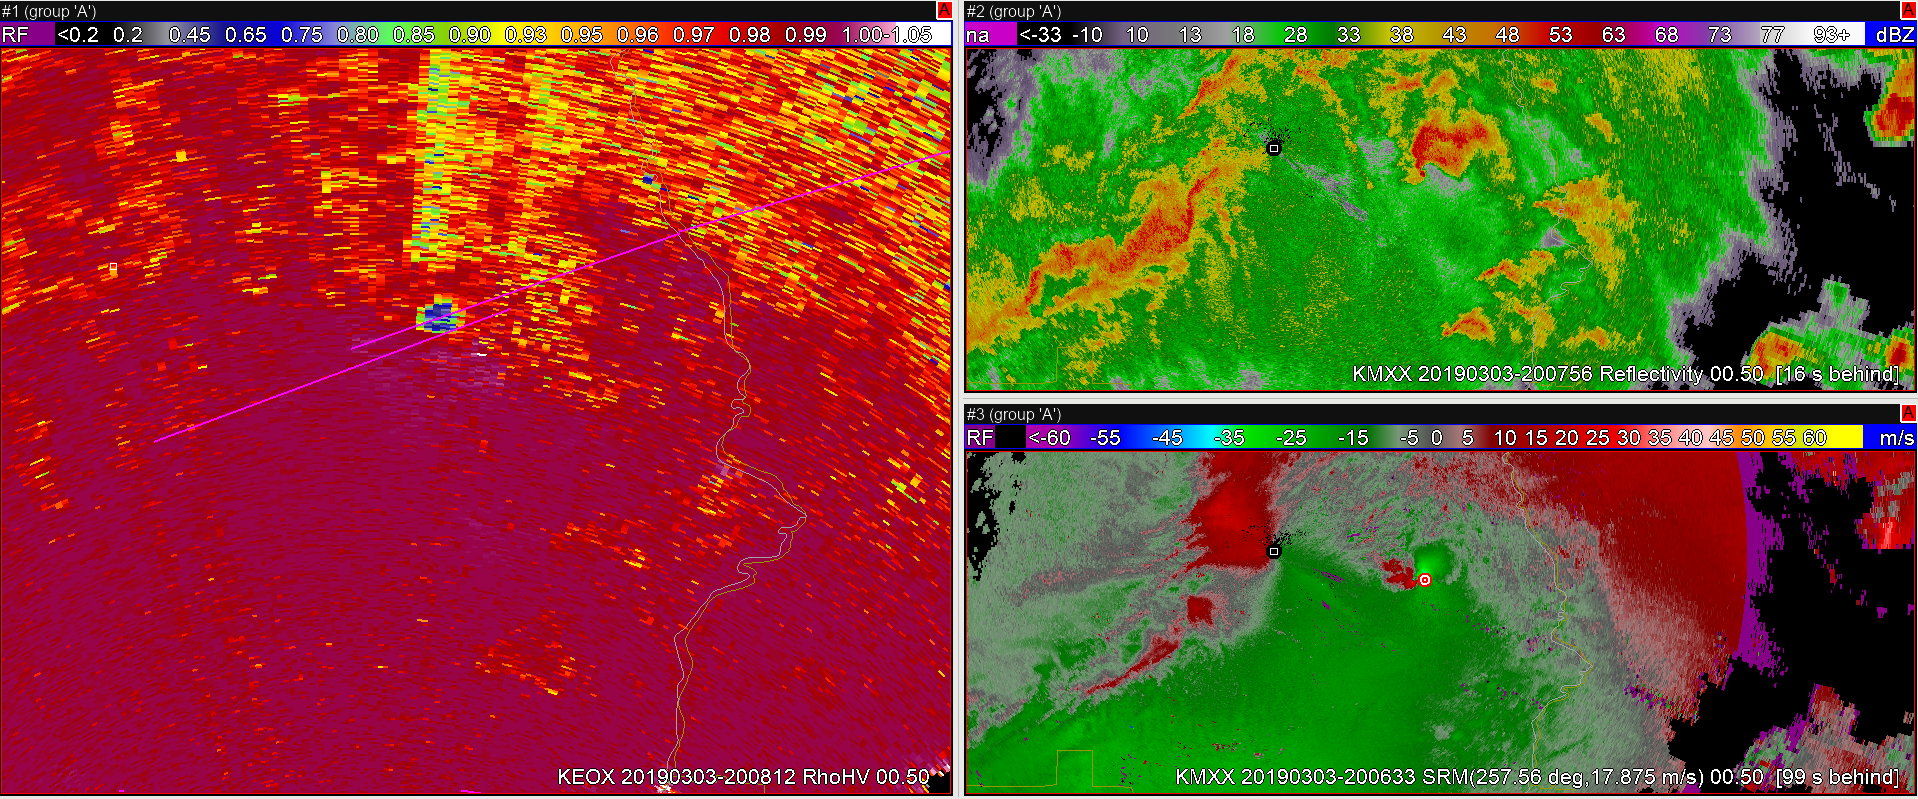
CC plume or TDS were present on both radars. – Roy
 -64BoggsLites
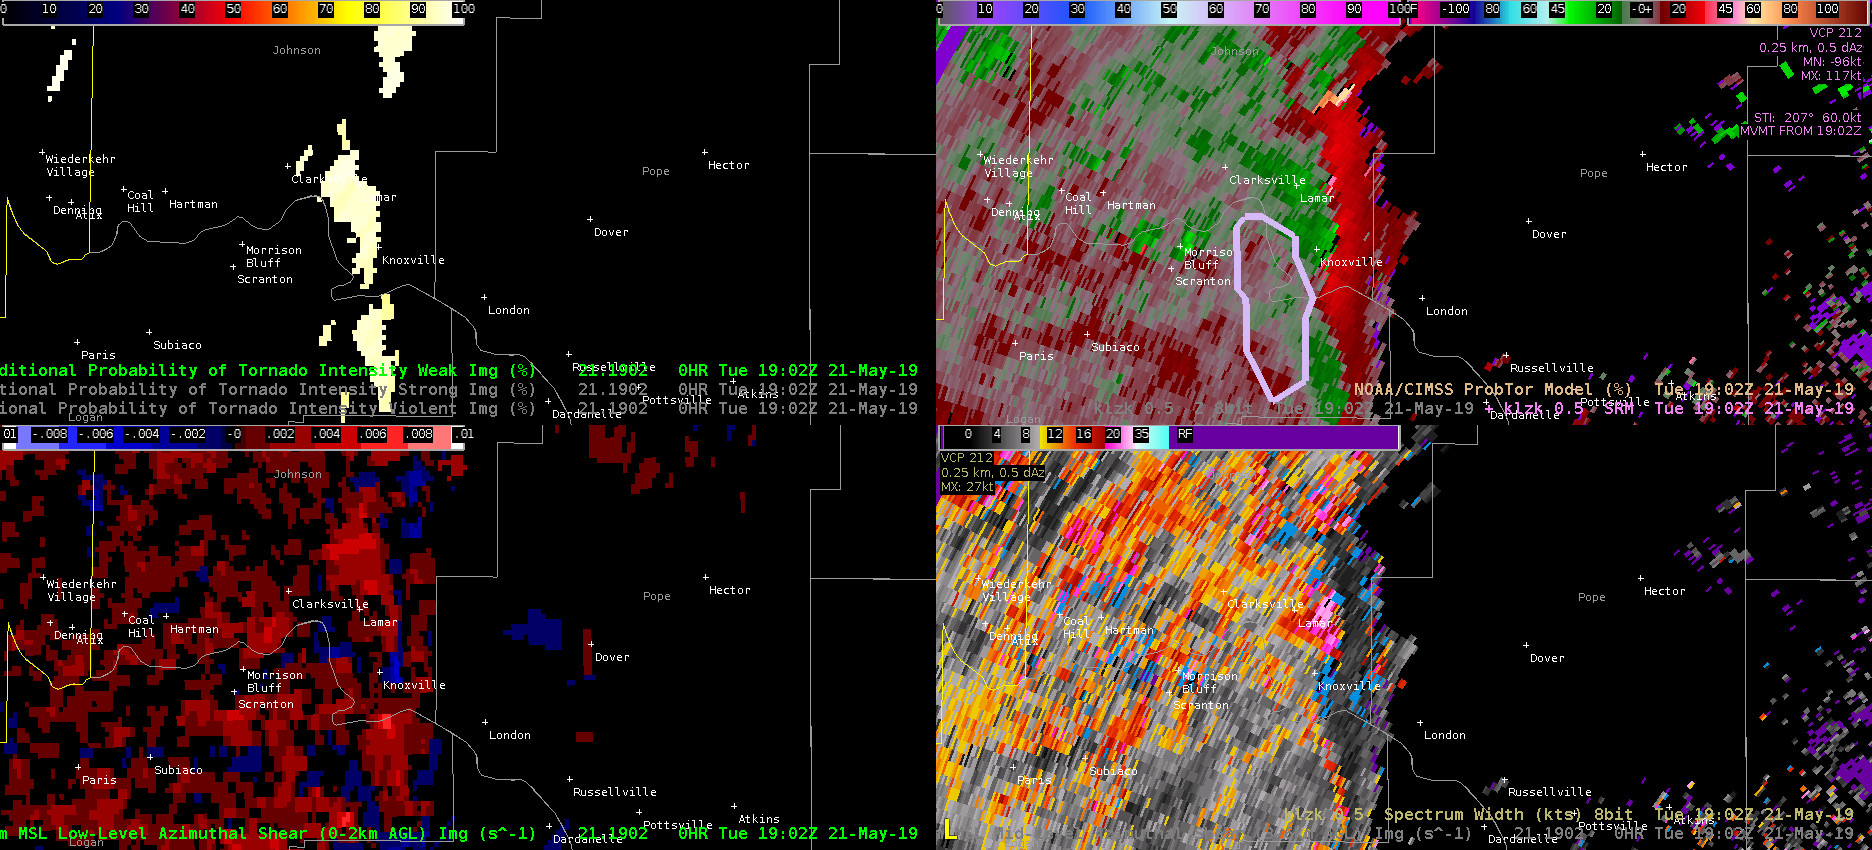
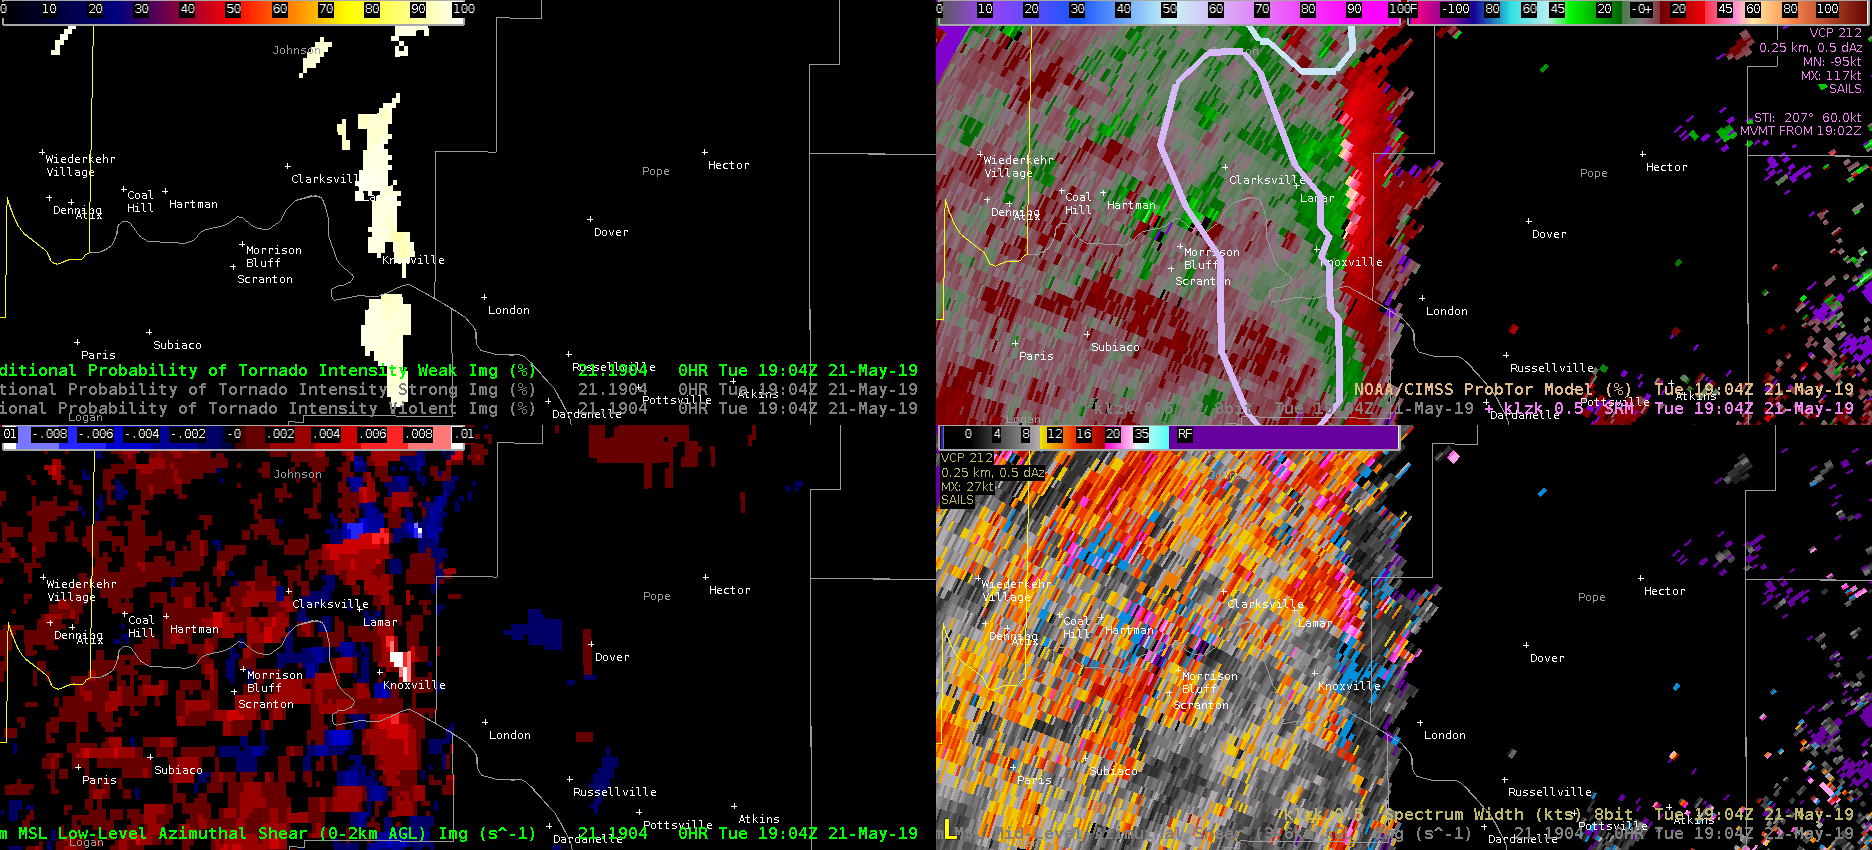
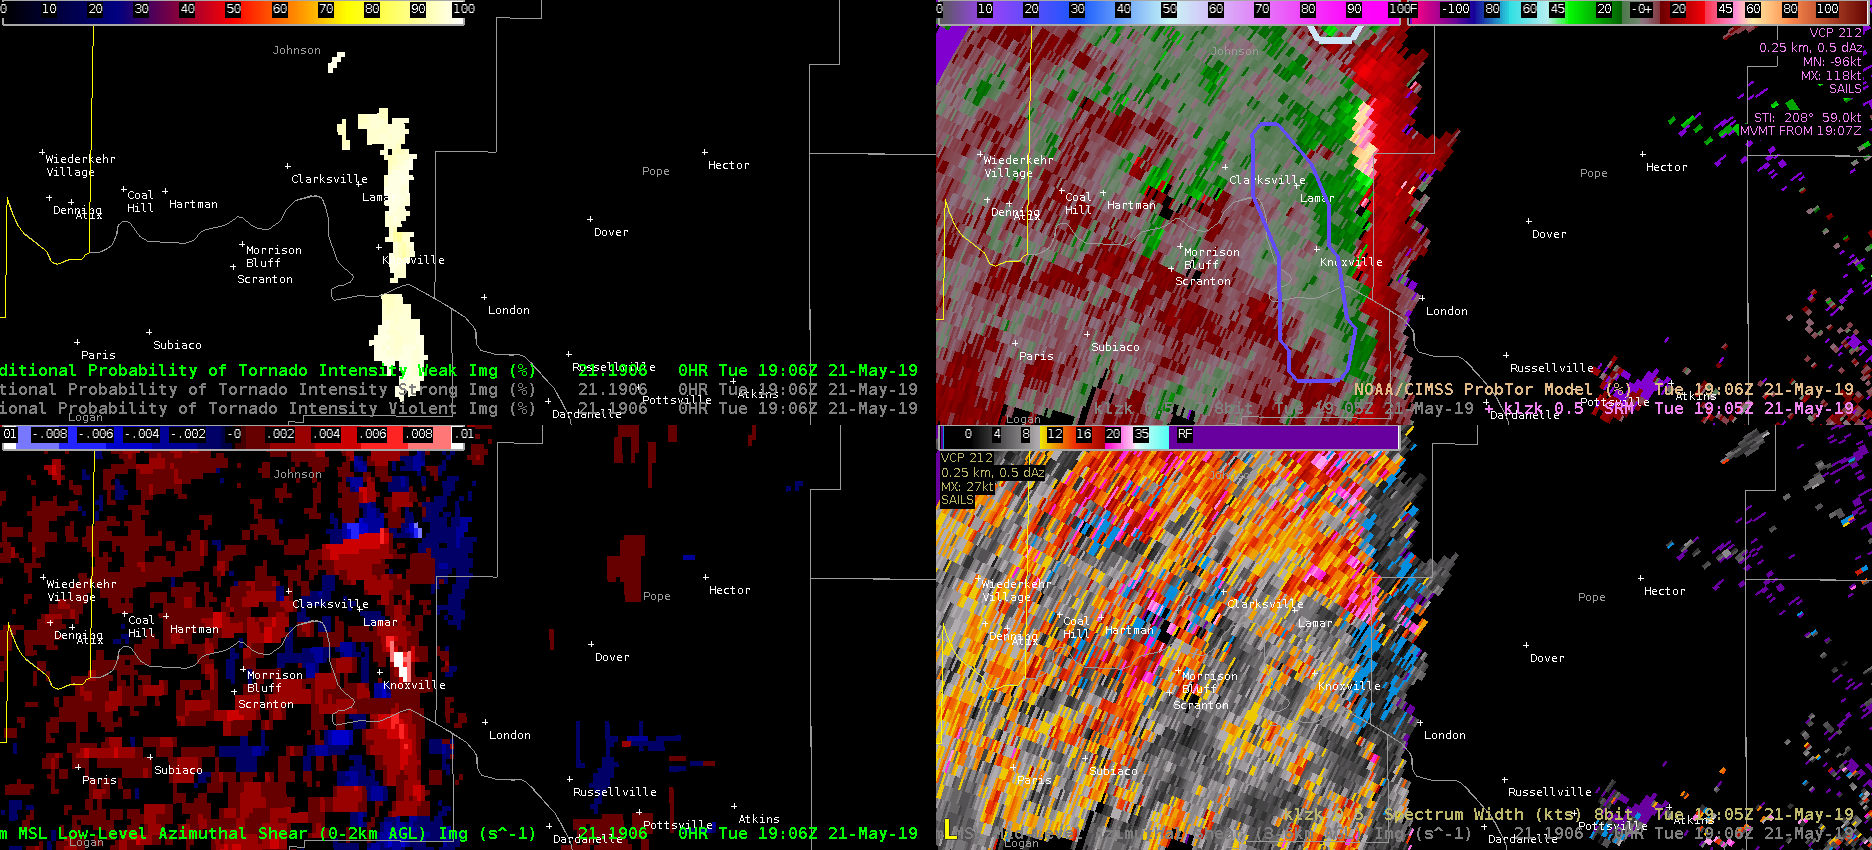
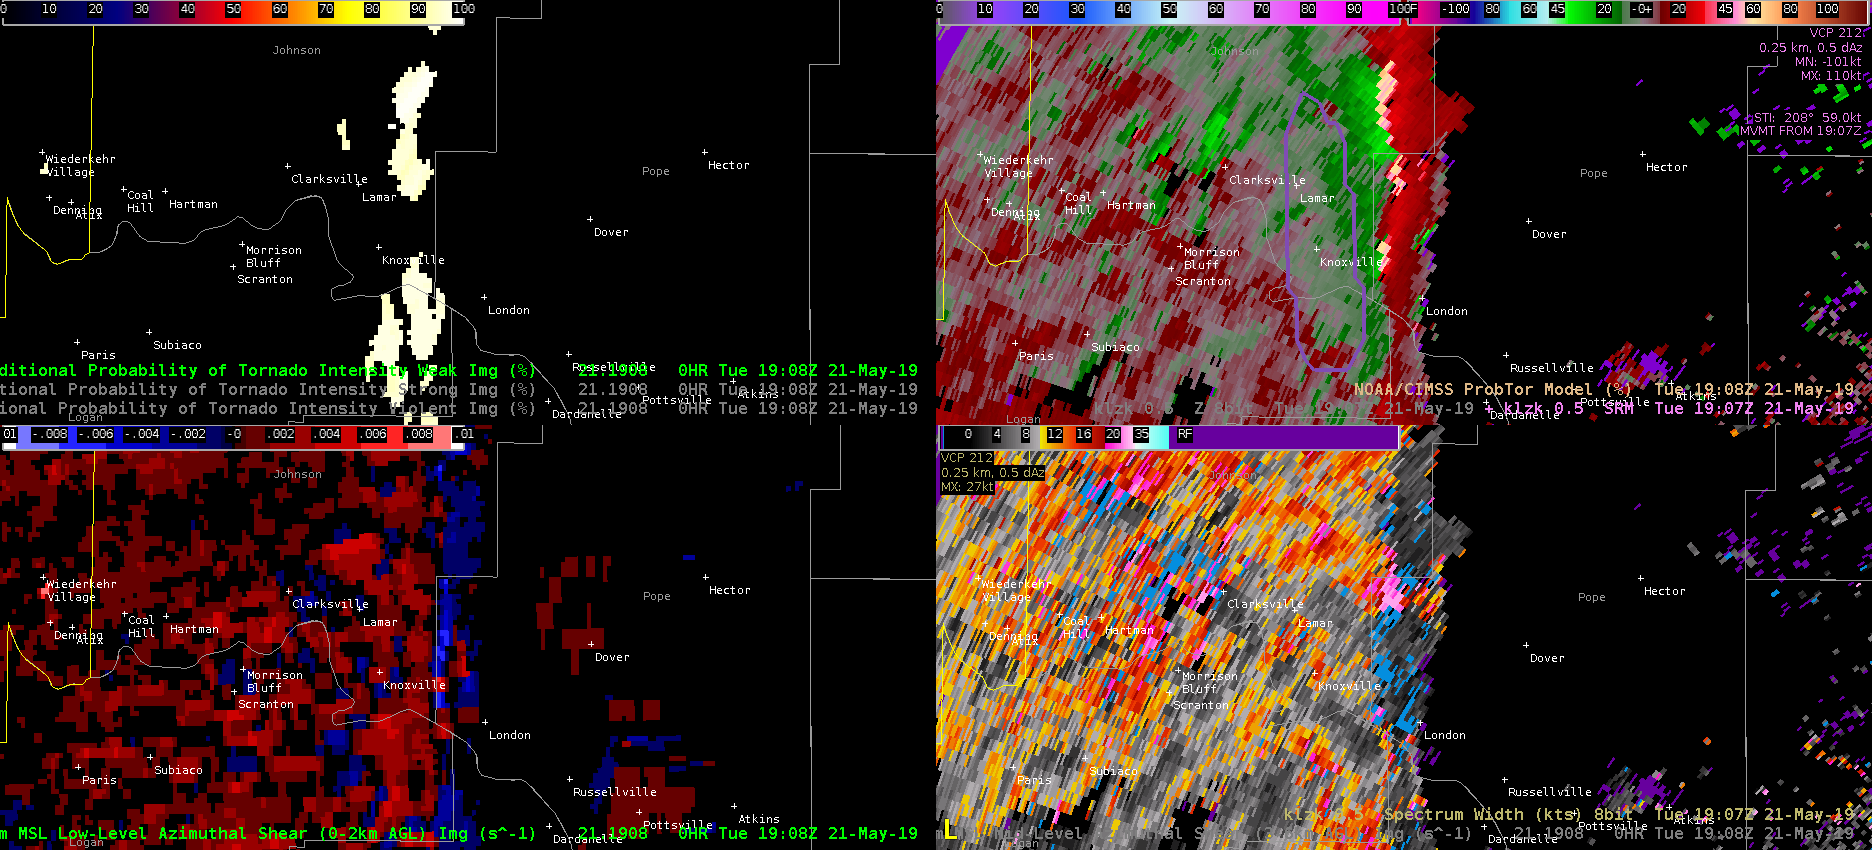
 The MRMS AzShear product produces multiple areas of rotation as it tries to ingest 0.5 degree SAILS scans. The animated gif above is from WFO TOP late Tuesday afternoon as a tornadic circulation moved north of I-70. The AzShear algorithm easily identifies the area of rotation, however during SAILS cuts it breaks the rotation into multiple areas rather than moving the entire circulation forward with each time step. This may be due to only the lowest scan being available for AzShear during SAILS cuts, but it makes the product look disjointed and unrealistic. While this may be easy to ignore in discrete supercell mode, the AzShear output could be confusing if SAILS were deployed in situations that may have numerous areas of weaker rotation and/or shear zones, such as a QLCS/MCS.