Pocatello Storms

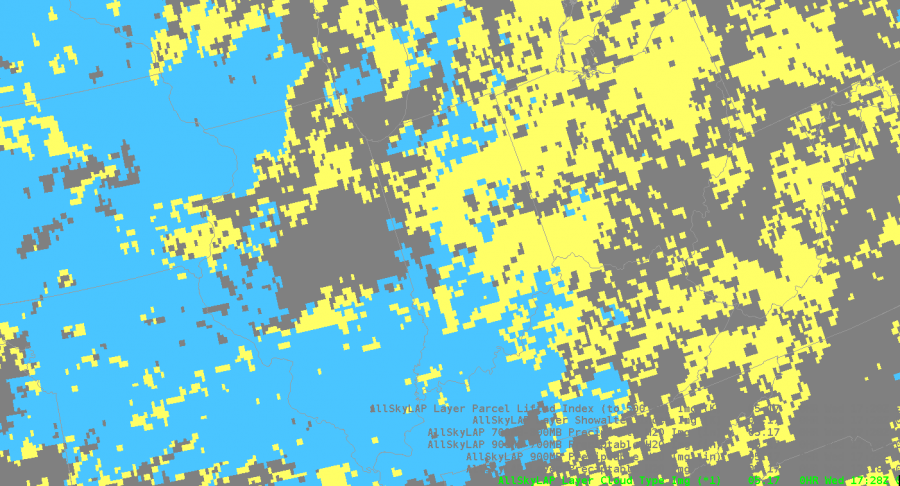
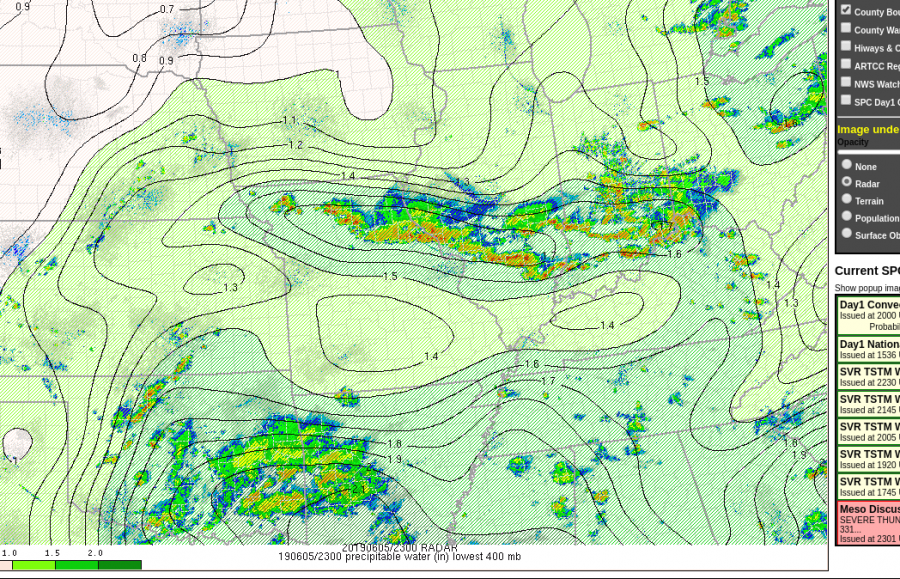
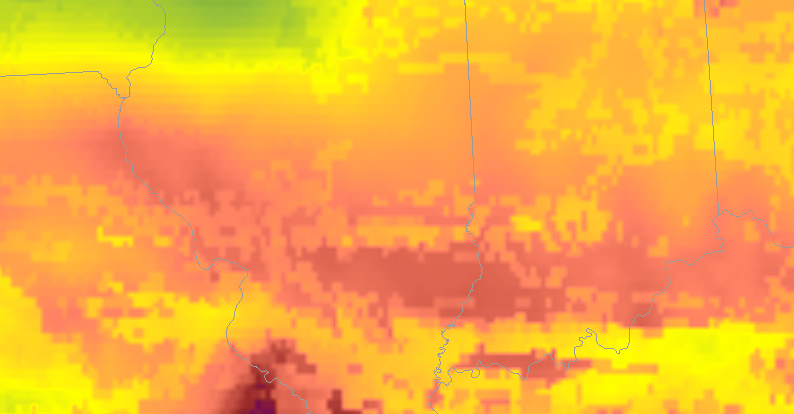
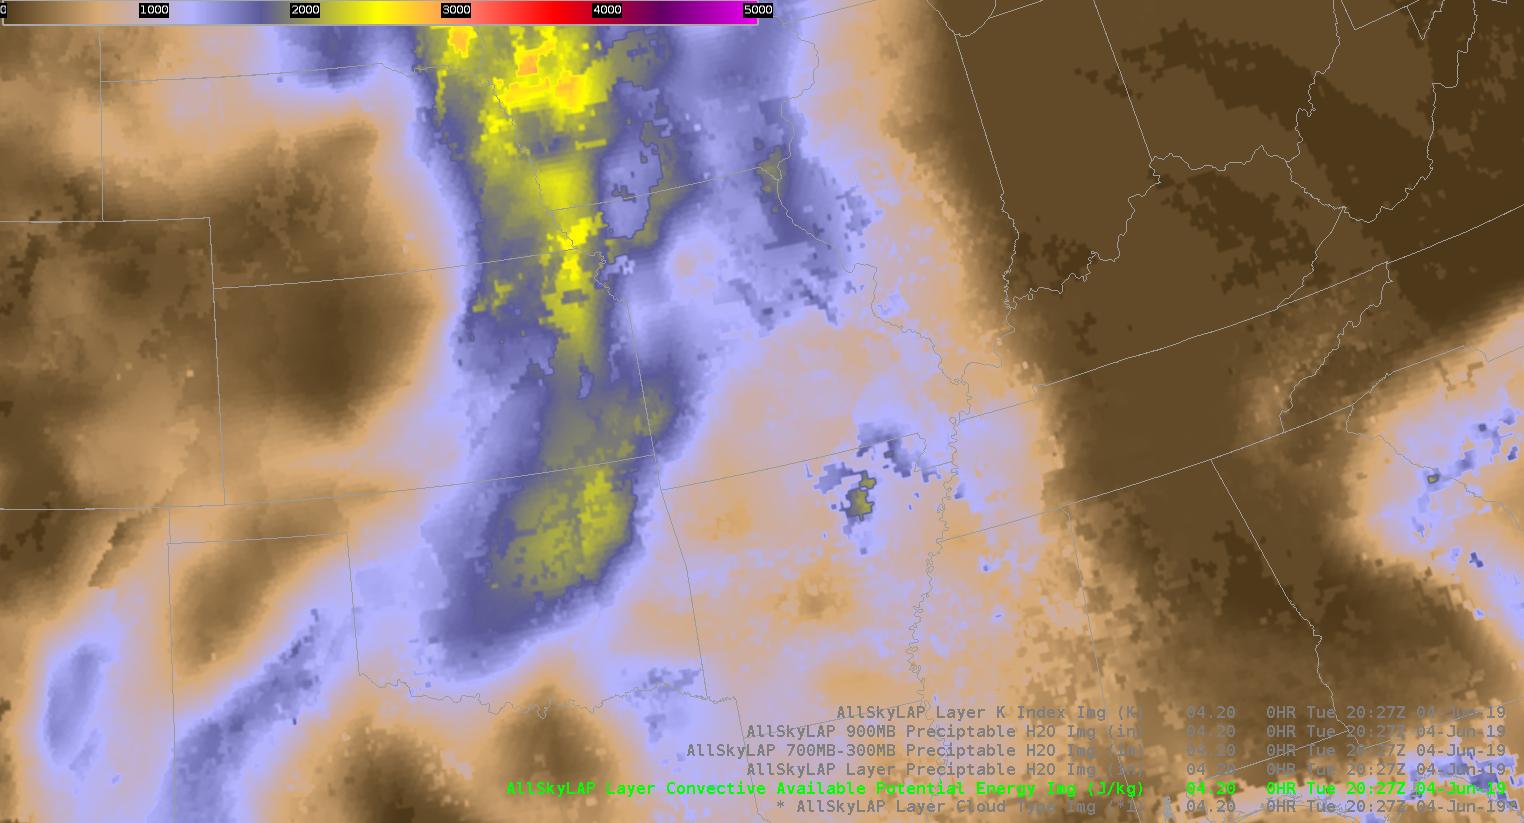
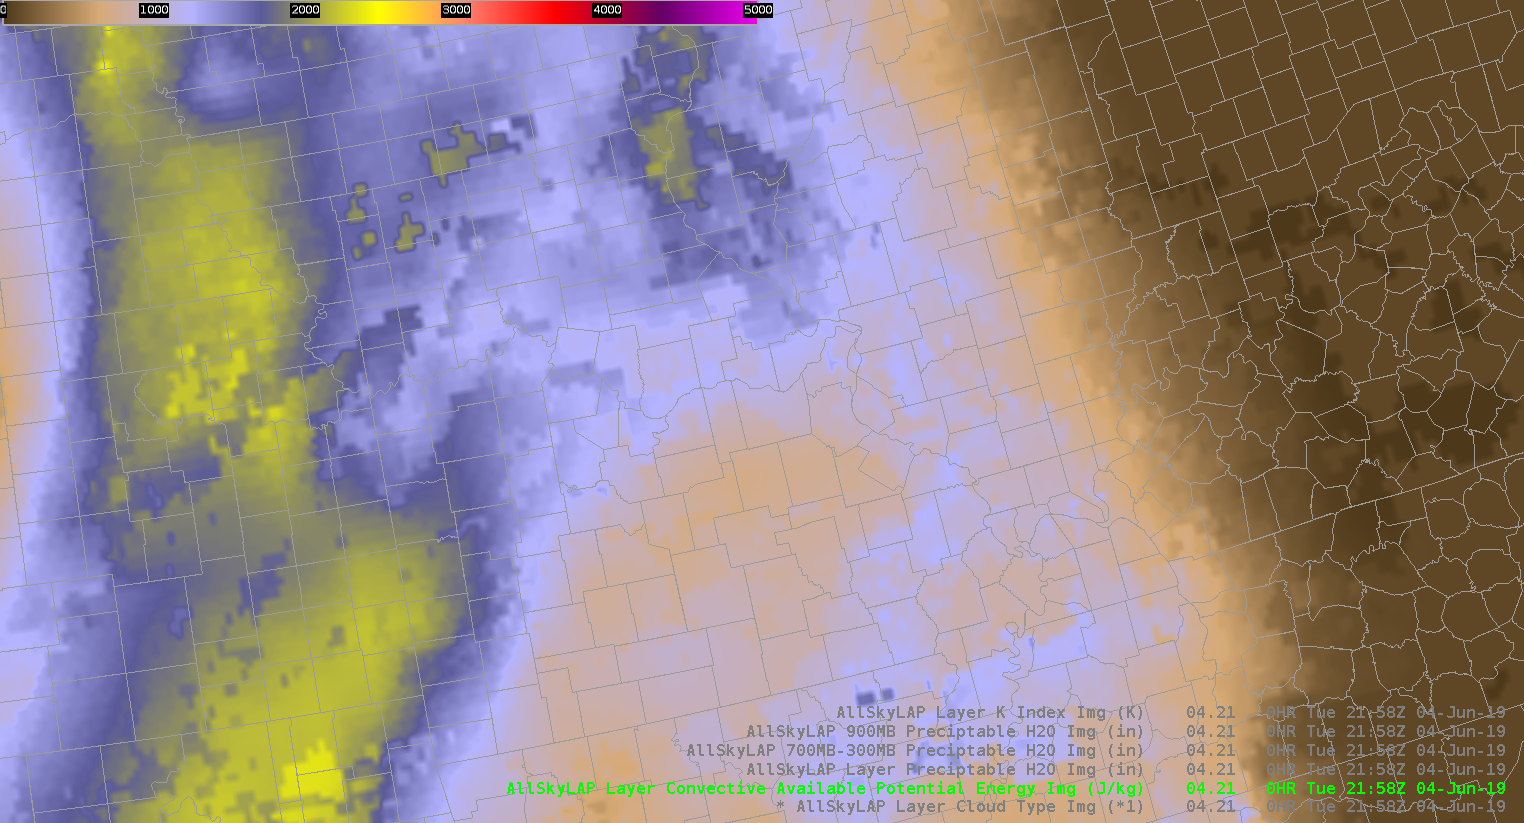
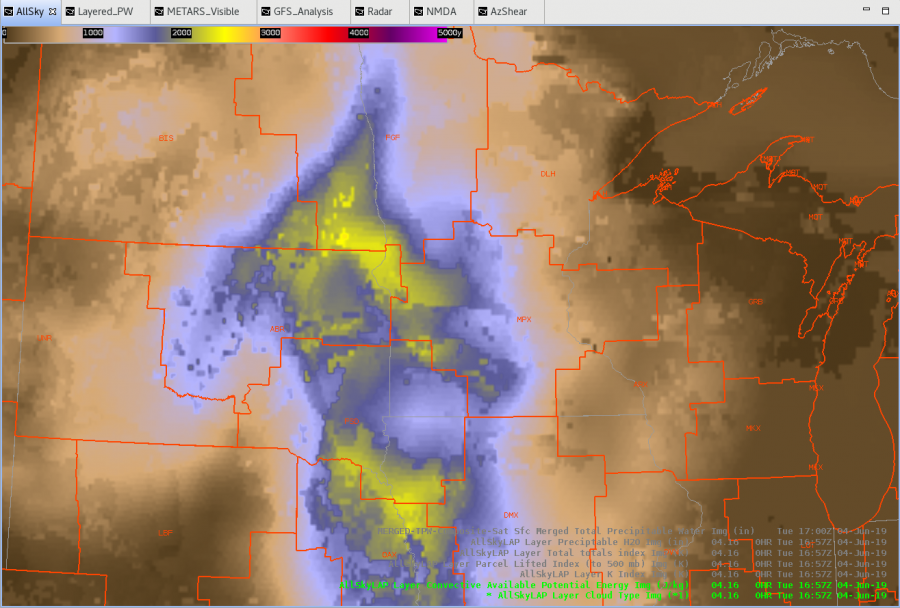
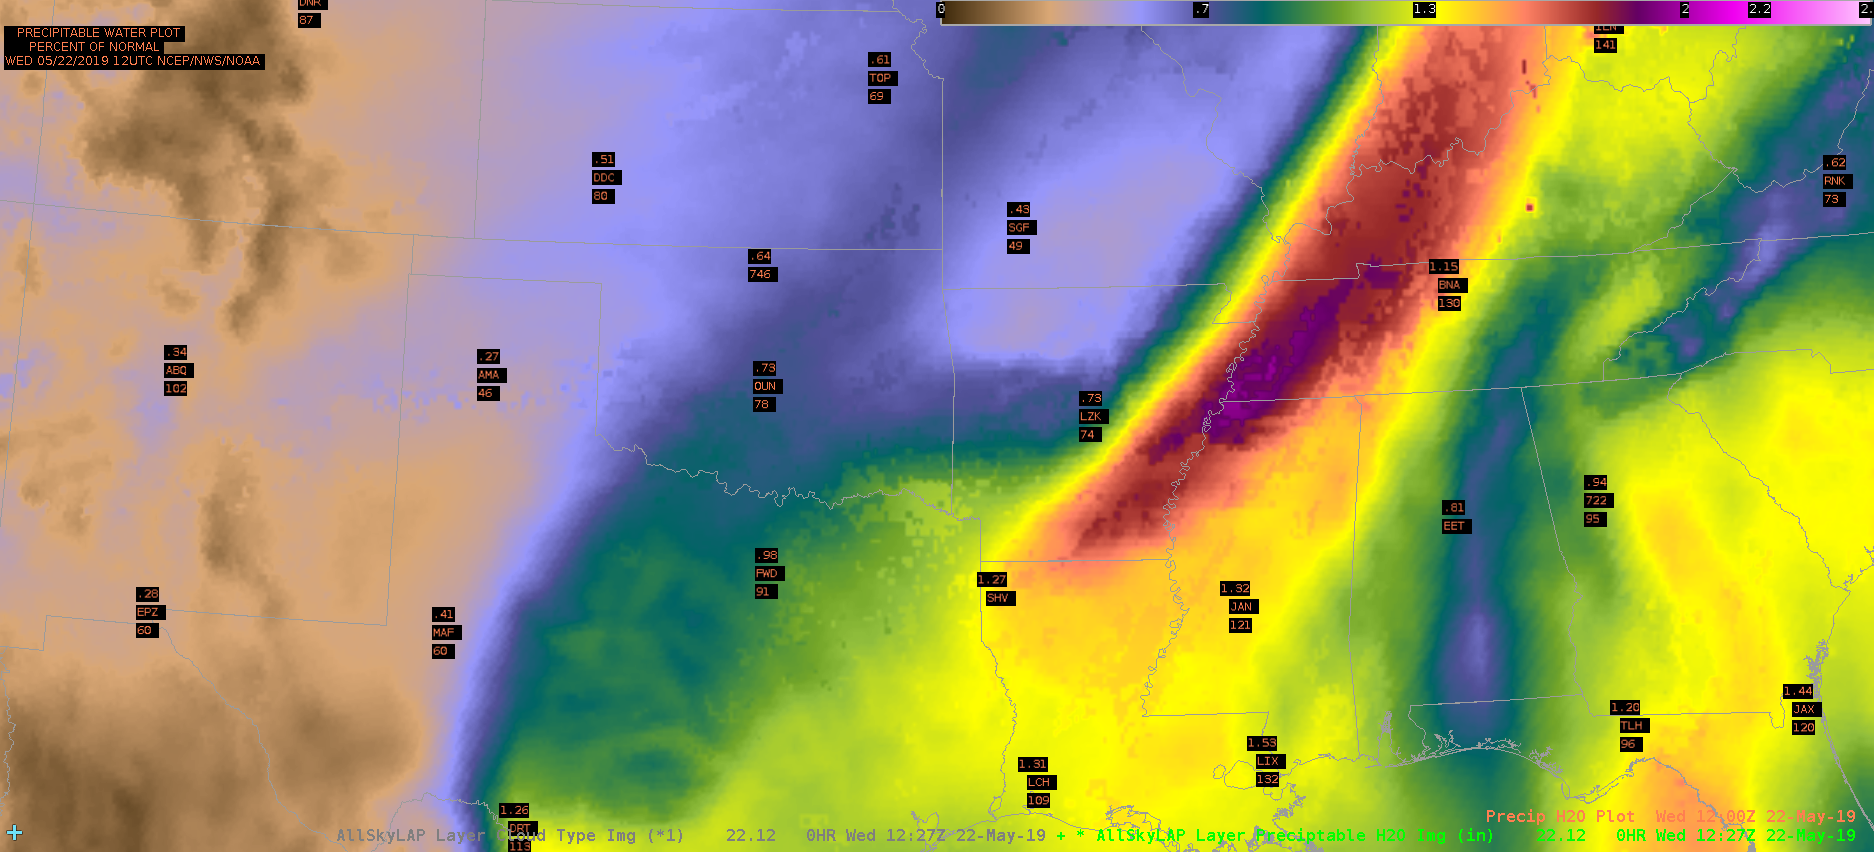
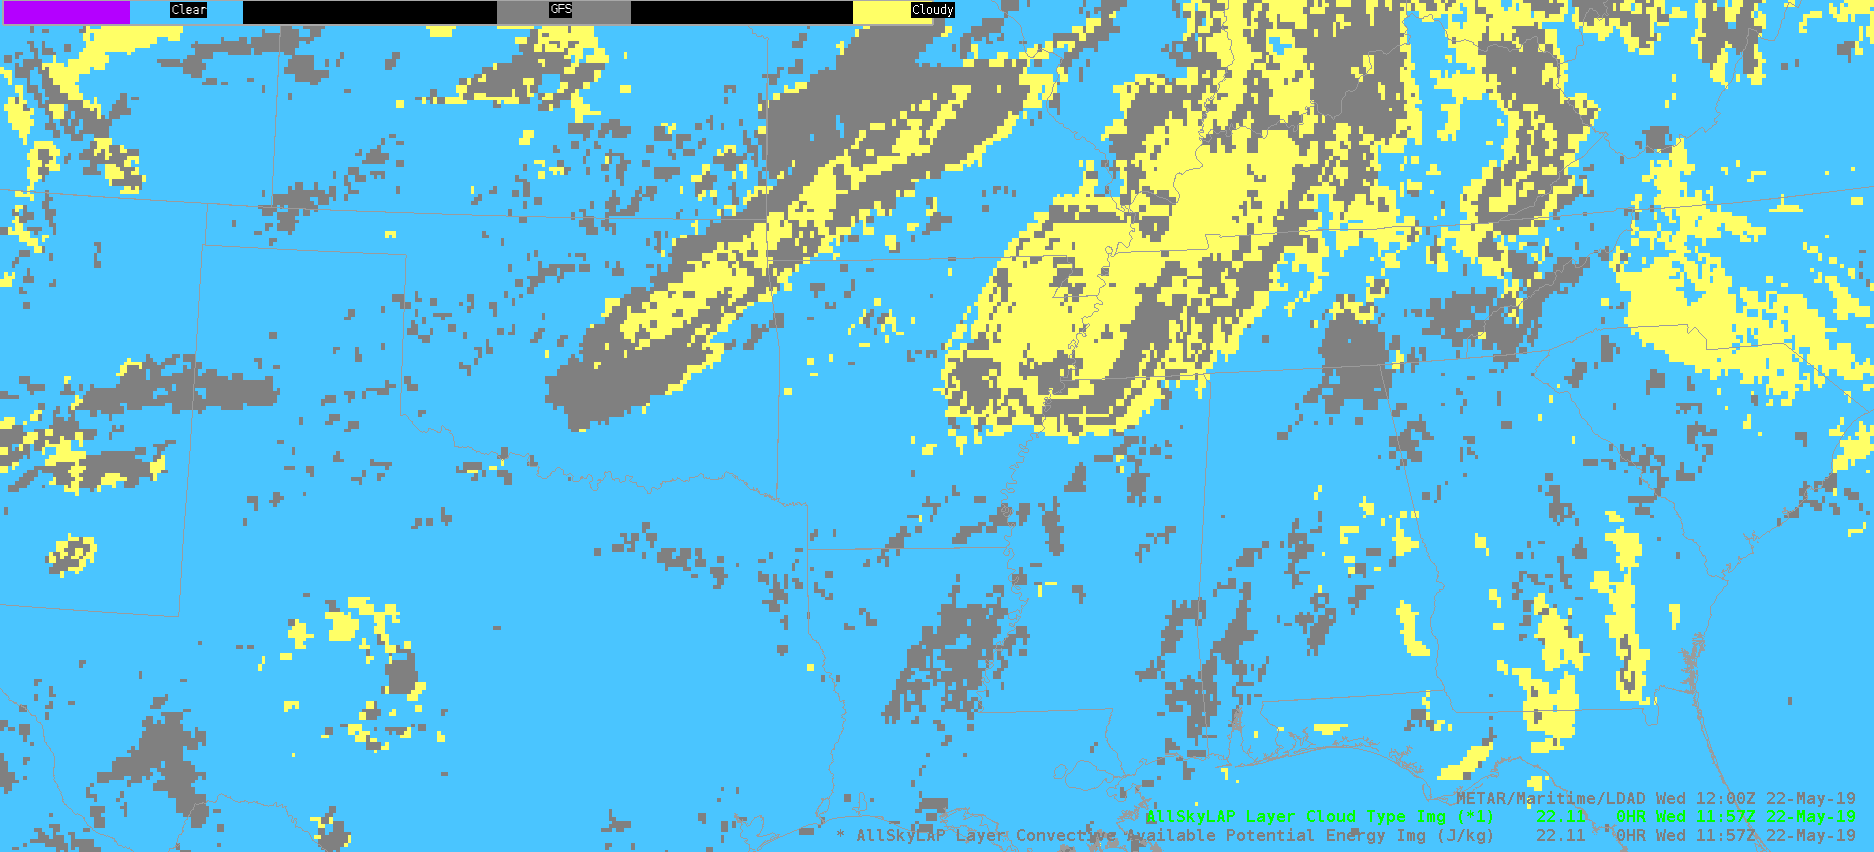
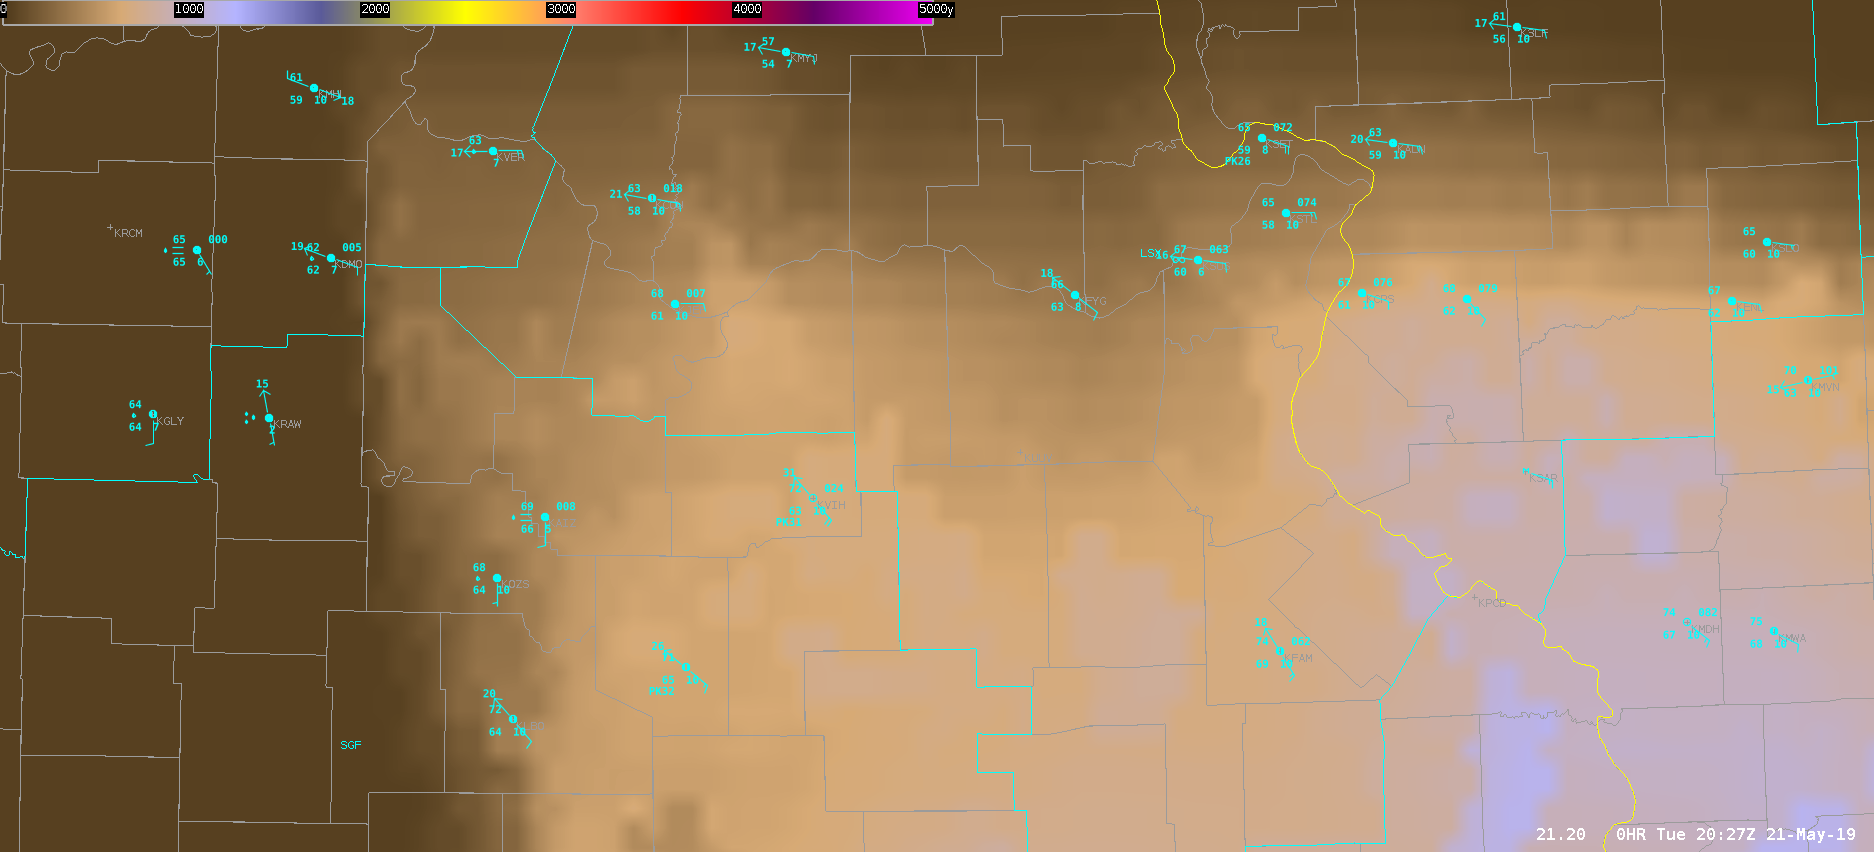
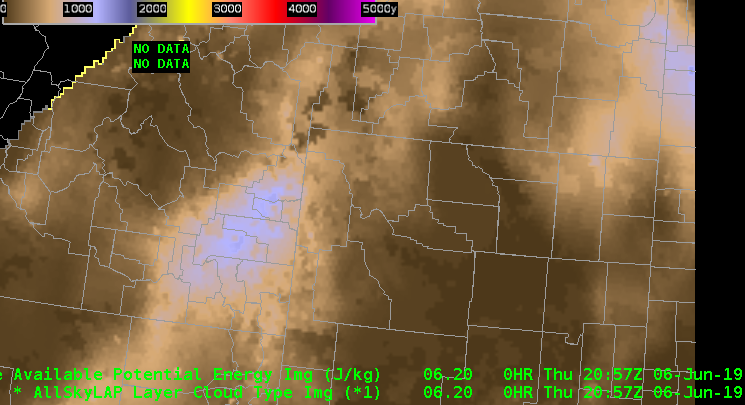
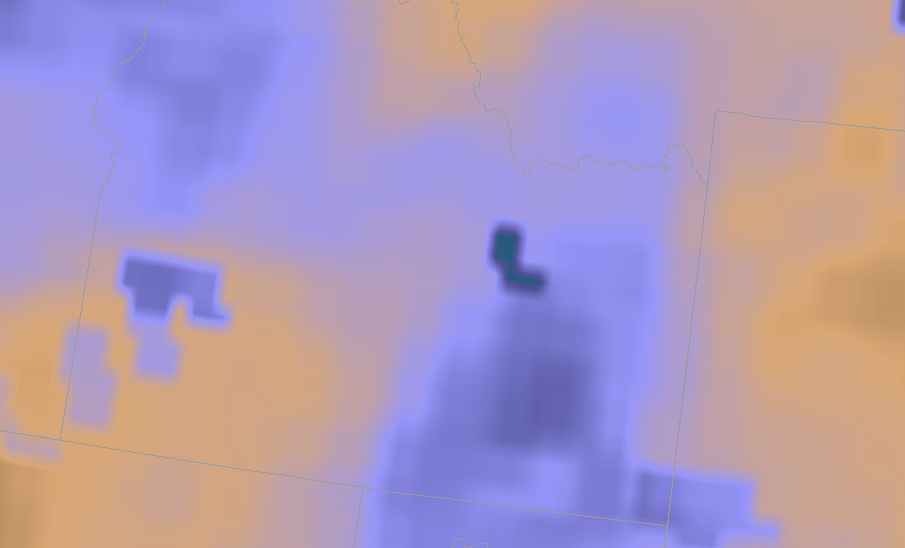
We’re currently monitoring conditions in eastern Idaho. Right now I’m using various applications to analyze and initialize current conditions. Currently AllSky is showing cape around 1000kj, and PWATS around .80 inches.

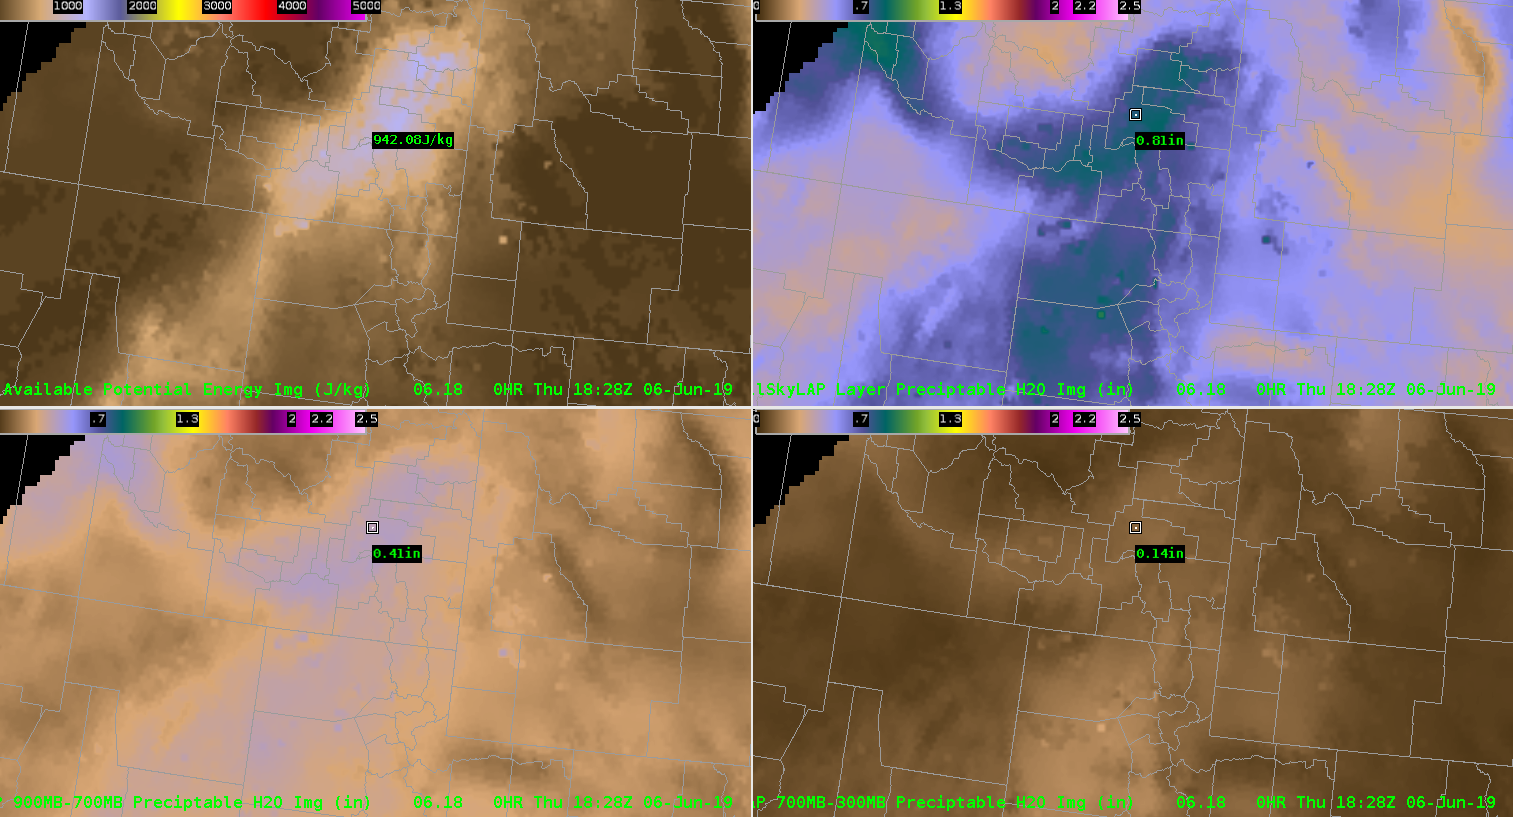
That PWAT value on the morning sounding just west of the area was close to .64″. Seeing how moisture levels are lower to west I can interpolate that the moisture values are similar to what’s show on allsky. The allsky 900-700mb also seems to pick up on the relatively moist area in the lower half of the atmosphere.

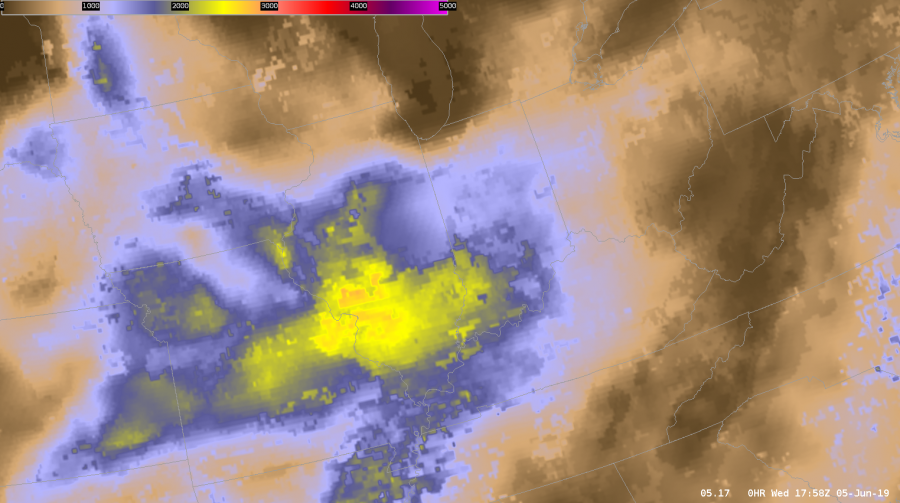
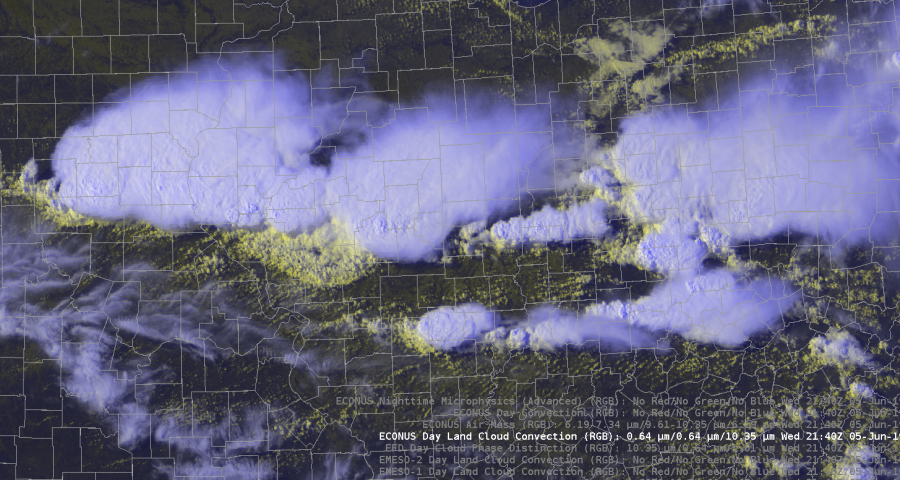
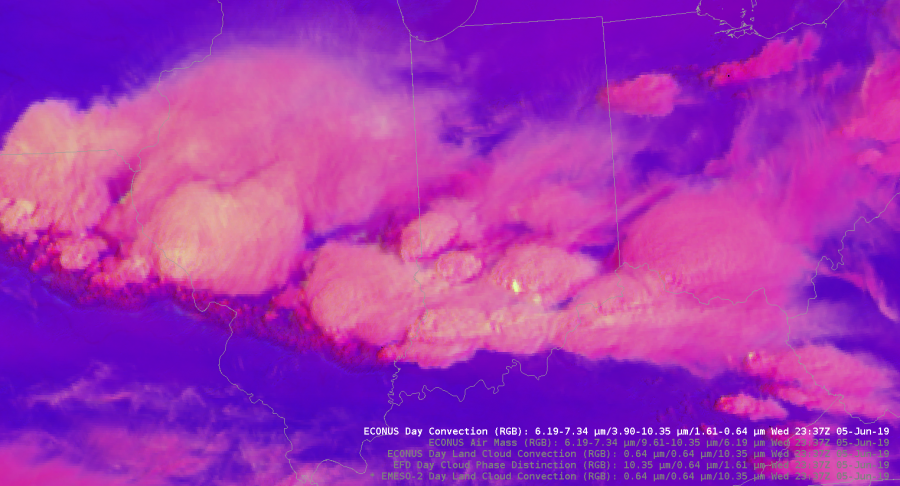
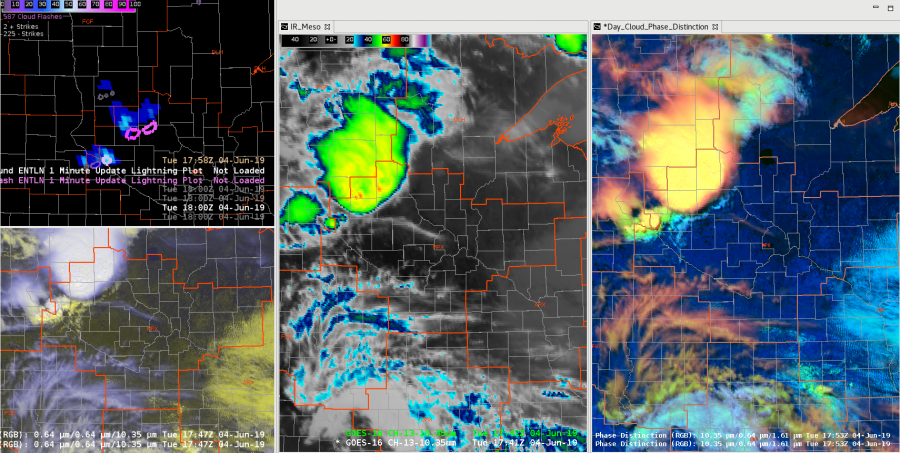
Looking downstream we’re noticing a line of developing convection using the Day land cloud RGB. It’s helpful to analyze just how high the tops of the storms are getting combined with cloud tops.

Zooming in closer I can examine the few storms that have popped up more closely. The RBG help the differentiate between the ambient cirrus clouds from the growing storms. That might not have been as easy to see using a typical visible view.

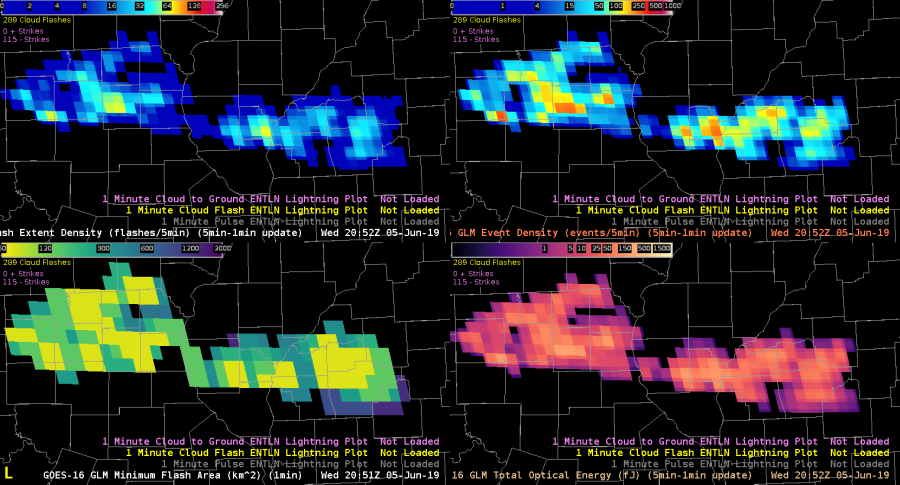
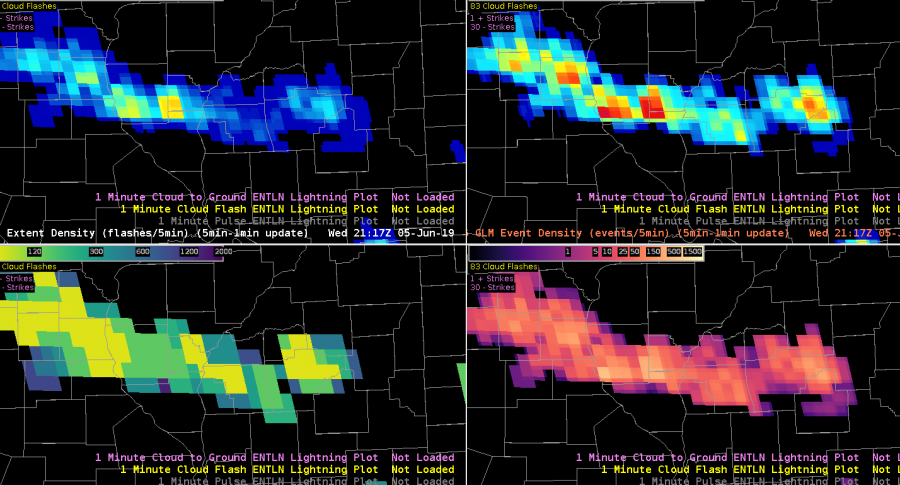
The AFA and Minimum flash area maximums are hinting at growing convection just downwind.  That growth leads to me to anticipate further intensification as these storms move into a more favorable environment in eastern Idaho.

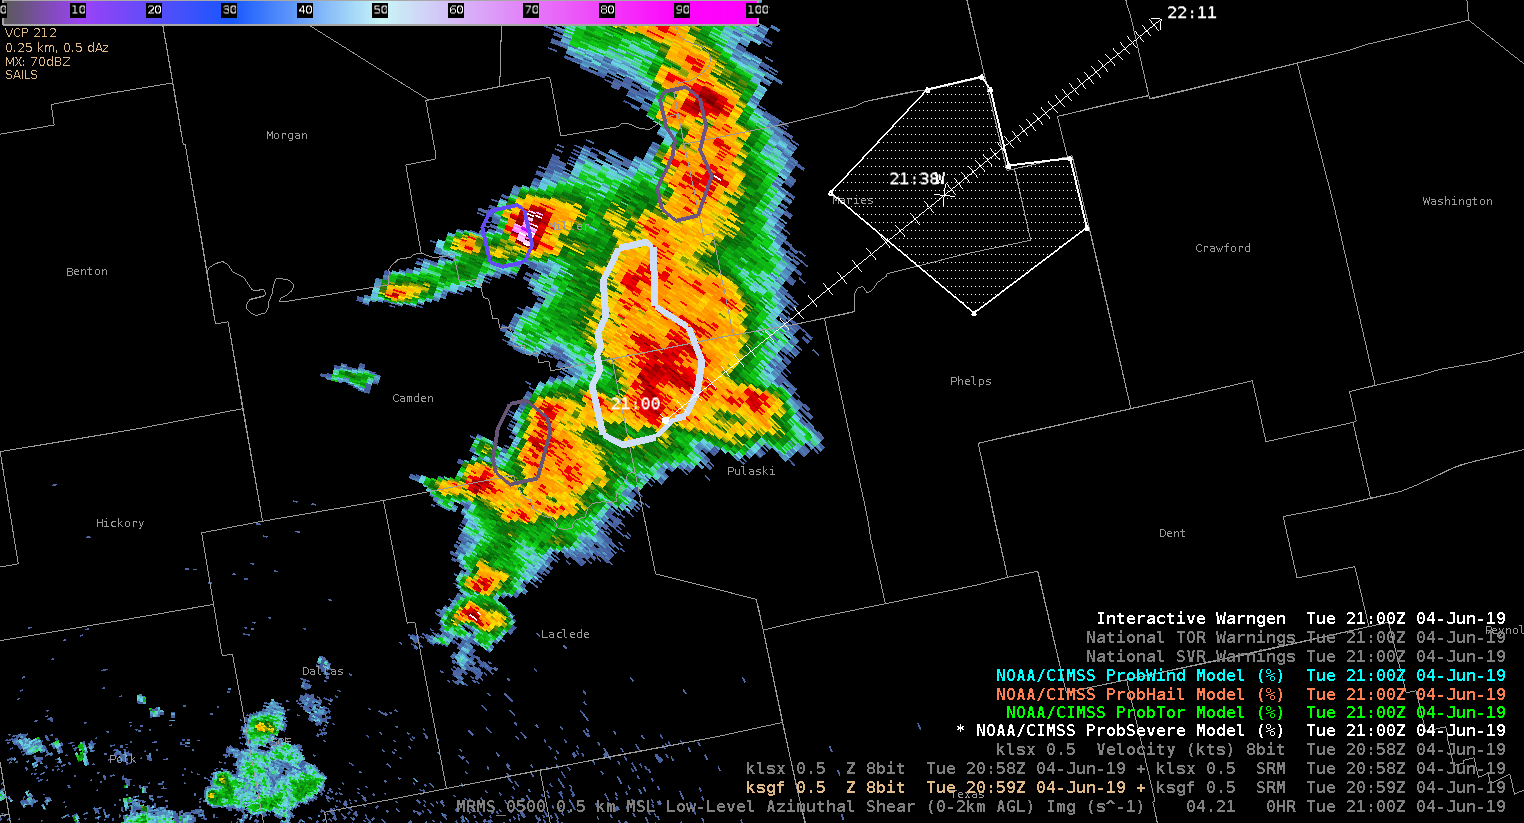
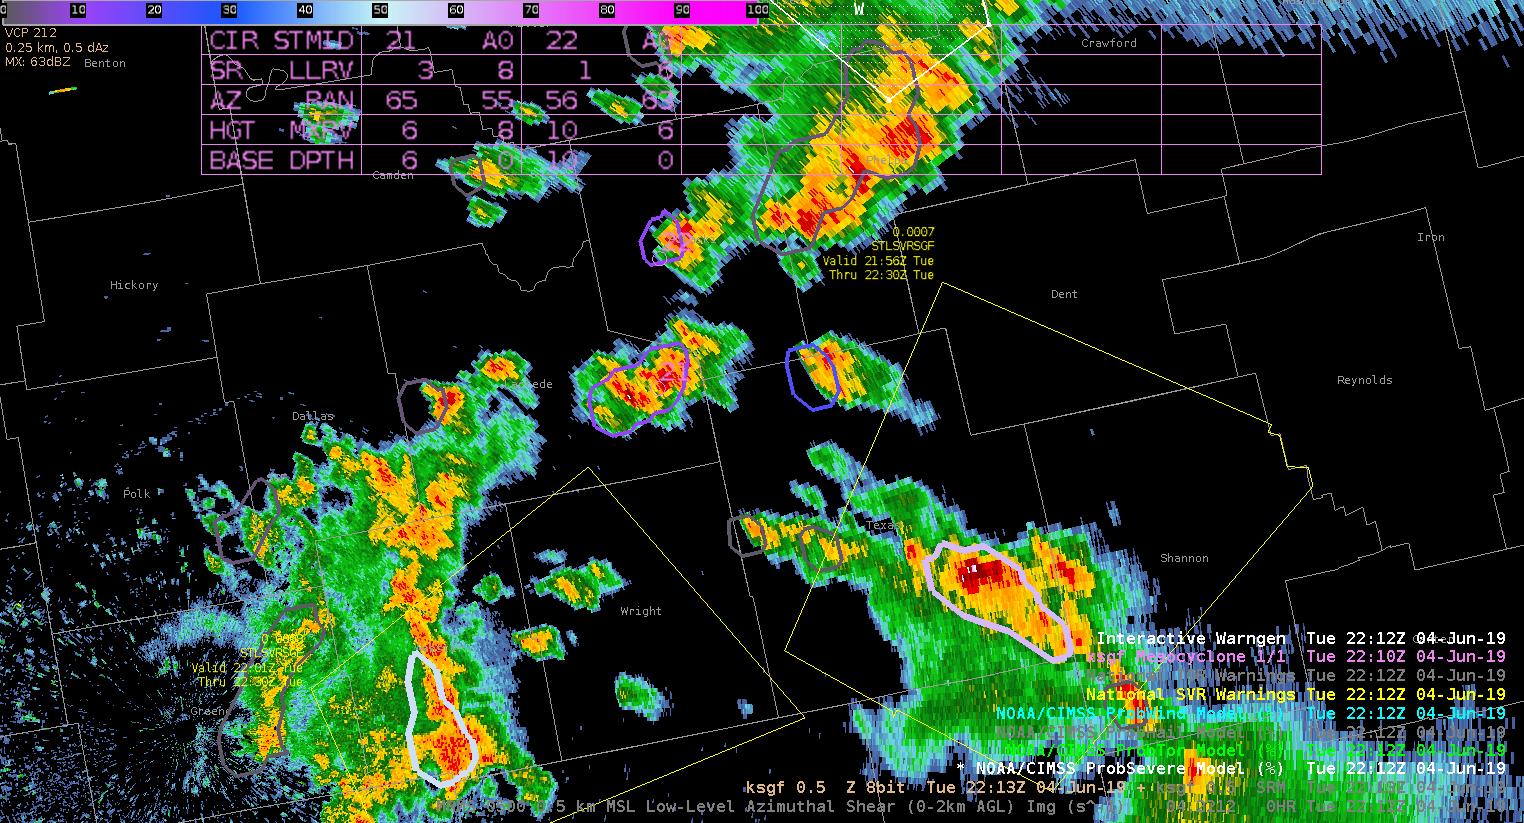
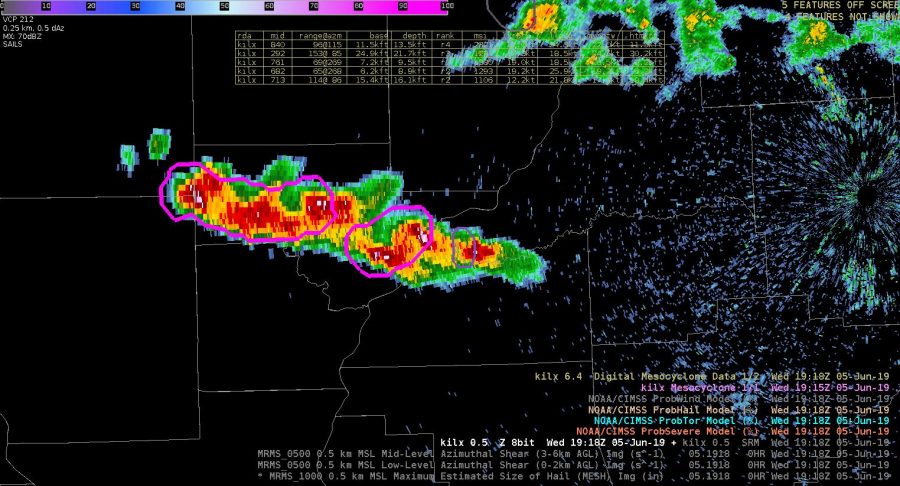
As storms begin to intensify probsever eis picking up on the strongest activity. Probsevere began to ramp up for the cell just south pf Pocatella. That combined with traditional radar methods lead me to issues a warning for that cell.

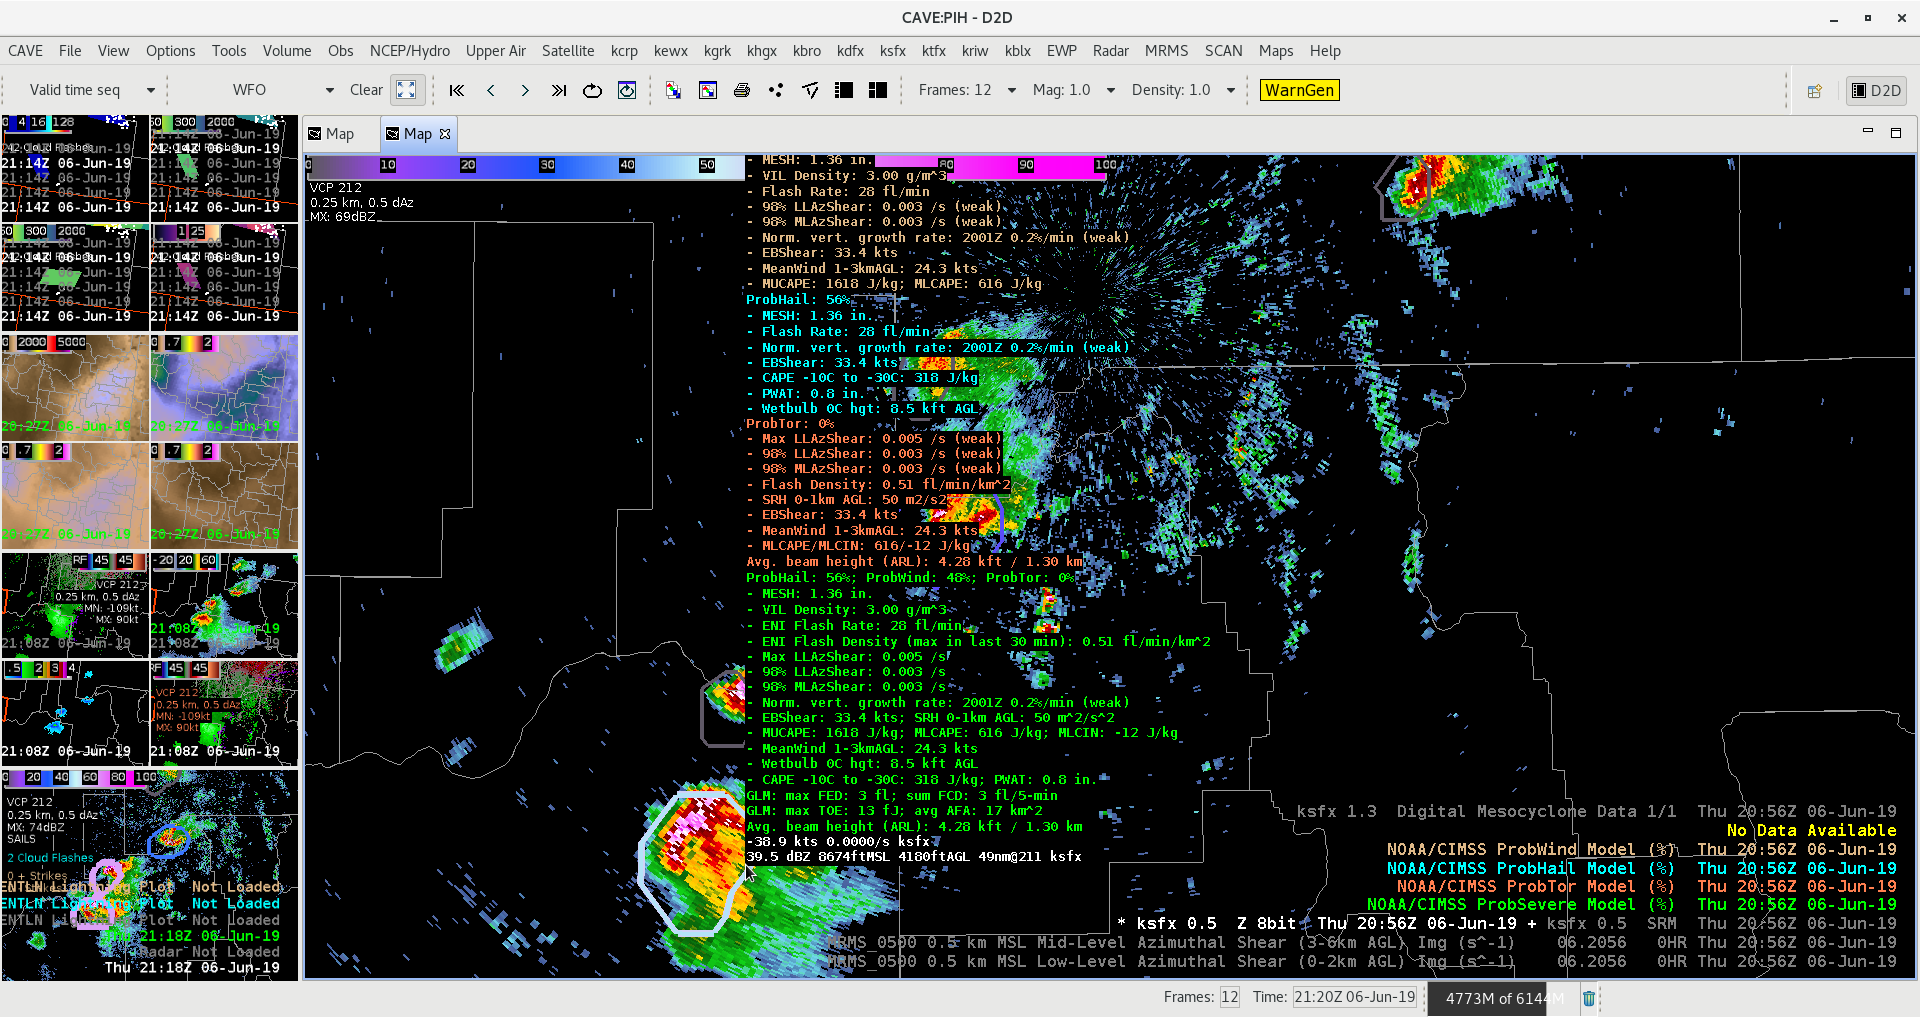
A similar situation unfolded with a south just south of CWA that I debated on warning. The probsevere values did show and uptick. Eventually the storm fell apart as it pushed into southern Idaho.

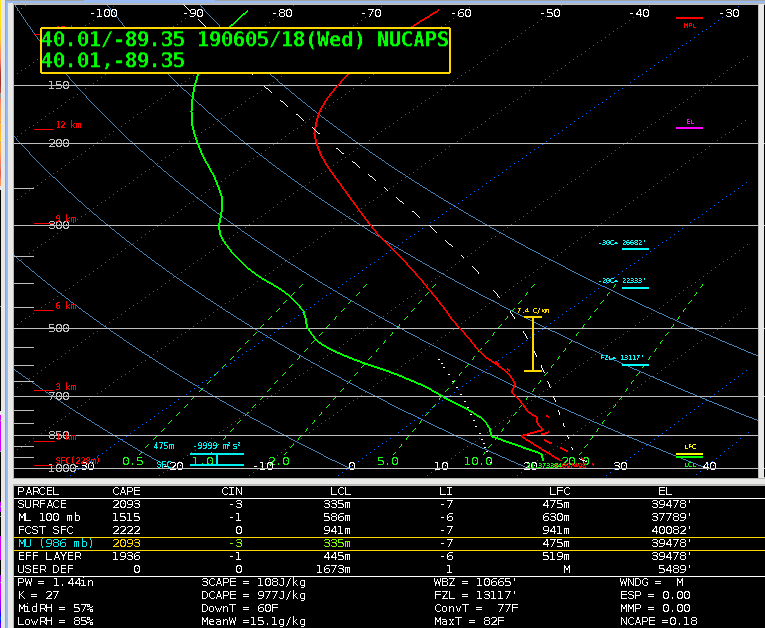
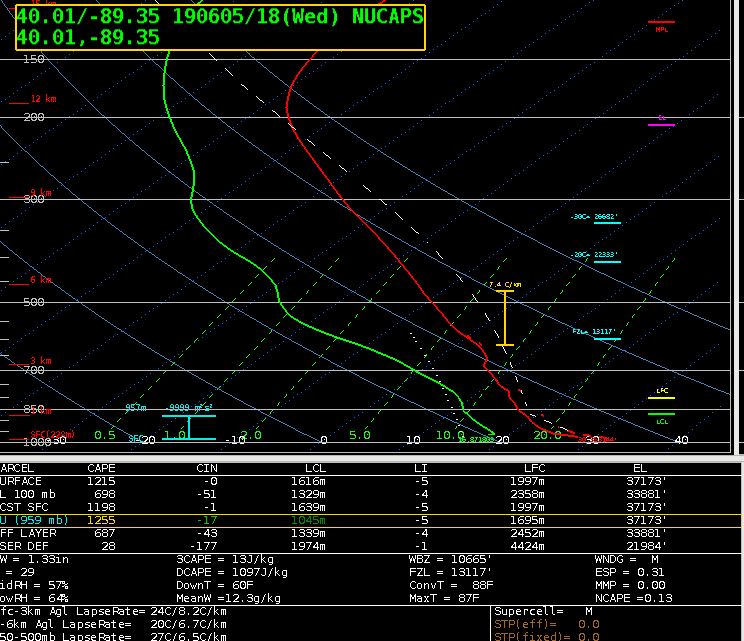
We’re watching a few cells in the southern half of the viewing area.  As NUCAPS comes in I’m comparing it the allsky cape. The allsky cape is around 1100kj.

The modified sounding is putting out about 700kj of ml cape. While the nonmodified is much lower down to 500kj.

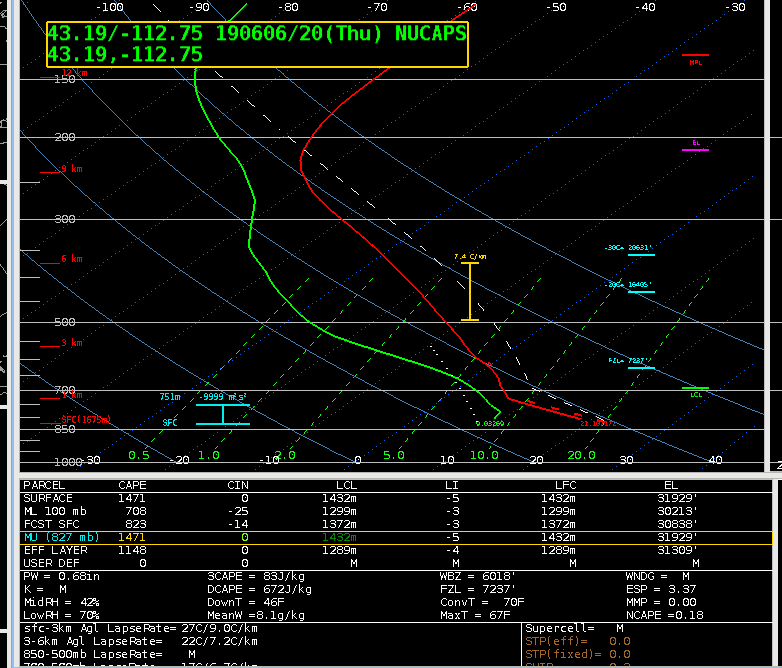
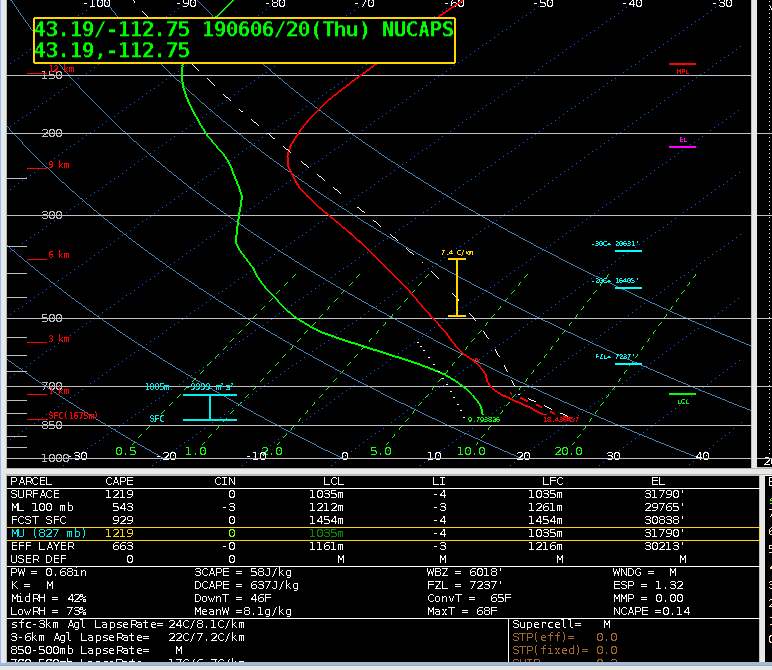
We don’t have a midday sounding to see which one is initializing the best. For what it’s worth. The rap cape output is around 500kj.

The TPW was close to the observed pwats as well. It was outputting about .65″.

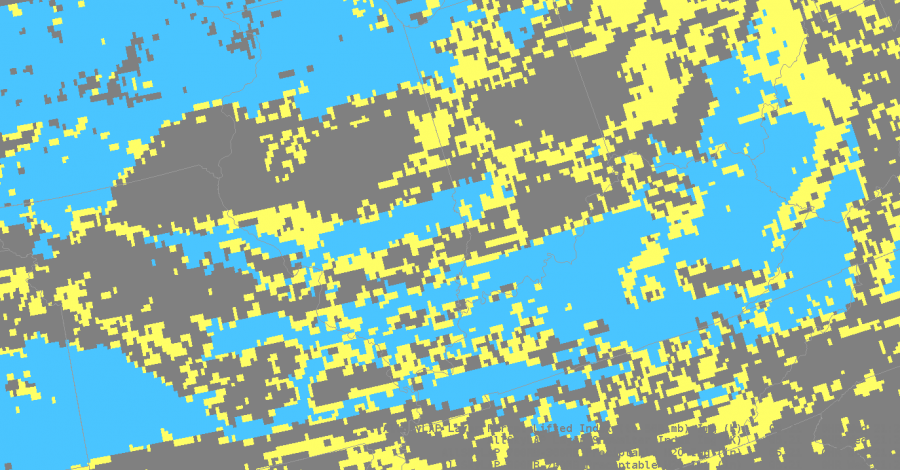
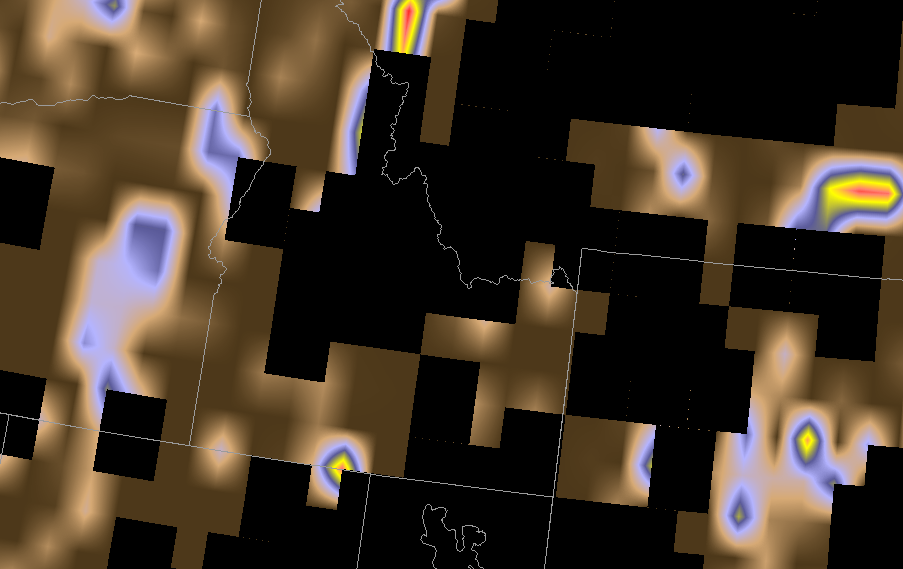
The FED has been fairly low this afternoon which isn’t typical for what I have been usually see. However, the AFA and the MFA are higher indicative of growing updrafts. I’m thinking the FED might be lower because of potential hail in the updraft.

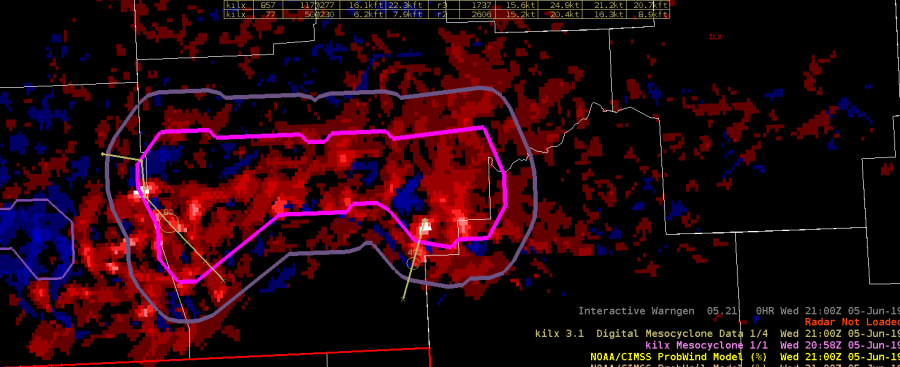
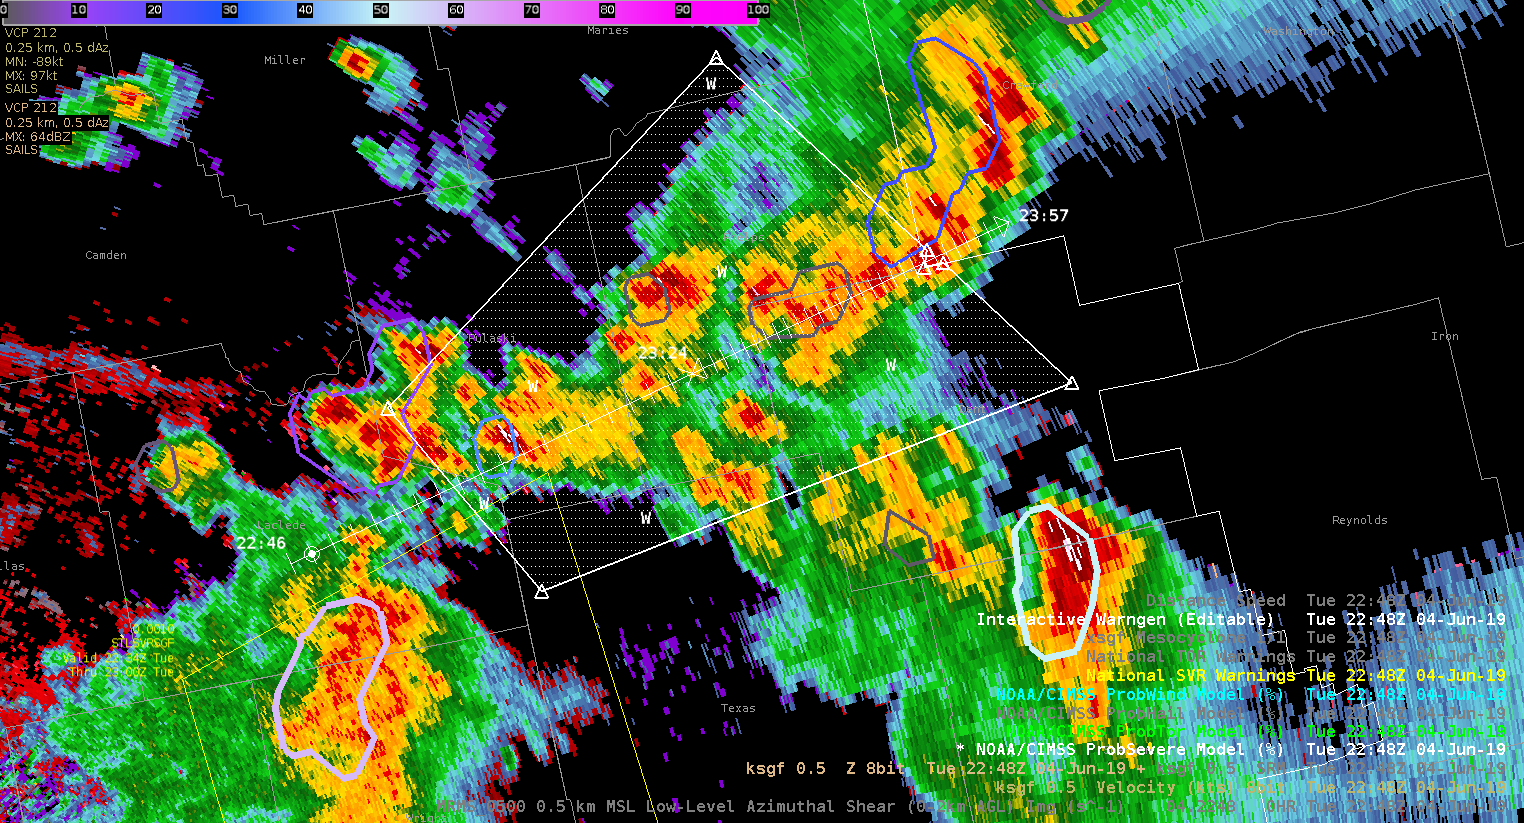
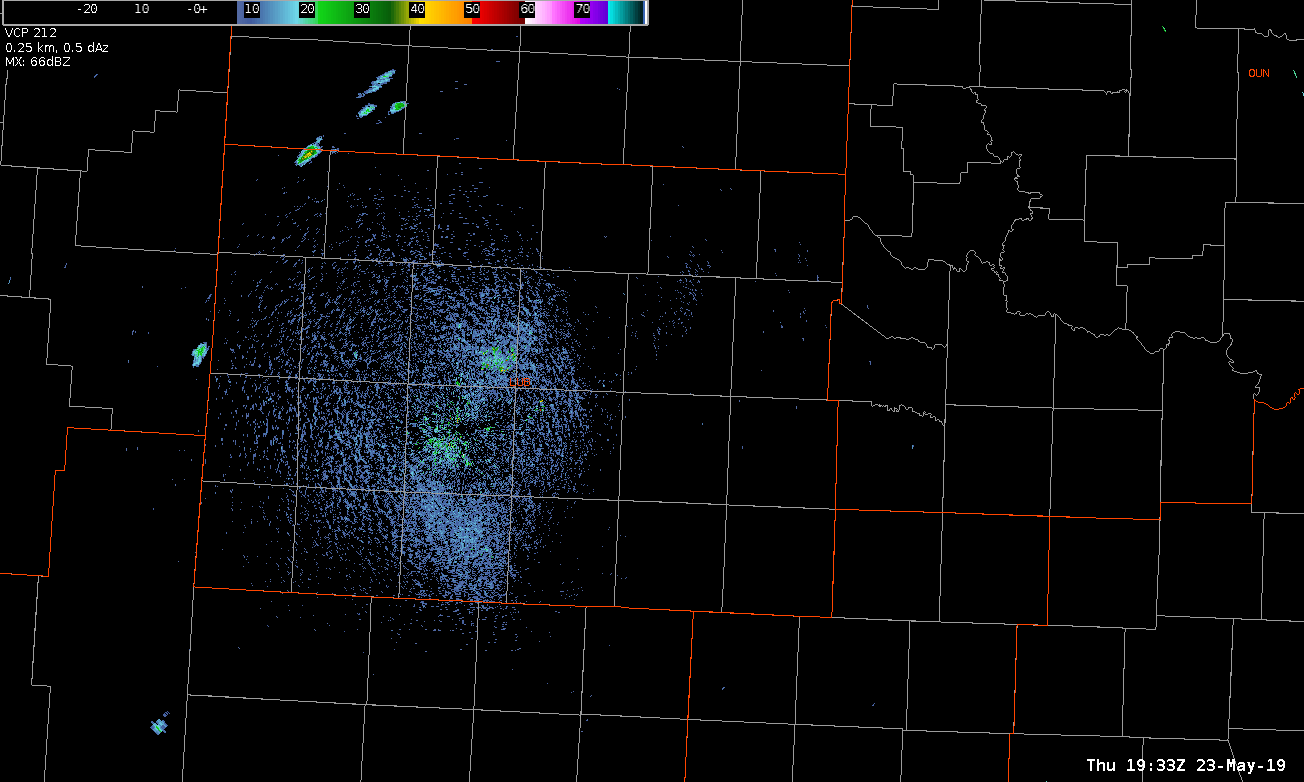
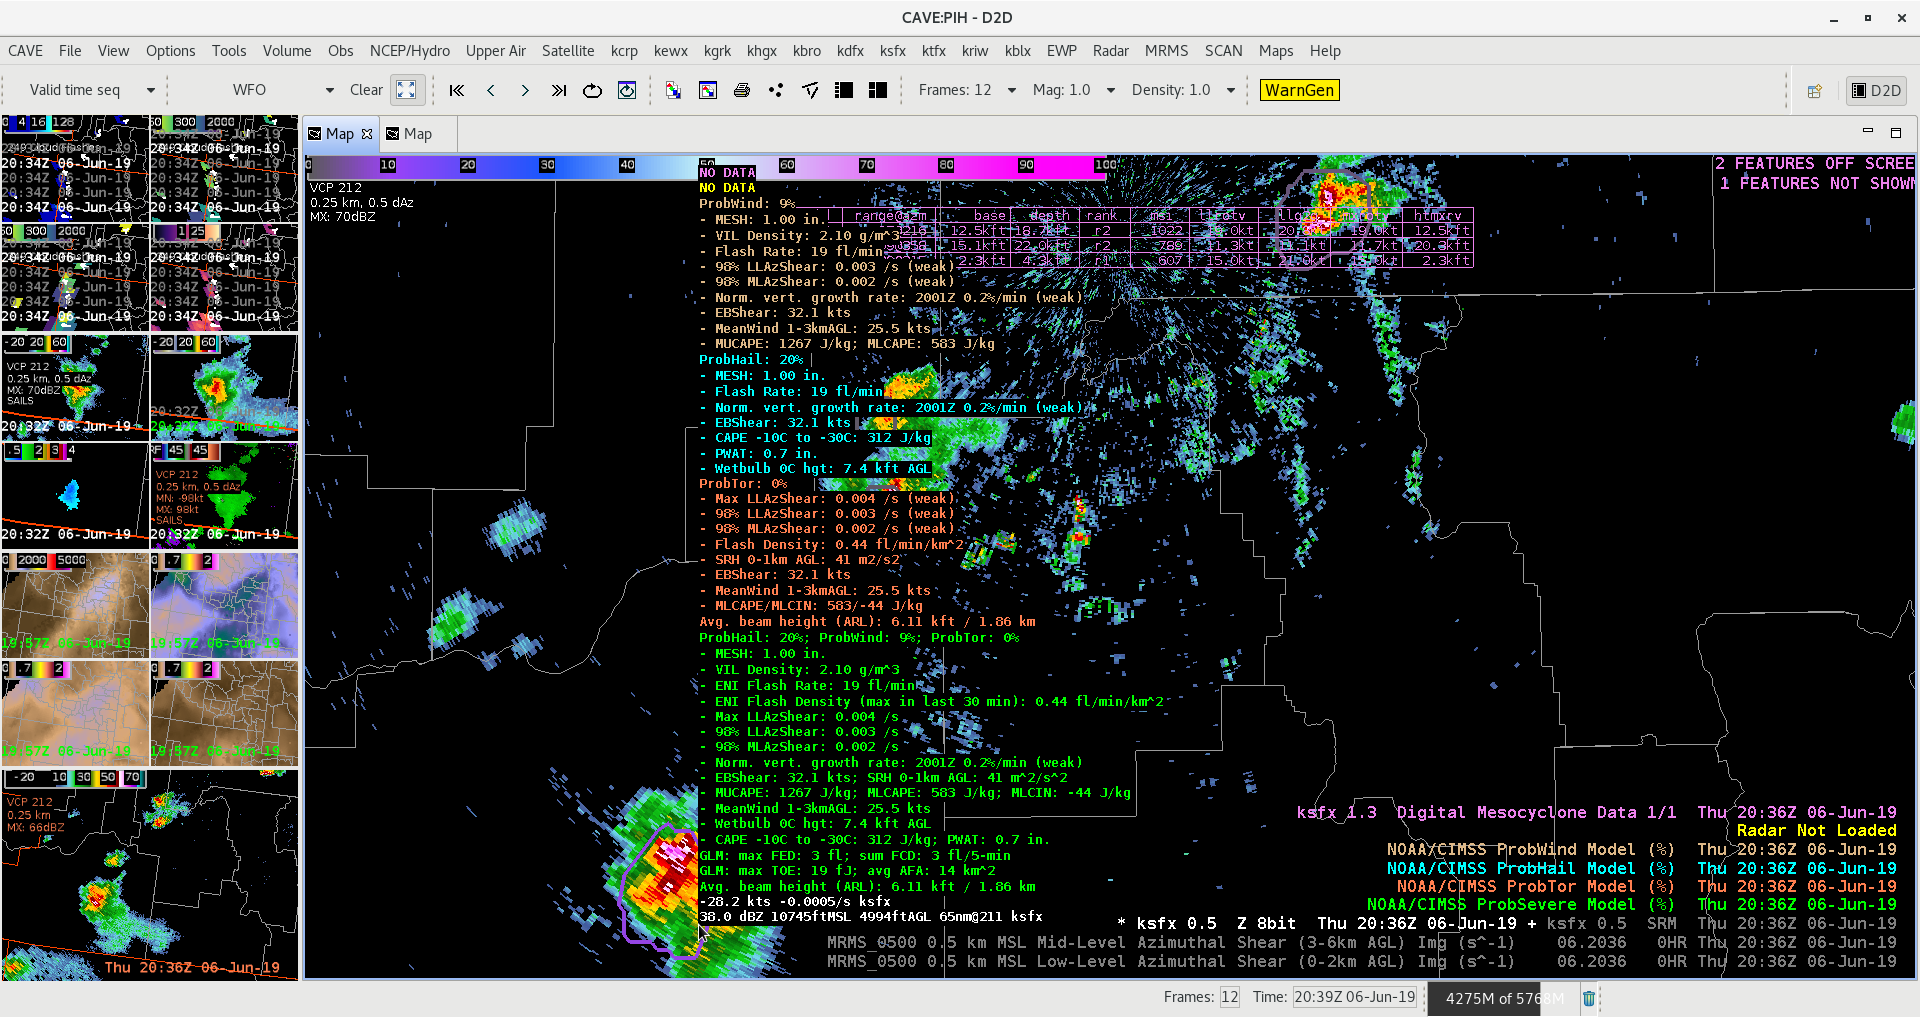
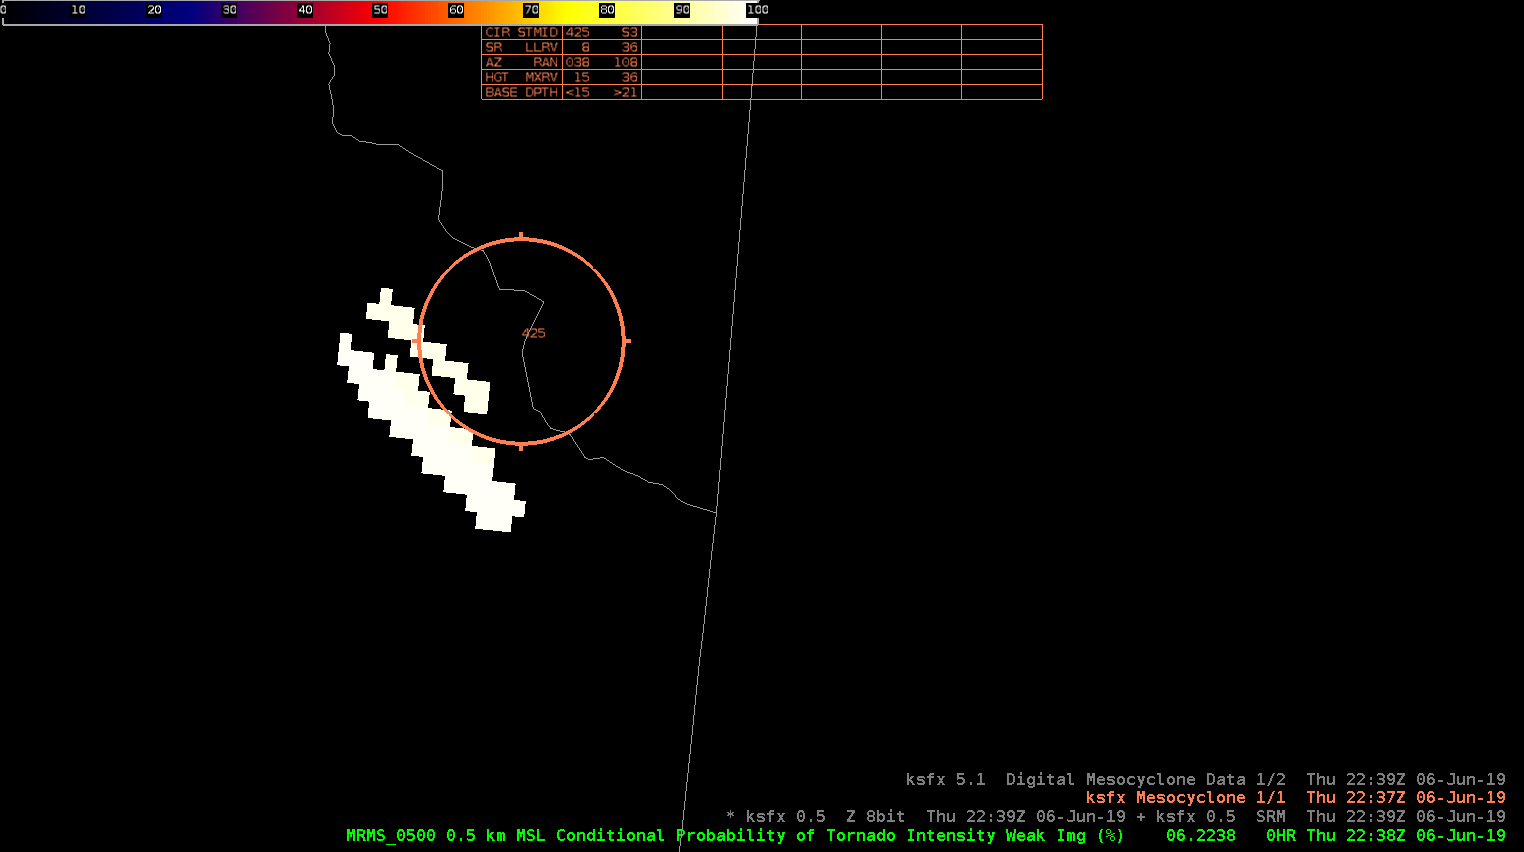
The cell pushing out of Freemont county Idaho continues to intensify as it pushed into Montana. Both the MD, and NMDA were picking up on a high meso that was clearly seen on SRM.


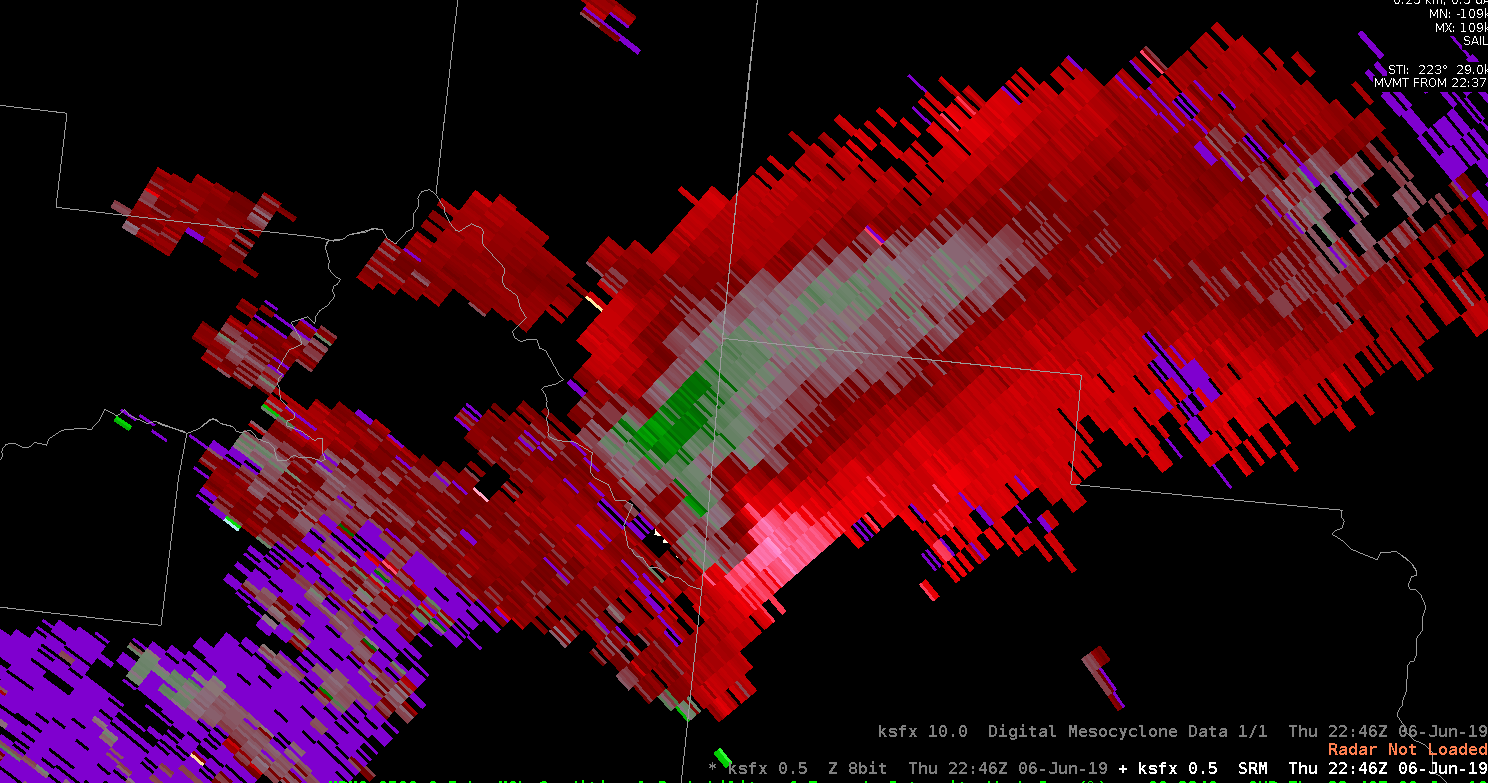
The CPTI was showing high probabilities as well.  I still wasn’t as concerned about a tornado threat due to how high the base of the storm was. It was interesting to see though.

The forecast cape and cin values came in from the NUCAPS,  but it wasn’t usable for my area because their was a lot of missing data.

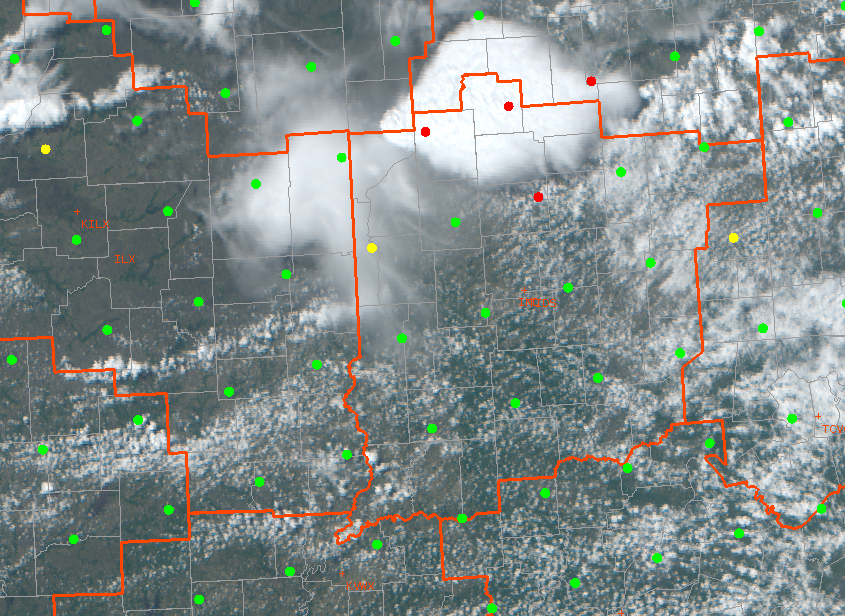
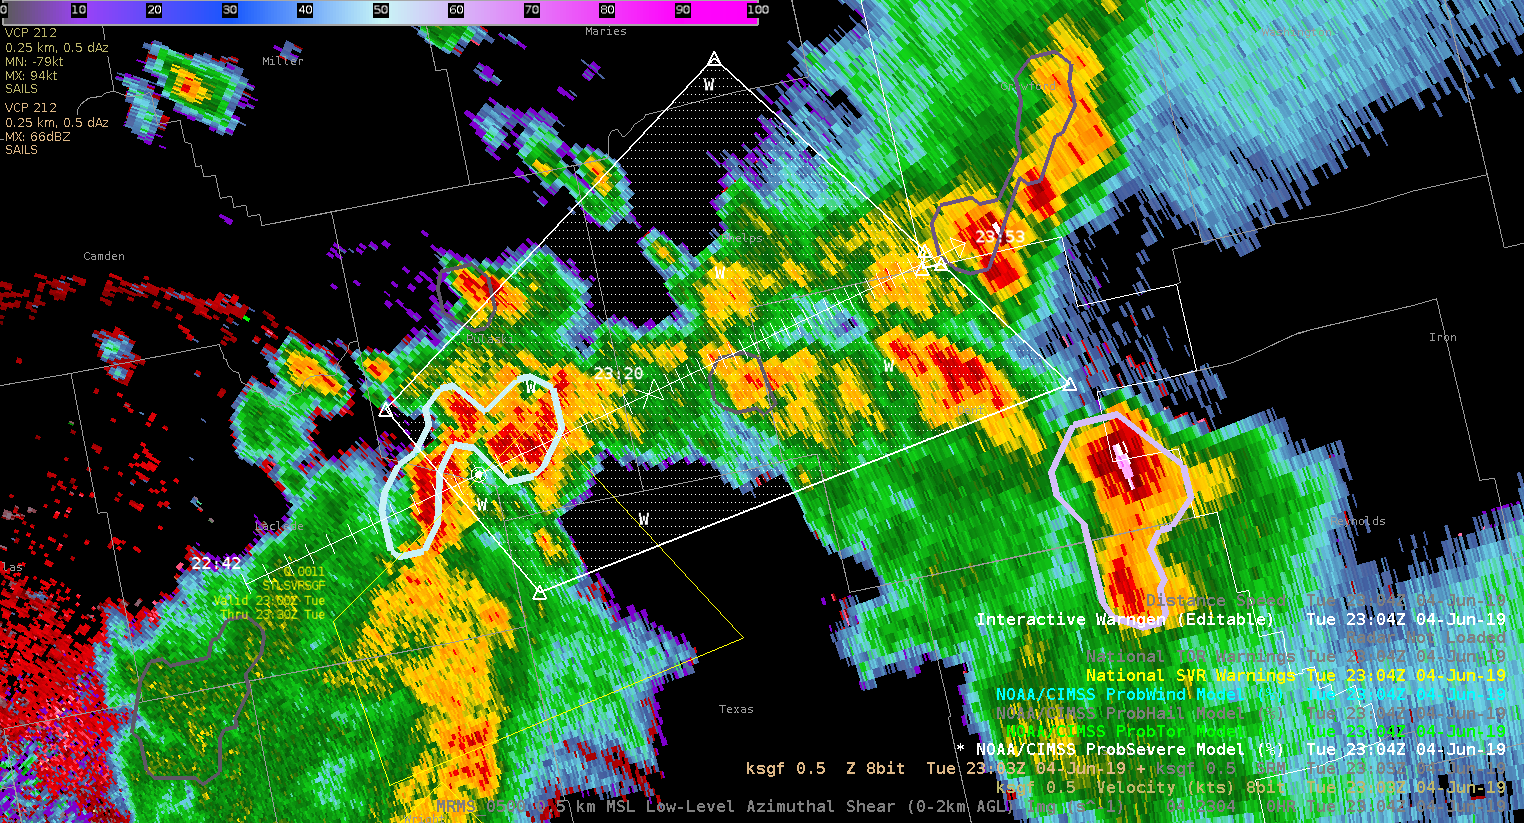
The actual Pocatella office issued a warning for Freemont county. Using typical radar methods the storm didn’t look like it warranted a severe thunderstorm warning, but satellite and MFA showed new convection was still firing up. Right after looking at satellite there was a report of a 54mph wind gusts.


Springfield Illinois Storms

Right now I’m analyzing the various new products to nowcast where and when storms will intensify. Currently I’m comparing ALLsky cape to the mesoanalysis from the spc. Right now the mesoanalysis is higher with cape compared to allsky. Over our area the it’s cloudy so the it’s taking data from the GFS.

A cell in our western counties ramped up very quickly while our computers were down. Prob severe immediately directed our eye to the cell. The probsevere lined  up with an uptick in vil values and velocity.

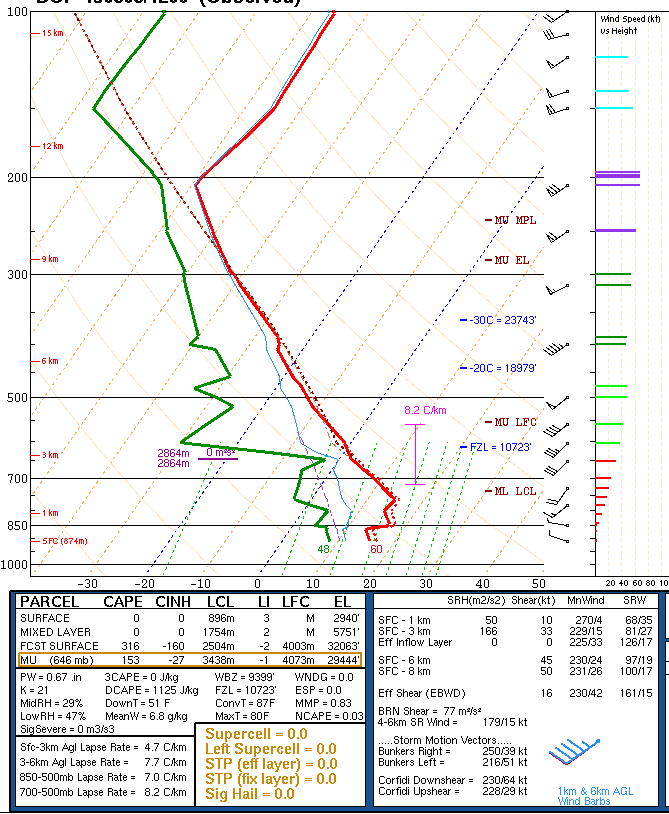
I’m comparing the actual sounding to what’s shown on nucaps, and allsky to see what’s initializing the best. The actual sounding shows 3025kj of surface lavyer cape and 1453 of mixed layer.

Around the same time allsky shows a similar value of cape.

The modified sounding was closest to the actual sounding with 1515kj of mixed layer cape

The nonmodified sounding is much lower when it comes to mixed layer and surface cape. In the case the modified sounding was more reliable and gave a more accurate picture of the current state of the atmosphere.

The all sky cape was much higher, around 2300kj.

That increase might be due to the fact that the sampled area of interest was filled in by the GFS. Whatever input the GFS was taking into might have lead to it overestimating the amount of CAPE.

I’m also looking at GLM products to see trends with convection. The combination of event density and GLM minimum flash area help me to see the rapidly growing updrafts as well as cell that are producing hail. That’s the case right now. My warned cell is producing penny size hail.

About an hour later the FED Is starting to pick up on longer flashes, but the event density is still showing higher values. The lines up with satellite which shows overshooting tops, but storms are overall keeping their intensity. The overall trend combined with looking at stability indices aids me in nowcasting that storms will at least maintain their strength over the next hour or so.

The Day Land Cloud convection RGB was helpful in analyzing different cloud tops. The color scale highlighted the thin cirrus compared to the lower thick clouds. It also dipicted the outflow boundary from our southern storms very well. It gives much more detail to the cloud types compared to the visible satellite.

Today I also got the chance to analyze and compare the merged TPW precipital water with the allsky.

During the afternoon the PW values stayed fairly steady across the northern half of the state while moisture increased in southern Illinois.

The TPW decreased PWATS to close to 1 inch as storms moved through. T

That data was sampled in a cloudy environment.

Meanwhile, the AllSky does show a decrease in PWATS but’s farther north compared to what actually happened. That data was pulled from the GFS since it was in a cloudy location. It was helpful to see how each product performed in this environment. It’s nice to have access to both in order to see which one has the best handle of the current atmosphere. That initialization helps me monitor trends and nowcast.

As storms moved south out of my DMA I used Day convection RGB just to monitor growing cells. It was clear to see the strongest storms because they had the bright yellow maxes.

Earlier in the day was able to compare NMDA with the low level azshear. Tornadoes were’t a major threat, but the NMDA did line up with peak areas of Azshear. That storm did produce wind damage, and strong wind gusts.

Taylor Johnson.

NUCAPS Soundings indicating much higher CAPE than All-Sky values

The All-sky CAPE product has shown a pool of lower CAPE values (1200-1300), probably a result of earlier collapsed convection. However, values of CAPE farther down in the southern IND CWA are a little higher (1800-2200), as would be expected.  More interesting is the latest modified NUCAPS pass with soundings indicating much higher CAPE values on the order of 3500-4000 in the south and 1800-3500 elsewhere in the central and northern IND area. Based on this information, I’ll be expecting to see convection flaring up in the south in the next hour or so.

Tags: None

Springfield Storms

We’re currently analyzing storms developing in the Springfield Missouri WFO.  Right now I’m using various tools to monitor if these storms will become severe.

Right now I’m using a combination of radar, GLM, nucaps, and the All sky products. Currently the most helpful tools on top of what I normally use are allsky and the lightning products.

The allsky cape helped to find CAPE gradients and an increase in CAPE. The northern batch of storms were pushing into an area of increasing CAPE and in return they did intensify.

While deciding whether or not to issue a warning I also looked at AFA GLM data to see if there were new flashes developing which can be indicative of growing convection. That flashes aligned with radar and increased my confidence that storms would intensify.

That lead to me issuing a severe thunderstorm warning. The prob severe data also ramped up. So I felt confident about my warning.

I also used NUCAPS sounding predictor to look at the cape during the rest of the afternoon.


While watching storms in the Springfield area I tried using  NMDA. Even after magnifying the product it was still a bit hard to see. I’m note sure if there’s a way to make the circle bigger or more pronounced. It can get busy on an active day.

As I continue to track storms I’m using Allsky CAPE to see what type of environment they are moving into. The CAPE does increase farther east so that makes me anticipate convection wane over the next few hours. I will though pay close attention to the storm farther north since they will move along the cape gradient.

I also used probsevere to increase my confidence in warning for a cell in pulaski county. The velocity ramped up as well as vil values.


The increase in probsevere over a few scans prompted me to issue a severe thunderstorm warning.

Taylor Johnson

Severe Threat over Minnesota This Afternoon

Ongoing complex of thunderstorms pushing into south central MN this hour.  Have a new set of thunderstorms forming in what AllSky is showing as a higher CAPE environment along the outflow pushing out from this complex.  ProbSevere has picked up on this cell as well (near Milan)…showing a Hail chance of 55% now and growing quickly.  Will monitor the downstream growth of both systems.

AllSky as a good proxy for dryline location and CI

The AllSky Layer Precipitable  Water product showed utility in identifying and tracking the dryline as it moved into the Lubbock CWA. The dryline entered the CWA at about 1930 UTC.

Coincidentally, the KLBB radar shows convection initiation around 19:30 UTC as well.

And the convection continues to develop:

The AllSky product remains a very useful tool for situational awareness and 2-D environmental familiarization.

-Atlanta Braves

Examining environment using All Sky Lap PW

Covering the CTP (State College) area today. Initial convection has moved through, but models are suggesting redevelopment later in the afternoon along a front.  The help see changes in the atmospheric moisture, I’ve captured an animation of a 4 panel AllSkyLAP PW.

For reference, the upper left is the total column PW, the upper right is 1-0.9 sigma, the lower left is 0.9-0.7 sigma, and the lower right is 0.7-0.3 sigma.  What stands out to me surging eastward of lower values of the upper-most layer (0.7-0.3) towards the CWA, while the lowest layer (1-0.9) is remaining mainly unchanged. This suggests that the drying above the 0.7 sigma level (approximately 600-700 mb for CTP) may lead to increased values of DCAPE later this afternoon, so that any storms that do manage to initiate could have a threat of severe winds.

Thorcaster

All-Sky LAP PW Showing Rapid Low-Level Moistening

A comparison of the All-Sky LAP derived PWATs with 12z RAOBs shows that the LAP product is depicting PWAT quite well.

The PW retrievals were done mostly in clear skies (blue colors):

A four-panel plot of total PW and PW at different layers from 12-18Z shows rapid low-level moistening over OK and AR (upper right and bottom left panels).

The moisture return, in combination with diurnal heating, is resulting in a rapid increase in CAPE as suggested by the all-sky LAP product:

Ron Dayne

Here comes the moisture

The AllSky Layer Precipitable Water clearly shows the moisture return this morning into southern Texas and Central Oklahoma. PWATs across the Red River were ~0.5 inches early this morning and have now increased to ~1.5 inches this afternoon.

This product is a great situational awareness tool to survey the pre-storm environment. -Atlanta Braves

Difficult Warning Decision as Storms Enter LSX CWA

The northern extent of a line of storms that has produced sporadic wind damage is approaching the LSX CWA from the south. One of these storms has good reflectivity structure with a tight front reflectivity gradient and a rear inflow notch. However, these storms appear to be entering a more stable airmass. This is reflected in the ProbSevere probabilities of the storm in question compared with one just a bit further north:

The northernmost storm with the cool contours has only a 22% ProbWind and is in an environment of only 715 J/kg MLCAPE (per the sampling feature). Meanwhile the storm in question to the south in the warmer contours has a 90% ProbWind with 1220 J/kg MLCAPE. These storms are moving to the northeast toward the more stable air. Incidentally, the All-Sky LAP CAPE does not depict as sharp of a gradient in the CAPE compared with the RAP-derived ProbSevere values:

I am not sure which is more accurate but I suspect the model-derived values are more accurate in this situation.

Furthermore, a weakening trend in the Flash Extent Density is observed on the northern end of the line:

This storm still deserves a warning, but we will see how quickly it weakens.

Ron Dayne