Day 4- Large Hail in Texas

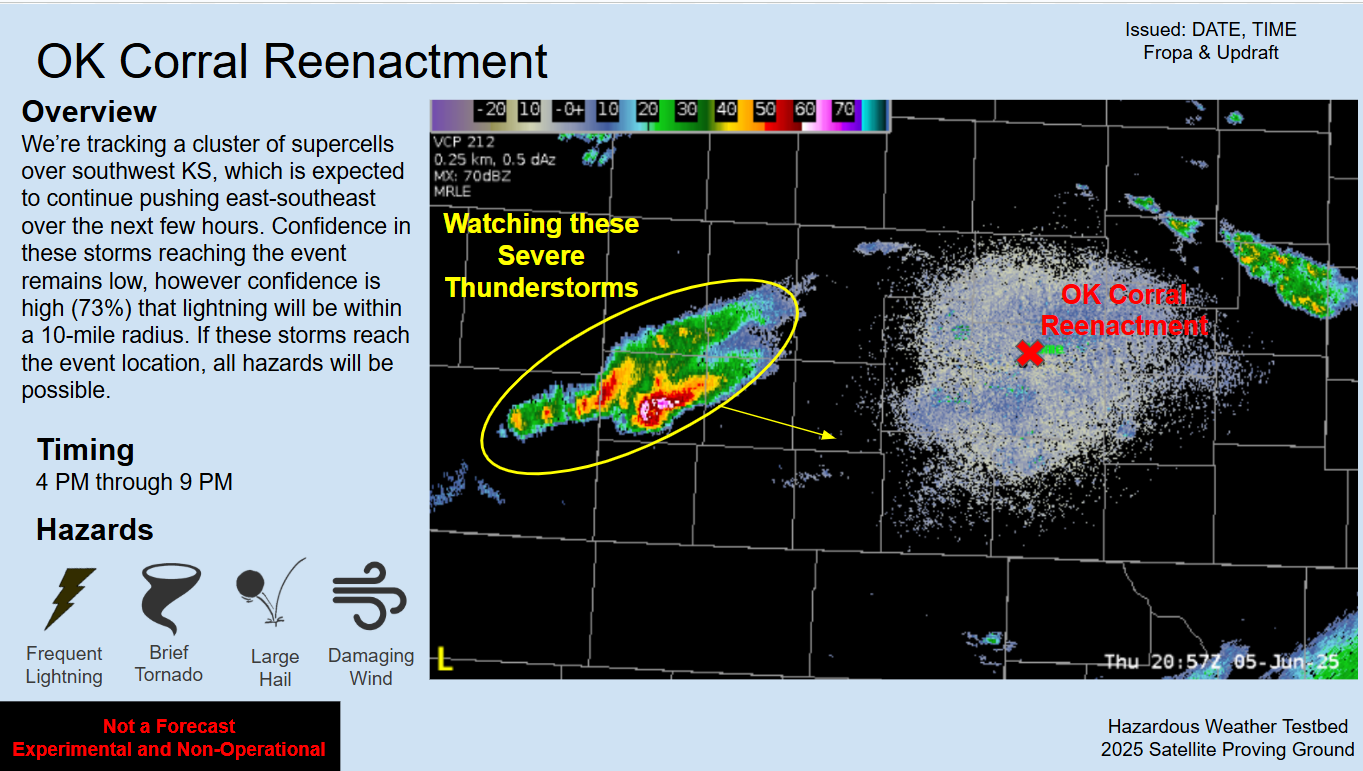
Conditions were favorable for severe thunderstorms across west Texas on Thursday, June 5, 2025. High instability and shear led to rapid development thunderstorms across the high plains. Initially, a cluster of thunderstorms congealed into one which then split into two. The right mover went on to produce at least 3” in diameter hail and wind gusts in excess of 72mph. Due to the poor radar coverage in west Texas, GREMLIN was useful in supplementing radar and MRMS data. GREMLIN showed features I hadn’t seen in the start of the week, including bean-shaped storms and double updrafts that later split into two storms.

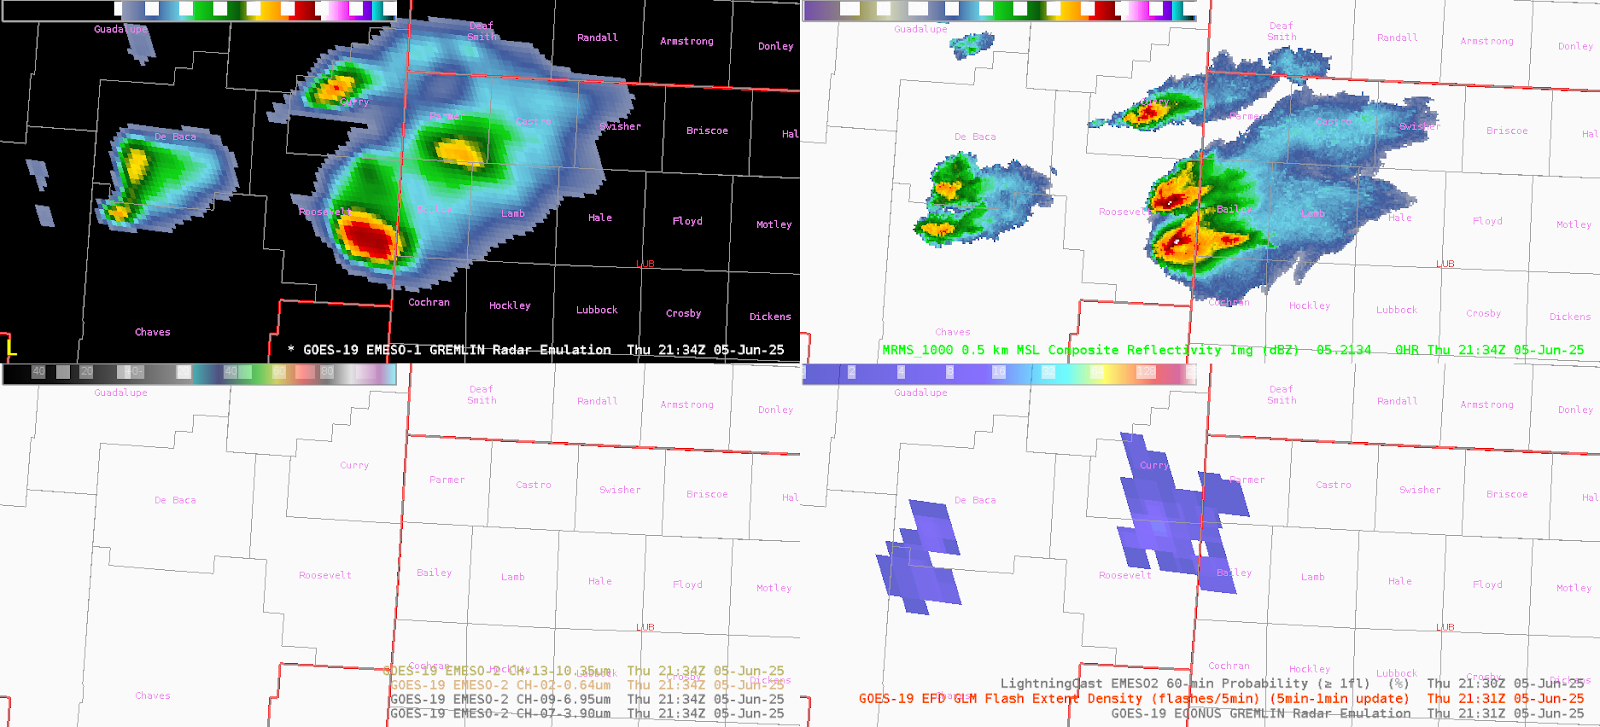
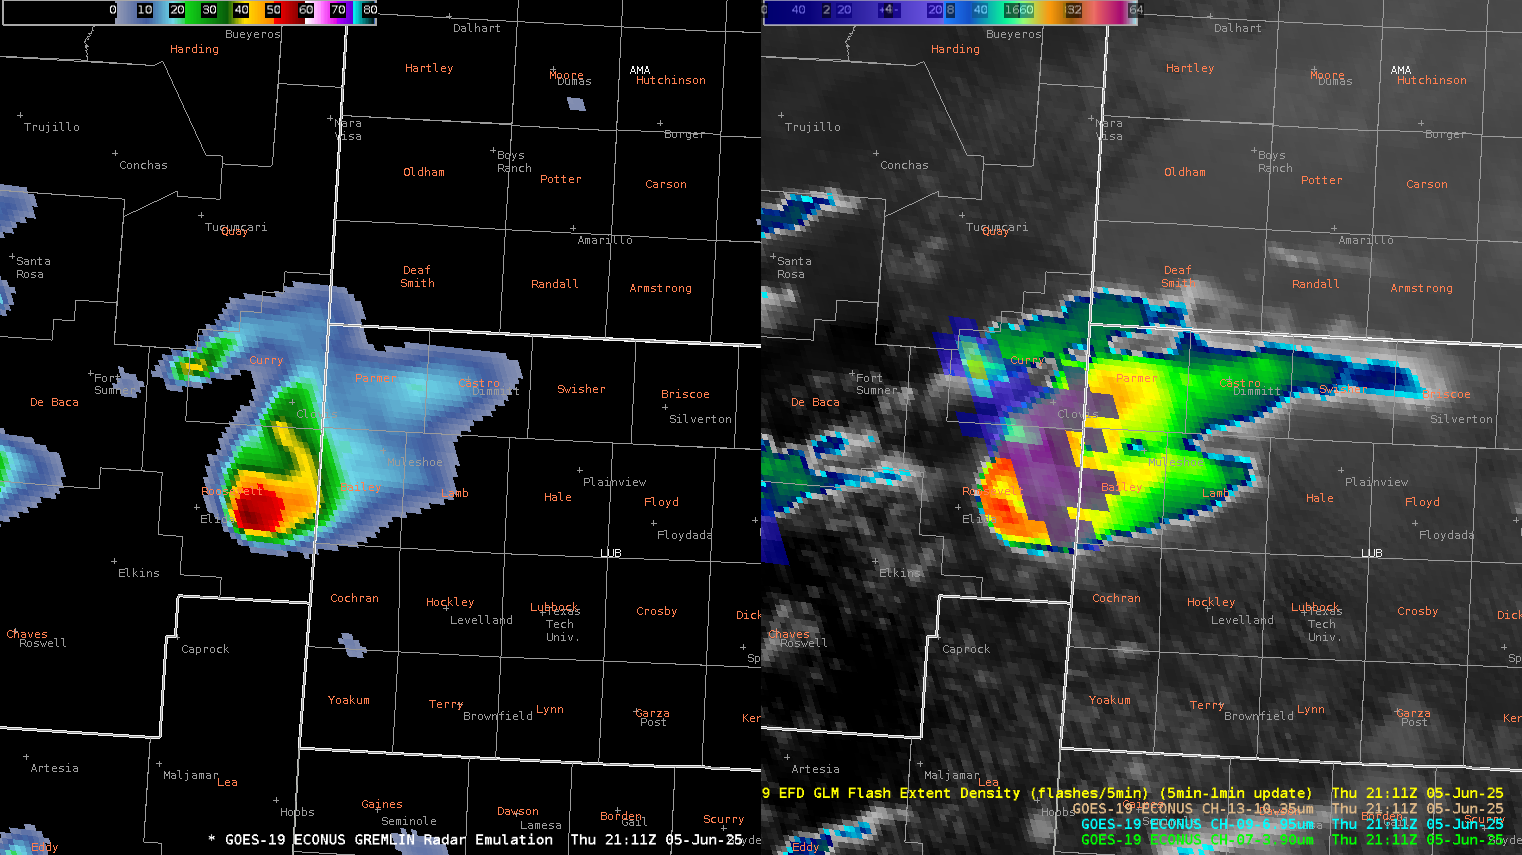
GREMLIN had some odd things occur too. ECONUS GLM did not represent the lightning that was occurring with these storms and it is believed that this may have degraded GREMLIN.  In the loop below, ECONUS GREMLIN produced a fictitious cell northeast of the left and right movers. It also lagged a bit before it showed two strong cells, especially the southern storm.

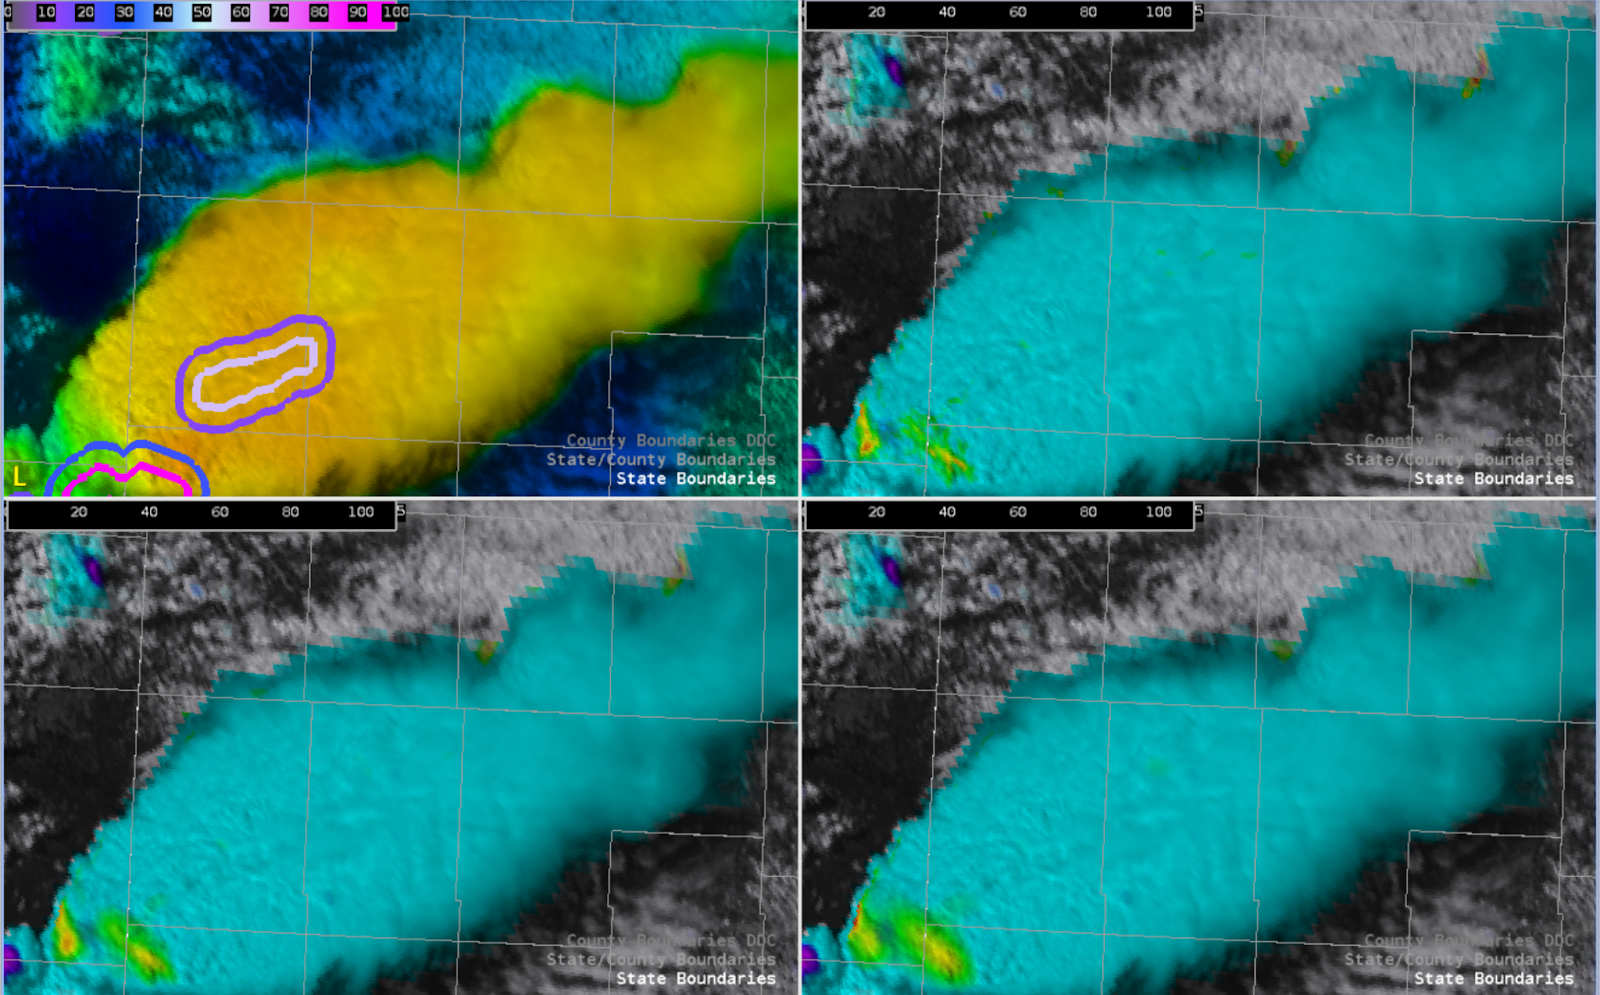
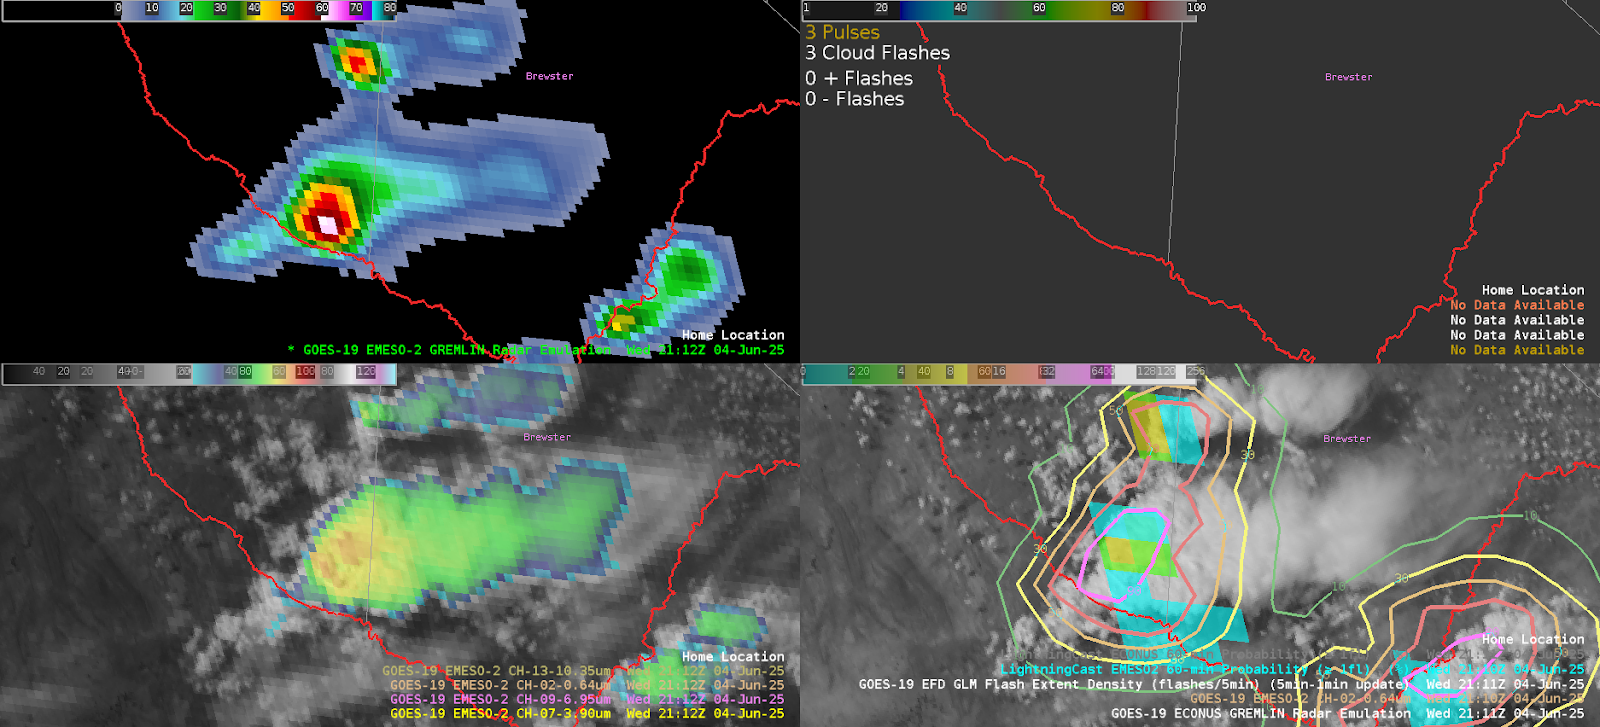
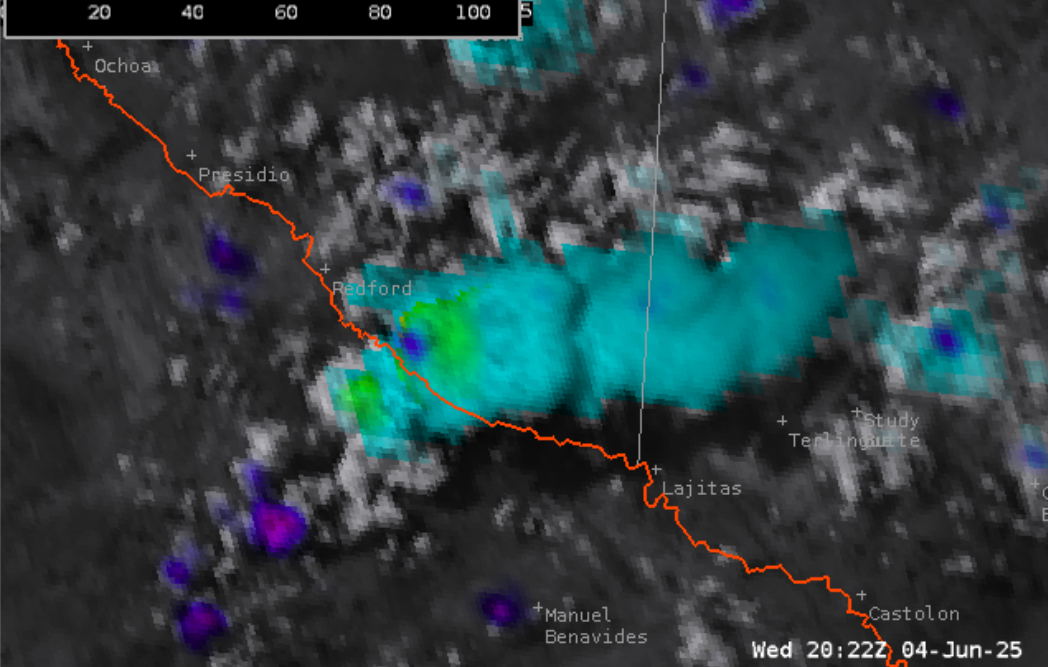
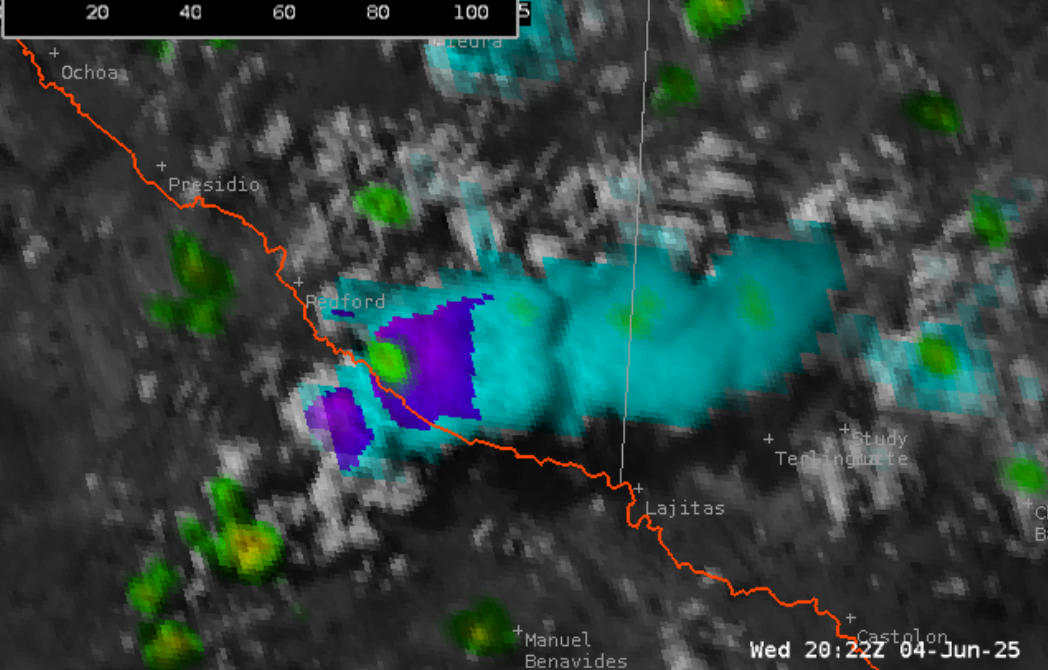
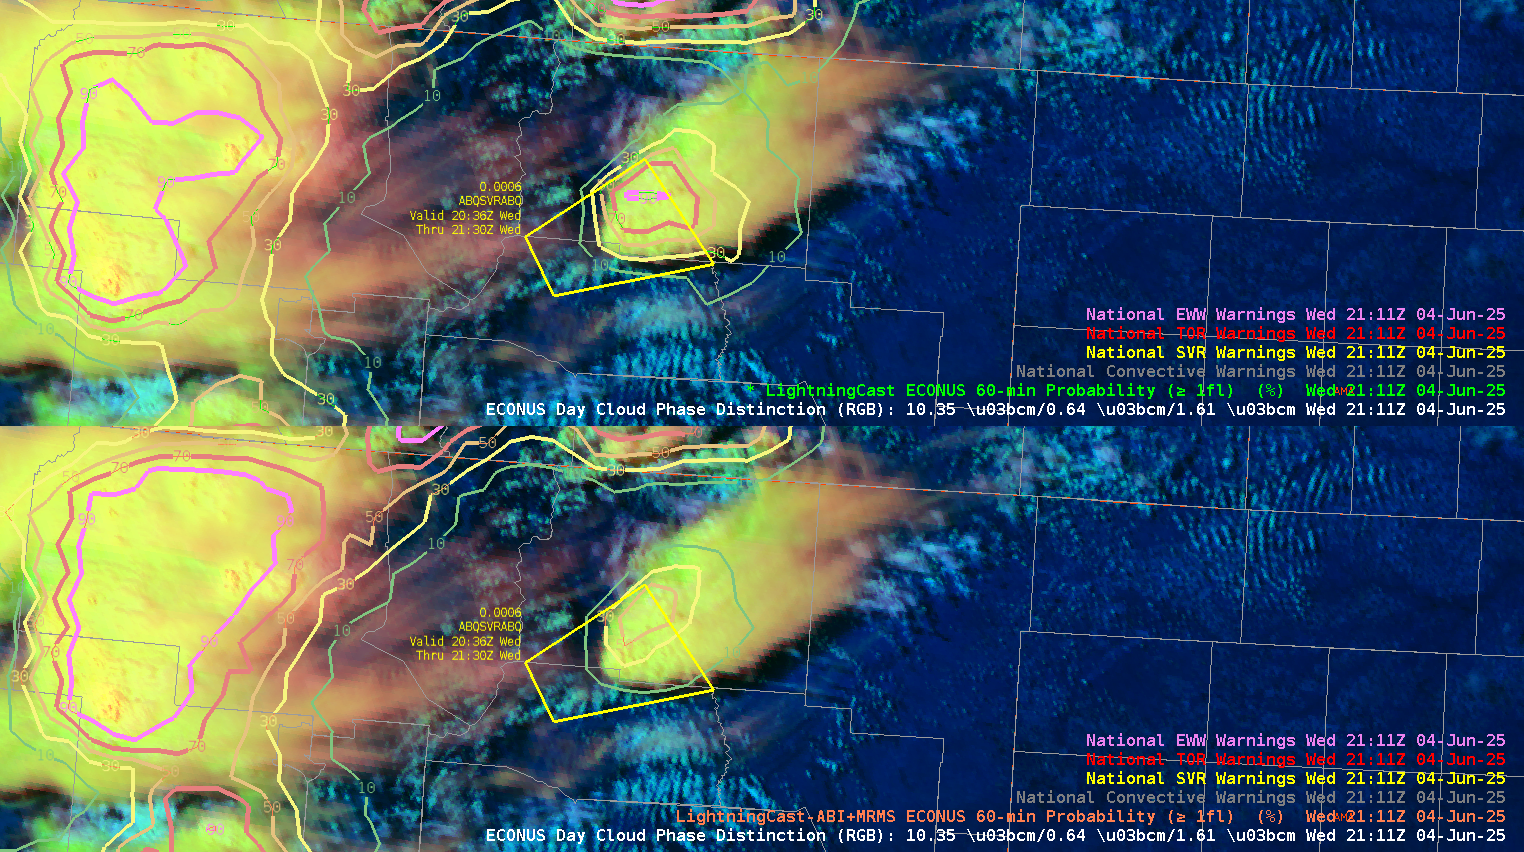
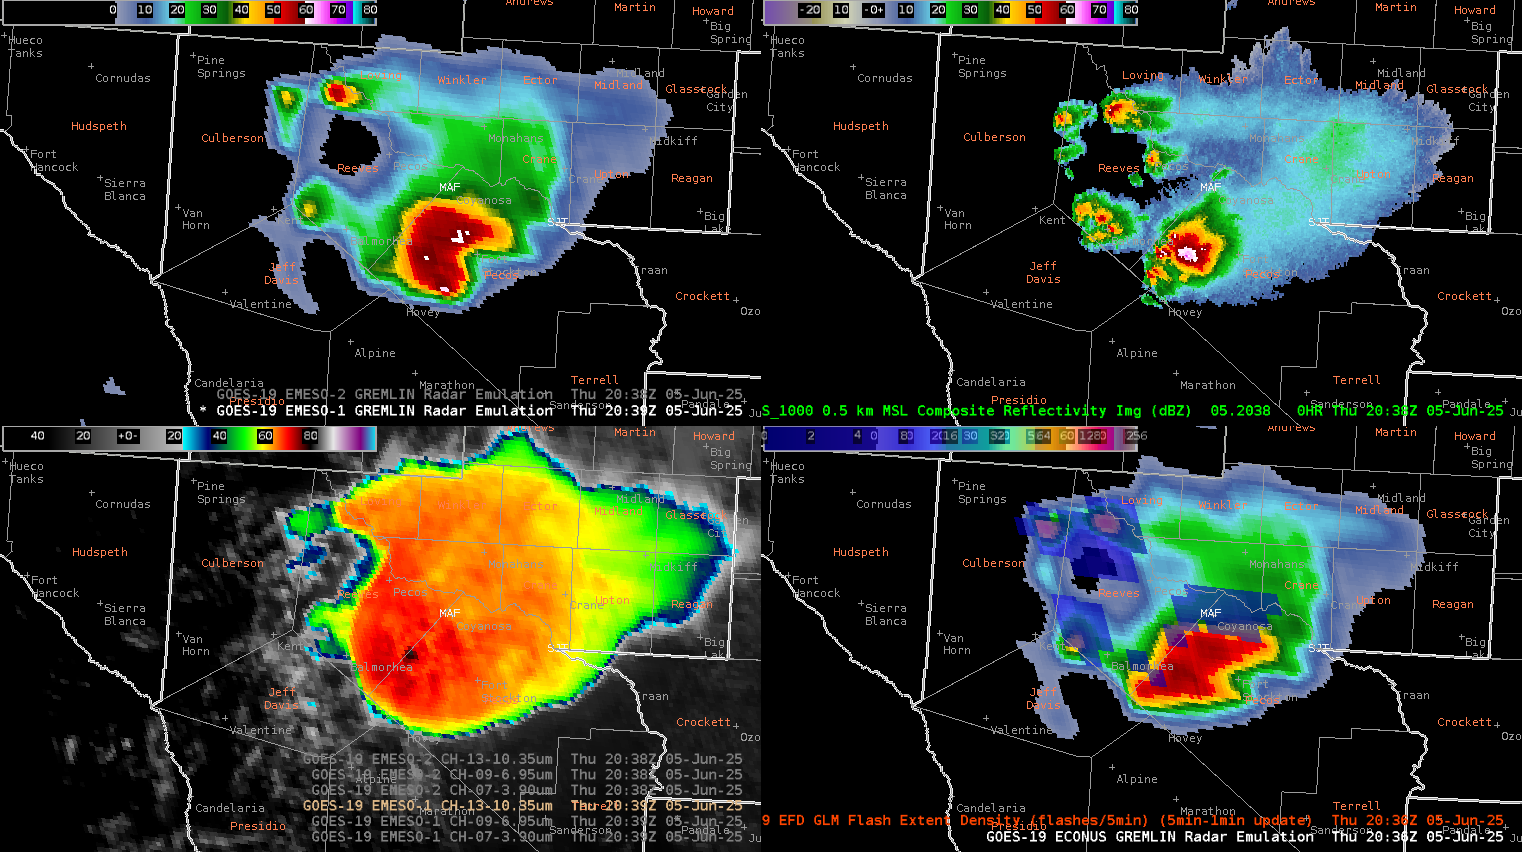
Four Panel-GREMLIN EMESO-1 (top left,) MRMS -10c (top right,) GREMLIN ECONUS (bottom right,) and CH07 (bottom left.) In this example you can see the stronger storm to the south

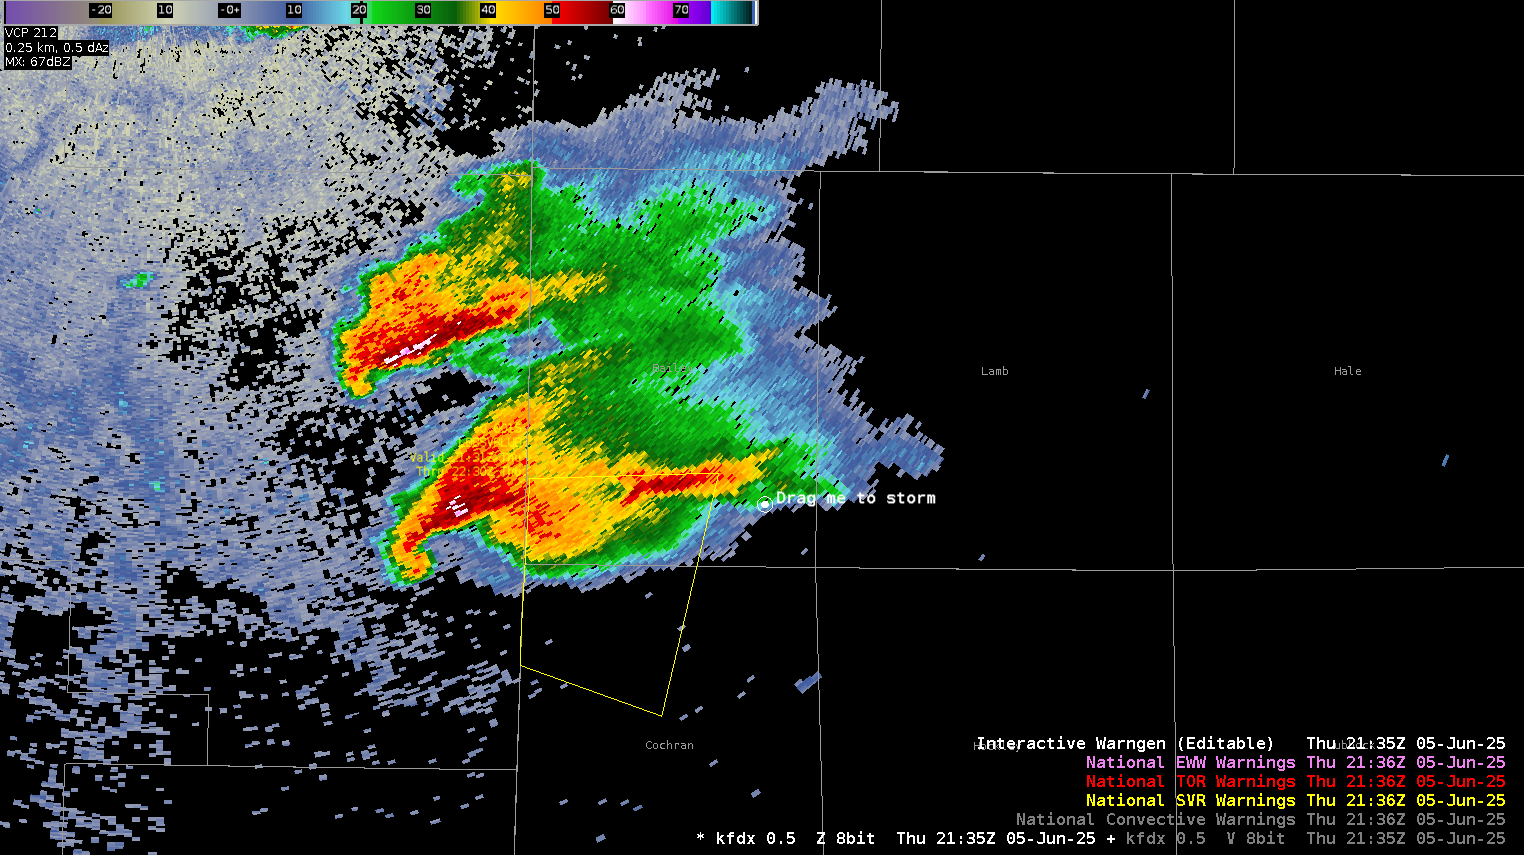
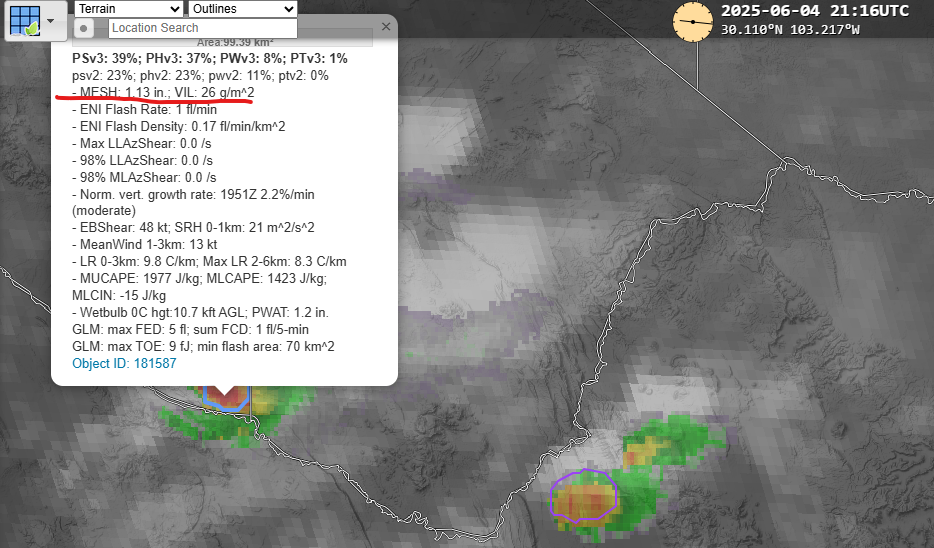
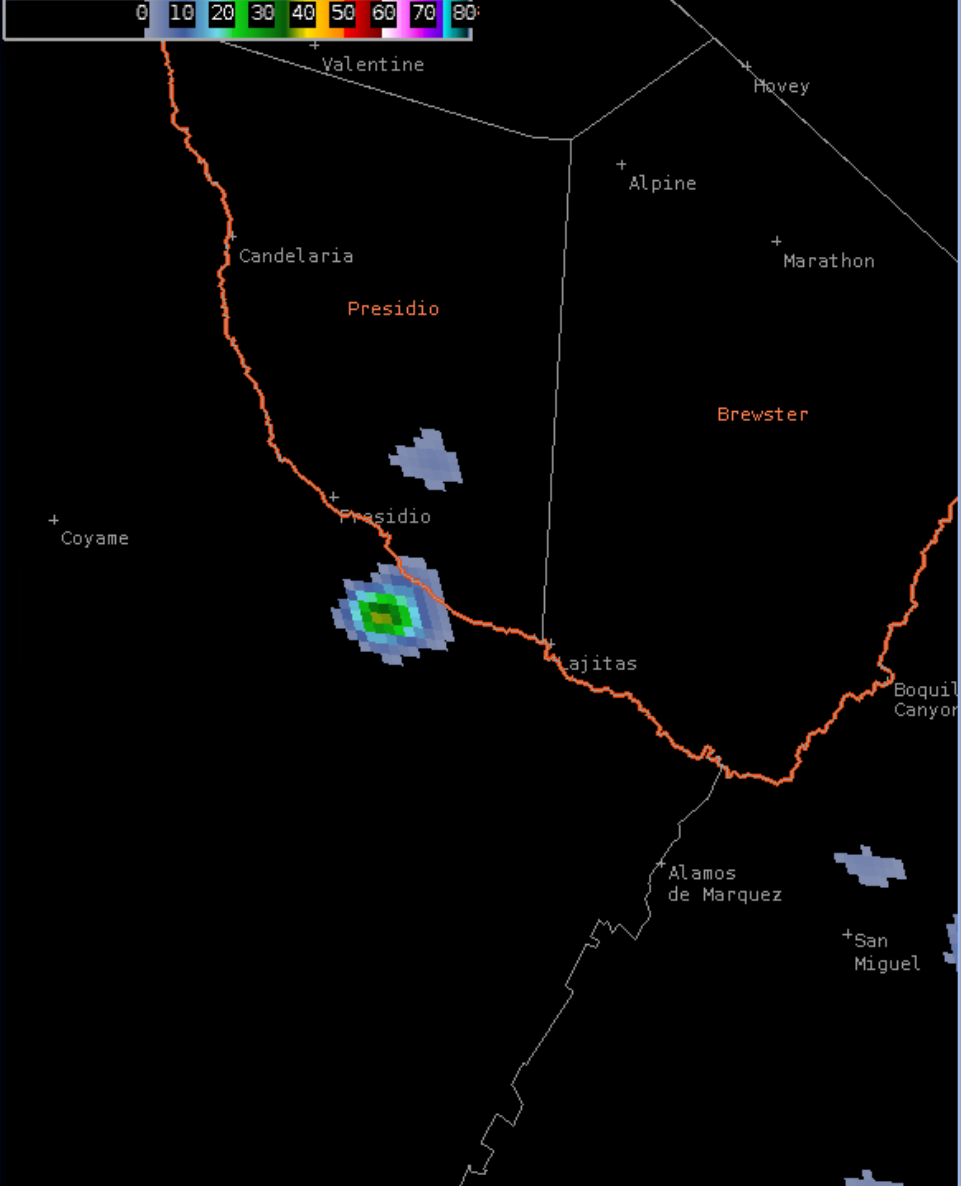
Here is a single image of the bean shaped cell that produced at least 3” hail.

LightningCast was useful for situational awareness and messaging our partners for the DSS event. We noticed V2 was a little better at maintaining the high probability of lightning (greater than 90%) than V1 in mature convection.

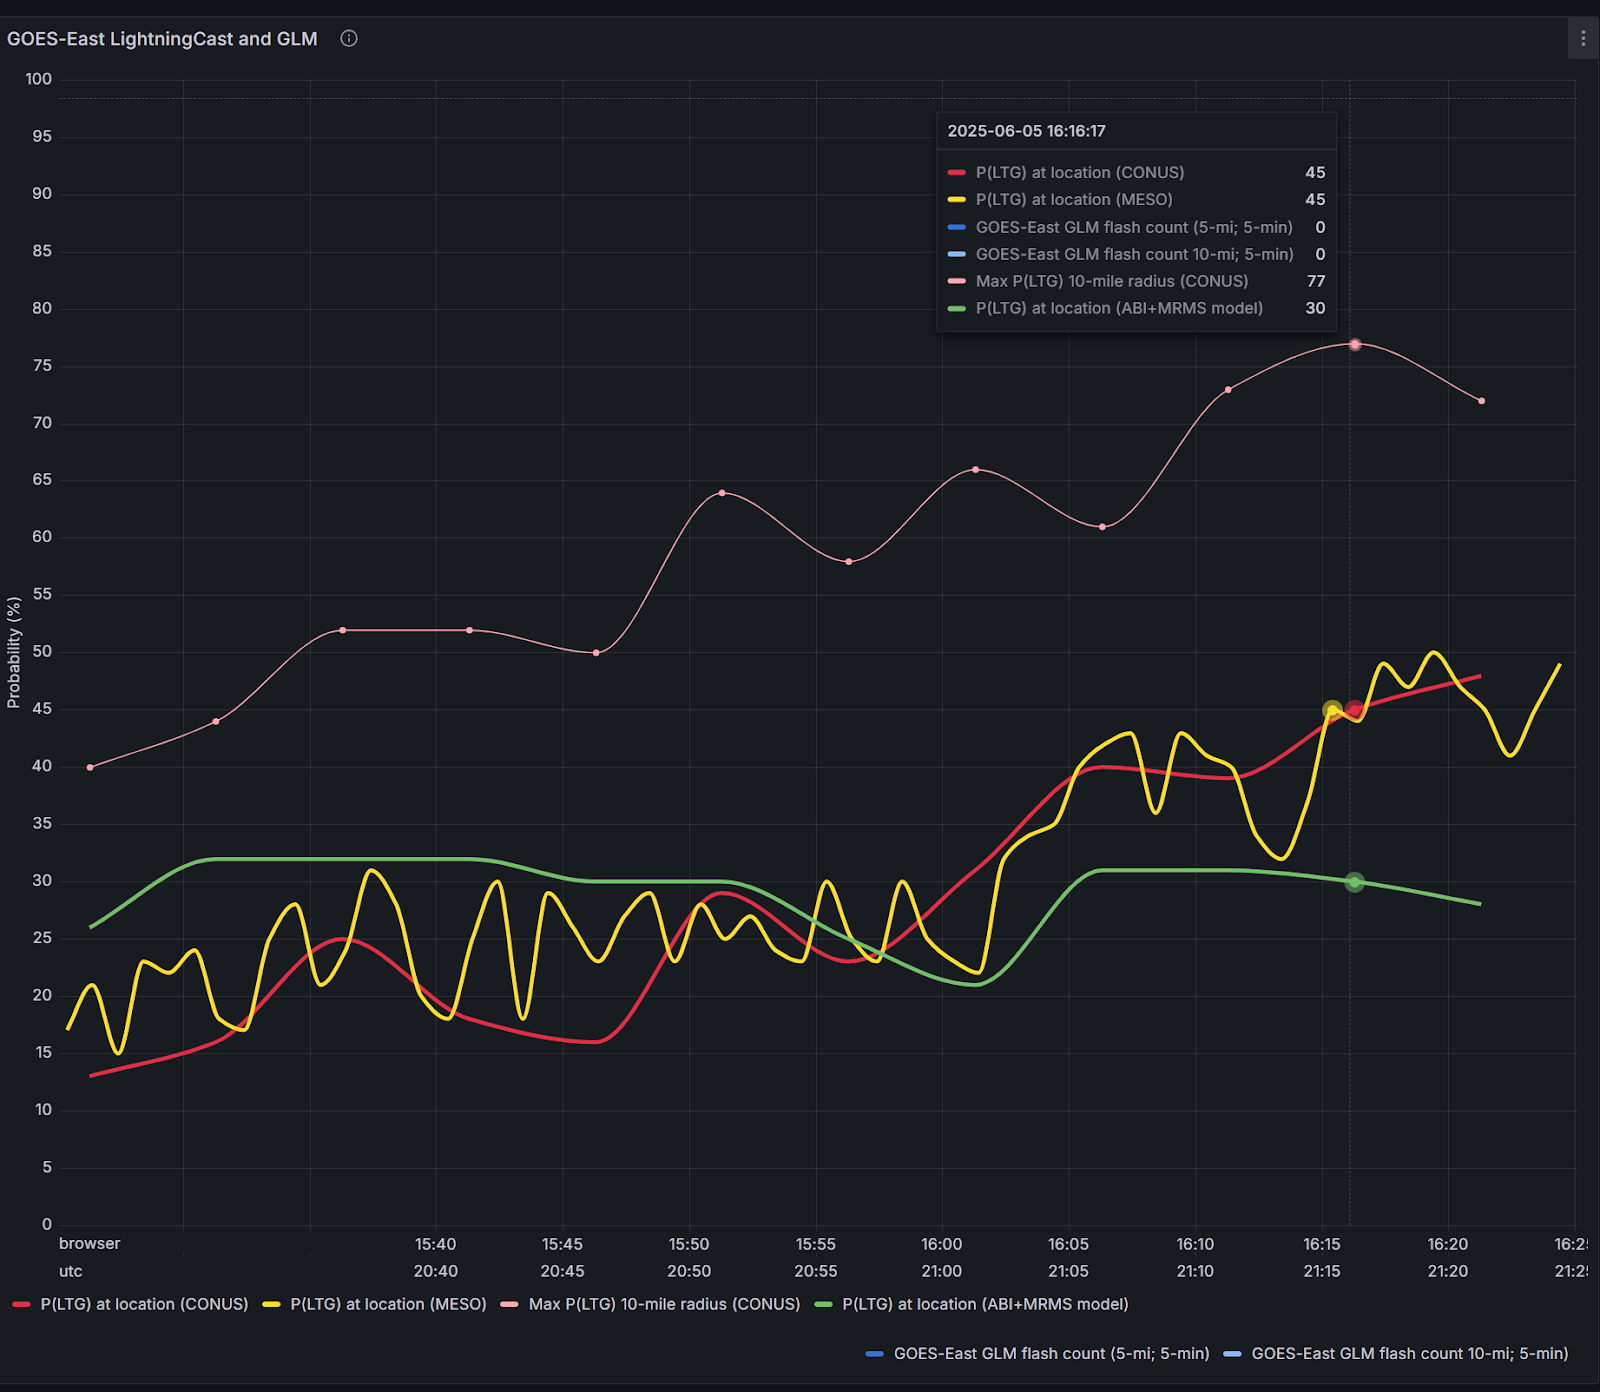
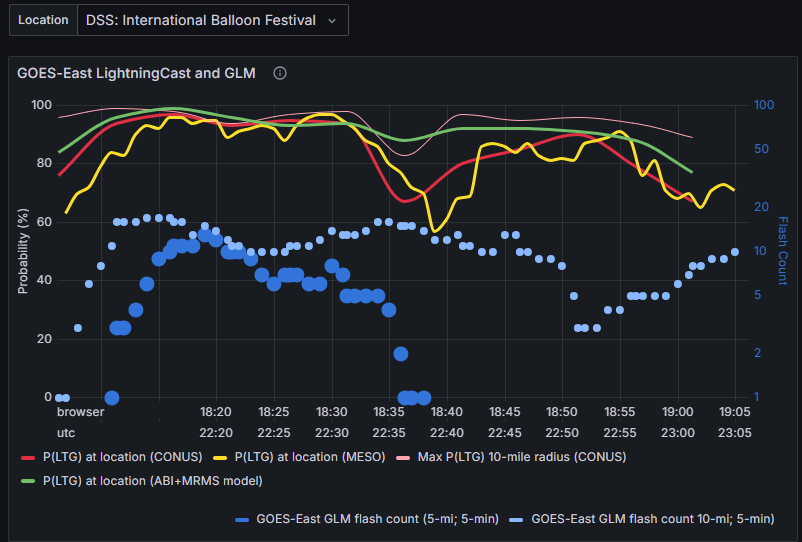
LightningCast proved to be useful for our fictitious DSS event in west Texas. V2 was faster to increase the probability of lightning prior to lighting occurring at the event (below.) It was also faster to show lightning cessation. There was a brief lull in lightning mid-way through the operational period and both V1 and V2 showed about a 20 min lead time of the probability of lightning decreasing in the next hour. V2 stayed slightly elevated compared to V1, but both highlighted that there was still a high probability of lightning in the next hour.

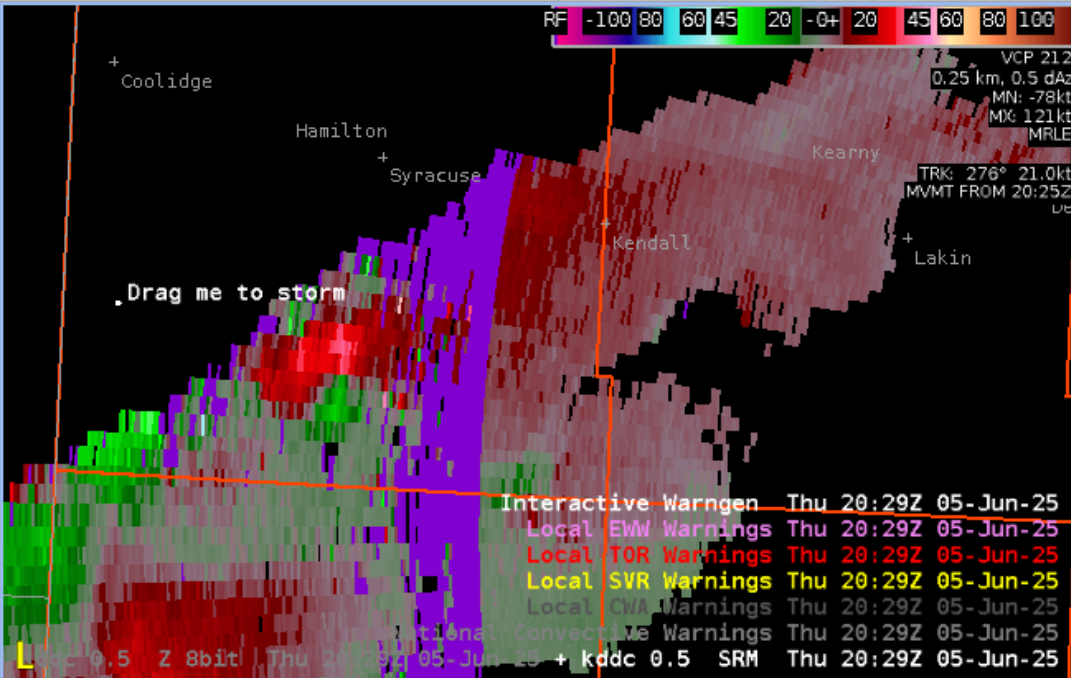
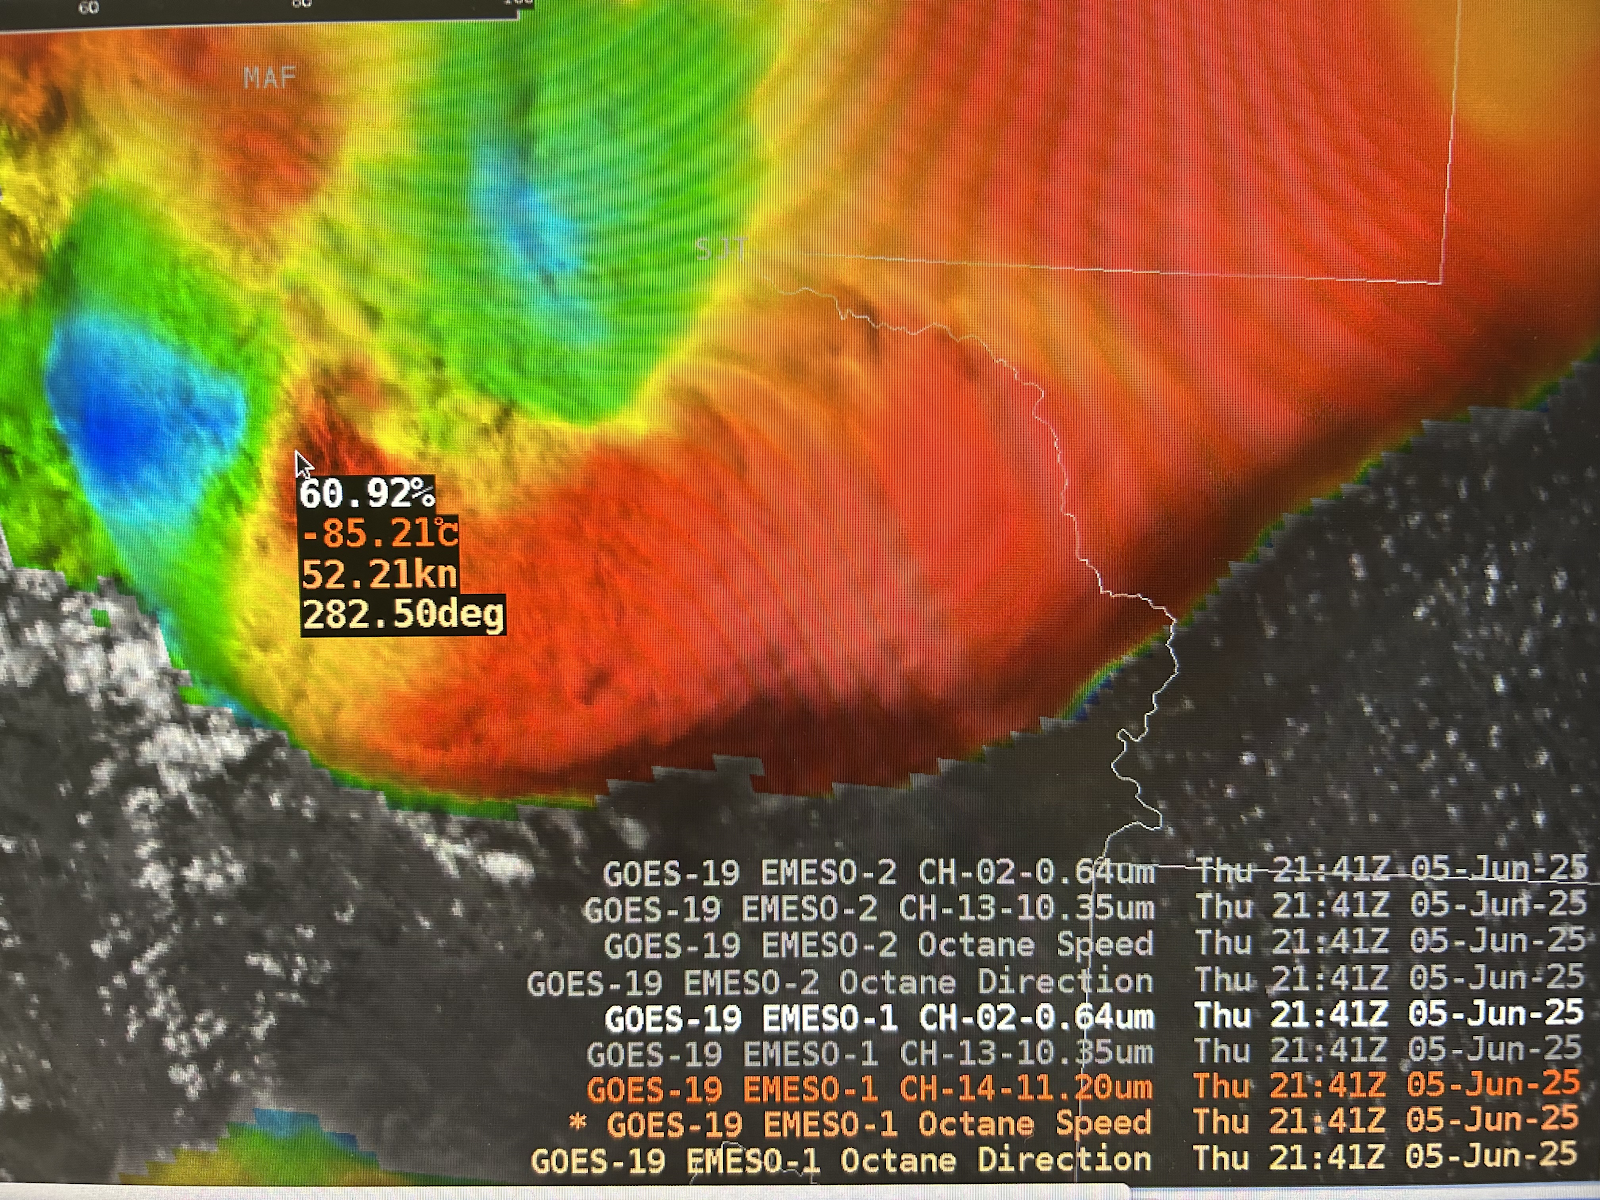
Lastly, OCTANE (below) proved to be useful again in warning operations. Robust, mature convection was ongoing and while it was “off to the races” in west Texas, the speed and divergence products continued to the tight gradient of speed divergence. We noticed that the compressed color scale was more “eye catching” to show the tight gradient. Below is a picture of the speed/direction divergence product with sampling turned on. The overshooting top was at an impressive -85C with winds out of the west at 50 mph. In this example, the gradient on the west side of the storm helped maintain our confidence of a powerful storm.

– Eagle

Tags: None

Supercells in Southwest Kansas

 Convection crossing into Hamilton County

Pretty much right at the start of operations, convection over southeast Colorado began pushing east into Hamilton County, KS. Looking at the first gif below (Figure 1 with the Octane 4-panel), you can really see a persistent divergence signal as the storm continued into the county. Additionally, probsevere (located in the top left panel) was pretty high, maxing out above 90%. Next, looking at the LightningCast panels in Figure 2, you can see the lightning jump occurring right as it crosses over the county line. Utilizing these products together and noting radar showing a mid-level meso with 50 dBZ over 35kft, we felt confident to go ahead and issue a Severe Thunderstorm Warning for this cell (shown in Figure 3).

Figure 1: Octane 4-panel with ProbSevere overlaid in the top left panel

Figure 2: LightningCast v1(left) and v2(right) with GLM


Figure 3: Radar Reflectivity with the Severe Thunderstorm Warning


GREMLIN (top left panel in Figure 4 below) did a pretty good job showcasing this cell, as well as another strong cell just to the southwest, however compared to MRMS (top right panel), it didn’t capture the stronger reflectivities as well, and was approximately 5-10+ dBZ off. So if I didn’t have radar access and could only rely on GREMLIN, I may not have felt as strongly about issuing a SVR.

Figure 4: GREMLIN 4-panel

I didn’t grab images of this, however later on, there was a clear decrease in the lightning activity, with noticeably lower divergence and cloud top cooling. This gave me the confidence to cancel my warning early.

Octane and ProbSevere

Later on, the same cell over Hamilton County began slightly cooling again, with ProbSevere noting 59% probabilities (top left panel in Figure 5). Additionally, there was a very clear mesocyclone noted in Figure 6. Using just these two products, I may have been inclined to issue at least a SVR warning. However Octane wasn’t noting much, if any, cloud top divergence or cloud top cooling. Lightning also didn’t look very impressive either. Noting this, I strayed away from any warning issuance (especially considering radar was sampling this storm at 12.5kft), which I think was a good call, at least for this time.

Figure 5: Octane 4-panel with ProbSevere overlaid in the top left panel

Figure 6: Storm Relative Velocity

LightningCast Dashboard for the DSS Event in Dodge City

Closer to the end of operations, the LightningCast dashboard (Figure 7) started showing higher probabilities of lightning, with the Max prob for a 10-mile radius showing 77%, v1 at 45%, and v2 at 30%. There were two supercells several counties west of the event that were expected to track southeast, missing the venue, however with the dashboard and CAMs showcasing the potential for lightning to reach the event, we were confident enough to fill out a DSS form and graphic (shown in Figure 8) with this information.

Figure 7: LightningCast Dashboard

Figure 8: DSS Graphic
It should be noted that v2 only highlights a 30% probability, and later on was ~44% lower than v1 (v1 was at 76%, with v2 at 32%. With this being at the end of operations, we couldn’t see if lightning actually occurred at the event, but I’d be interested to see if v2 actually had a better grasp on the convection tracking southeast and missing the event altogether, or if v1 showcasing the higher probabilities was the better option.
Final Thoughts from Day 4:
The Octane product really shined today, both in increasing my confidence to issue a SVR warning, and in talking me down from issuing a separate warning. I’ve been sold on the Stoplight colorcurve, with no smoothing (top right panel) coming out on top.
– Fropa
Tags: None

Nowcasting Convective Initiation and Evolution with OCTANE, GREMLIN, and LightningCast

SYNOPSIS – A remnant outflow boundary from previous convection was laid out across portions of west Texas. Heating and destabilization occurred along this boundary, setting the stage for scattered supercell development where convergence was maximized. Below are some observations and notes regarding data seen in OCTANE, GREMLIN, and LightningCast.

OPERATIONAL NOTES AND FEEDBACK – Nowcasting Convective Initiation with OCTANE and LightningCast.

As is so often the case in setups like this, there was a fairly large area of towering cumulus clouds and occasional attempts at convective initiation (CI) along the outflow boundary. For today’s operational period, I tried a 4-panel combination that included OCTANE products, LightningCast, and traditional satellite imagery (Figure 1).

Figure 1 – OCTANE Speed (top left); OCTANE Cloud Top Cooling/Divergence-no smoothing (top right); OCTANE Cloud Top Cooling/Divergence-medium smoothing (bottom left); VIS/IR Sandwich + LightningCast (bottom right)

As was seen in previous days of this experiment, OCTANE products helped to identify areas of towering cumulus that had the most vertical growth and, consequently, the greatest near-term potential for CI. This is evidenced by the green shading in both the OCTANE Speed and OCTANE Divergence products in Figure 1. One of the potential enhancements to nowcasting CI is LightningCast. While OCTANE appears to excel at depicting where towing cumulus has the most vertical development, LightningCast appears to excel at pinpointing which of those areas of more developed cumulus have a better chance at producing lightning. This essentially provides additional probabilistic information for trying to determine where CI may soon occur, which trickles down to knowing where to focus pre-CI IDSS.

In Figure 1, for example, an increase in lightning probabilities was observed just west of the WFO Lubbock forecast area, where OCTANE was highlighting increased vertical development of towering cumulus clouds. The increase in probabilities, plus consistently high probabilities, provided lead time on where CI would eventually occur. Note the consistently high probability of lightning in that area, as well as increasing probabilities to the south. Two separate supercells eventually developed in this area, and later went on to produce severe weather.

OPERATIONAL NOTES AND FEEDBACK – Nowcasting Convective Evolution and Intensity with GREMLIN.

For today’s operations, radar coverage was not a challenge, but GREMLIN data was still analyzed to determine if there is utility even in cases where radar coverage is sufficient. Today’s event highlighted several important observations about GREMLIN.

1) This is the first event during this week’s experiment in which 60+ dBZ echoes showed up on GREMLIN. This closely matched the 60+ dBZ cores seen on MRMS (as shown in Figure 2 below). It was noted by the developers that 60+ dBZ echoes offer a high likelihood of severe thunderstorms and this was, indeed, the case in today’s event. This suggests that GREMLIN may offer increased confidence in the occurrence of severe weather regardless of good or poor radar coverage.


Figure 2 – GREMLIN Emulated Reflectivity (top left); MRMS Reflectivity (top right)

2) For sustained, deep convection with cold cloud top temperatures and lightning in the anvil, GREMLIN may sometimes erroneously equate this to precipitation occurring at the surface. Note in Figure 3 below the area of 40+ dBZ echoes depicted by GREMLIN over the northwestern part of the Lubbock CWA. This area corresponds to nearby GLM lightning, but note that no precipitation is depicted by MRMS reflectivity or WSR-88D reflectivity (not shown).

3) When thunderstorms are close together with merging anvils, be aware that GREMLIN may treat this as one thunderstorm, instead of multiple thunderstorms, as seen in Figure 3. Note the one cell seen in GREMLIN data near the far western edge of the Lubbock CWA, then compare that with the two cells that actually existed (as seen in MRMS data). It should be noted, though, that GREMLIN did well to capture the most dominant of the two thunderstorms.

Figure 3 – GREMLIN Emulated Reflectivity (top left); MRMS Reflectivity (top right); GLM Lightning (bottom right)

OPERATIONAL NOTES AND FEEDBACK – Nowcasting Updraft Strength with OCTANE

Today’s event provided an interesting opportunity to nowcast two strong updrafts in close proximity to each other. In Figure 4 below, the OCTANE Speed product reveals a strong updraft developing within the divergent area of a nearby thunderstorm’s updraft. The developers noted that this is impressive because essentially the former updraft is strong enough to oppose the already enhanced, and modified, flow around the latter updraft, suggesting an increased risk of severe weather. The OCTANE Speed product appears to better depict what is happening to the flow aloft around both updrafts when compared to the VIS/IR sandwich product alone. I suggest using OCTANE and the VIS/IR sandwich product in tandem with each other when nowcasting convective updraft evolution.

Figure 4 – OCTANE Speed (top left); OCTANE Cloud Top Cooling/Divergence-no smoothing (top right); OCTANE Cloud Top Cooling/Divergence-medium smoothing (bottom left); VIS/IR Sandwich (bottom right)

– NW Flow

Tags: None

New Mexico and Texas Tornado Outbreak

We did warning operations today across the Lubbock TX CWA. Storms were beginning to fire up as we started, but took a while to mature. Multiple convective attempts were needed before a primary updraft took root. Seen below, is the transition from a sputtering narrow convective column to a deep mature storm. OCTANE helped pin-point this motion showing warmer/faster colors and stronger divergence.

An old outflow boundary, from yesterday’s activity across New Mexico and Texas, served as focus for convection. Soundings showed steep lapse rates through the column south of the boundary with a moist boundary layer.  North of the boundary, the boundary layer was stable as indicated by the billow clouds / undulating smooth stratus. Hodographs were long and straight, but we deduced that a tornado threat existed immediately along the boundary and perhaps a bit to the north where low-level helicity was more enhanced. We also surmised that the tornado threat would increase with time as the low-level jet ramped up and elongated the lowest portions of the hodograph.

Storms were initially in ABQ’s CWA and we issued our first warning around 2130z with a duration of one hour. I heavily used storm top divergence within my warning strategy as OCTANE showed 100+ knots and radar showed 145 knots at times. Combined with a BWER to 35k ft (-20C level was 22k ft) and 50dbz to 45k ft…I went with 2” diameter hail and 70mph winds along with possible tornado. I did not go tornado warning simply because that part of the storm wasn’t close enough to our CWA yet.

It was interesting to  note that the massive anvil from each of the two supercells merged causing GREMLIN to show only one primary core. The extreme DBZ values within gremlin added confidence to the severity of the cells within the anvil. Another interesting thing is that the northern cell died down shortly after this image was captured resulting in only one primary cell reminiscent of the above image.

Towards the end of operations the now mature primary supercell showed strong divergence within OCTANE and a wake near and immediately downstream of the overshooting top, indicative of a very strong and likely severe storm.

We ended up issuing a tornado warning as the storm neared the state line, which verified as broadcast media reported a tornado just east of the Texas line. Our warning had about 17 minutes of lead time. Additionally, 1.75 to 2 inch hail reports were on the New Mexico side of the state line during the time of our SVR warning…with a 3 inch hail report coming in on the Texas side as the testbed came to an end.

Overall, OCTANE aided our warning decisions significantly…the addition of satellite-derived storm top divergence was a good confidence nudger and helped us get half an hour to an hour lead time on large hail and over 15 minutes on a tornado. LightningCast and OCTANE helped guide us toward which cell would eventually become dominant during the initiation phase.

– WxAnt

Tags: None

MAF Isolated Convection with LightningCast, Octane, and GREMLIN

 LightningCast

Towards the beginning of operations, there wasn’t much to look at in the MAF CWA, however just to our south, LightningCast was able to pick up on the cell shown in Figure 1 below pretty well before the first lightning strike. It was interesting to see that v2 increased the probabilities to 50% before v1, however v1 increased to 70-90% before v2 a couple frames before GLM depicted the first lightning flash. So in this case, both versions did well in detecting this cell’s lightning potential, with version 1 taking the lead in the higher probabilities right before the lightning occurred.

Figure 1: LightningCast v1 (left) and v2(right)

Another example of version 1 taking the lead is in a different cell just south of Redford, TX shown below in Figure 2. Both versions caught on to the cell at the same time with the 10% probabilities, however as the cell continued growing, version 1 seemed to hold on to the higher probabilities more so than version 2 before GLM showed the first lightning flash.

Figure 2: LightningCast v1 (left) and v2 (right)

Octane & GREMLIN

I really liked assessing the cloud top cooling in the Octane 4-panel in the image below. You can really parse out that cell just south of Redford, which ended up also upticking in LightningCast probabilities (not shown). This was a great way to keep up the situational awareness and determine which cells needed more focus, especially being without radar to assist.

Figure 3: Octane 4 Panel

GREMLIN also picked up on this cell, which I thought did a pretty good job. It’s hard to assess whether or not it matched up with radar since we weren’t using radar today, however I think with the lack of lightning, and a newer cell, the GREMLIN imagery looked fairly good.

Figure 4: GREMLIN

This cell later went on to grow fairly tall, with GREMLIN actually depicting  a >60 dbZ echo and Octane showing pretty consistent divergence (not shown), so we ended up issuing a warning. I thought GREMLIN did really well, and led to higher confidence in issuing a warning without having actual radar data.

Comparing Octane Color Curves

With little convection in our CWA, I was able to take some time to compare the Octane colorcurves (Stoplight vs. Original). Before today, I tended to gravitate more towards the original colorcurve with Magenta hues as the divergence and the stoplight colors as the cloud top cooling. However the two images below show both color curves at 20:22Z – In this example, the magenta color curve in Figure 6 would lead me to believe the divergence was fairly good in this cell. But the stoplight color curve shows the divergence actually isn’t as good. Comparing this to lightning, GREMLIN, and IR satellite imagery, I like how the stoplight color curve “talked me down” to be more realistic of what was actually going on. So for day 3, the stoplight color curve took the lead.

Figure 5: Octane Stoplight Color Curve (for Divergence)

Figure 6: Octane Magenta Color Curve (for Divergence)

-Fropa

Tags: None

Warning Without Radar Data in Northern New Mexico

Day 3 of the testbed offered a unique opportunity to issue real-time warnings without access to radar data. Having never been in such a situation before, it was an eye-opening experience.

Mesoanalysis showed very steep lapse rates, a long and straight hodograph, high LCLs and a fairly deep mixed layer with relatively low surface dew points. This allowed us to key in on large hail and severe winds being the primary hazards. Additionally, equilibrium levels were only around 9km so hail much larger than 1” was determined to be unlikely.

We issued our first warning upon noticing a rapid uptick in updraft intensity on OCTANE, which showed cooling cloud tops, fast motions, and strong divergence aloft. This storm was located west of Albuquerque in a sparsely populated area so it is difficult to say if the warning verified or not. Gremlin showed a similar uptick in simulated reflectivity which added weight to our decision to warn.

We issued additional warnings as the storm traveled into the Albuquerque area. A second and third cell began to strengthen as well, and two more warnings were issued with the southwest storm looking the most intense on OCTANE. Our mesoanalysis determined that the low-level cumulus field east of the northeastern cell appeared flat and was therefore stable…so weakening was anticipated as it moved off the Raton Mesa.

As expected the northeastern cell began to weaken and dissipate, which was evident on OCTANE and Gremlin. The two cells further southwest continued to look strong, and warnings were maintained into the Albuquerque metro. A hail report of 1” was received at this point on the southern margin of the city.

Lastly, lightningCast showed the northeastern cell begin to weaken before its appearance on satellite degraded significantly. This allowed us to cancel the warning early, in conjunction with noticing the downward trends in OCTANE (weakening cloud top divergence).

During the course of the event we had to keep tabs on a fictitious DSS event, and used LightningCast and its associated dashboard to determine when lightning was approaching their critical threshold (10 miles). LighgtningCast did a good job with lead time as it had 70 percent or higher before any lightning was detected nearby.

– WxAnt

Tags: None

Tornado Warning St. Louis Without Radar

Top left: GREMLIN simulated reflectivity

Top right: ELTLN lightning 1 min flash, 5 min CG flash, NLDN 15 min CG Flash 1km

Bottom left: GOES East Meso-1 Channel 13

Bottom right: GREMLIN radar with GLM flash extent density image overlaid

While the environment for this area was questionable (shear was <30kts) and we were unsure whether we wanted to even use this sector, it ended up being a fruitful area to observe signals and experience challenges associated with warning without radar in real-time.

Generally, the rhythm we fell into for warnings was using the GREMLIN product to track the storm cores and draw the polygon and cross-referencing with ground-based lightning networks to make sure parallax was accounted for.

Prior to making warning decisions, or when deciding to cancel an active warning, we would monitor the lightning (ground-based and GLM) to make sure it was increasing/intensifying or at least sustaining. LightningCast was consistent in probabilities for the warned area, so it did not provide much of a signal in terms of convective intensity and maintenance of severe storms.

Left: Day Cloud Phase Distinction satellite RGB with GLM and LightningCast version 1

Right: Day Cloud Phase Distinction satellite RGB with GLM and LightningCast version 2

Top left: GREMLIN simulated reflectivity

Top right: ELTLN lightning 1 min flash, 5 min CG flash, NLDN 15 min CG Flash 1km

Bottom left: GOES East Meso-1 Channel 13

Bottom right: GREMLIN radar with GLM flash extent density image overlaid

Around 19:45 UTC, lightning intensity trends (as observed on GLM) combined with cooling intensity and divergence of the cloud tops on OCTANE products led to the decision to issue a Severe Thunderstorm Warning with hazards of 60 mph winds, penny-sized hail, torrential rainfall, and lightning. Around 1951 UTC, a report came in indicating that a tornado was on the ground just north of the St. Louis metropolitan area, within the Severe Thunderstorm Warning polygon we had issued based on GREMLIN data. This prompted the issuance of a tornado warning, in combination with new SPC mesoanalysis data showing low-level hodograph curvature that would support low-level rotation using the “two out of three” framework (radar, reports, environment).

SPC Mesoanalysis 20 UTC June 4 2025: Hodographs

Top image: GREMLIN data with simulated Severe Thunderstorm Warning and Tornado Warning polygons

Bottom image: Graphic for posting to social media and Slack warning the public and partners about this high-profile hazard in a major metro area.

-prob30

Tags: None

Day 3- Using GREMLIN and OCTANE in Warning Operations

Thunderstorms initiated over the Colorado Plateau, west of the City of Albuquerque, and over the Sangre de Cristo Mountains early in the afternoon on Wednesday, June 4, 2025.  Afternoon mesoanalysis showed instability of 1-2k J/kg and very steep mid-level lapse rates across the CWA. Effective shear of 40-45kts was present east of the Colorado Plateau. Supercell composite was low. The storm motion was roughly southwest-northeast as a shortwave trough moved across the four corners region.

Our warning team did not have any radar data, including the Albuquerque radar as well as MRMS data. This made satellite imagery and lightning data imperative tools in the warning decision process. Thankfully, a mesoscale sector was across the region for the duration of the event. The first storm of concern developed southwest of the City of Albuquerque just before 20Z on June 4, 2025.

I used GREMLIN EMeso-2 and ECONUS as an alternative to radar and MRMS data in the Albuquerque, NM CWA on Day3 of the HWT. Below is a 4-Panel of Gremlin highlighting the storm southwest of ABQ. This storm was alone and believed to have a tight reflectivity core. Personally, this is the greatest reflectivity core I have seen so far in the HWT this week. Reflectivity approached 55-60 DBZ and really caught my eye. GLM flashes were not as impressive as I would have thought, however ELNTN was jumping up during this time (not shown.)

The OCTANE speed-compressed product showed a developing updraft with cooling cloud tops and an expanding anvil. There was a tight gradient on the west side of the storm showing good speed divergence. Also, another developing thunderstorm was starting to catch our eye northeast was also growing with good speed divergence.

The combination of GREMLIN, OCTANE, CH-13 Clean IR, lightning, LightningCast (not shown) gave us confidence to issue the first severe thunderstorm warning of the day.

-Eagle

Tags: None

Operational Feedback of Gremlin, Octane, and LightningCast during a Severe Weather Outbreak in Central Oklahoma

I tested the OCTANE, GREMLIN, and LightningCast products during an actual severe weather event on 6/3/2025. My role during this testbed was that of the mesoanalyst.

Initial environmental analysis shows weak to moderate shear, which was determined via ARARS soundings and SPC Mesoanalysis, along with OCTANE imagery showing divergent / accelerating speeds within the storm anvils. VAD hodographs were used as convection developed to see rapid changes within the shear profile during the course of the event (as convection altered the broader environment). Shear increased as the event progressed. OCTANE and LightningCast were both useful showing the uptick in storm intensity as shear increased.

LightningCast was very useful picking out developing updrafts and embedded updrafts within broader areas of convection. We used this product to gauge which updrafts had the greatest potential to become severe in the near term. A strong uptick in lightning would indicate a rapidly strengthening updraft which would warrant further interrogation.

Similar to LightningCast, OCTANE was useful in determining which updrafts were trending towards severe. While in the mesoanalyst role, I would check to see which updrafts looked most intense (warmer colors paired with a very bubbly/convective appearance) and showed strong divergence. Radar analysis would then help us determine which individual cells to warn on, especially if the area of convection is multicellular and warning the entire thing isn’t ideal.

I didn’t use GREMLIN as much, since this area had good radar coverage. However, I did use it to keep tabs on its performance. The product seems to do well with picking out the strongest discrete/semi-discrete cells and potentially struggles with smaller/shallower storms and mergers.

Using these products, and working as a team with good communication, we were able to successfully warn a tornado in the Norman area along with various severe wind and hail.

– WxAnt

Tags: None

PUB LightningCast and GREMLIN Nowcasting

LightningCast

For this first day, I started out looking at Lightning Cast to gain familiarity with version 2 and see how it compares to version 1. The first thing I noticed was in southwest Pueblo County, where there seemed to be fairly frequent lightning. Version 1 in the top left panel (Figure 1 below) actually decreased in probability from 70% to 50%, whereas Version 2 in the top right panel remained at 70%. With both GLM and ENTLN depicting ongoing lightning, I think both versions should be showing higher probabilities. I’m wondering if it’s because both versions are so focused on the convection moving into southeast Pueblo County that they’re less focused on the stratiform lightning/less mature convection?

Figure 1: Four panel comparing LightningCast v1 (left panels) and LightningCast v2 (right panels)

Additionally, I tested out using the LightningCast dashboard for Fowler, CO beginning at 3PM MDT. One interesting thing to note was that it seemed to match better with the version 2 LightningCast in AWIPS versus with version 1, however both versions weren’t too far off. In the Figure 2 below, the left panel (version 1) shows between 30-50% probability of lightning, whereas the right panel (version 2) shows Fowler (purple dot in the image)  right on the border of the 70% probability. Comparing that to the dashboard (Figure 3) for the same time, the yellow line (version 1) depicts a 54% probability, with the green line (version 2) showing an 84% probability for 21:18Z. With MRMS reflectivity at the -10C level showing a cell up to 42 dBz just southeast of Fowler, I would tend to lean towards utilizing version 2.

Figure 2: LightningCast v1 (left panel) and LightningCast v2 (right panel)

Figure 3: LightningCast Dashboard

One final note on the LightningCast Dashboard – I thought it was interesting to see that version 1 in Figure 4 below, the yellow line (version 1) shows two separate upticks in lightning probability versus the green line (version 2) showing a steady decline in probability.

Figure 4: LightningCast Dashboard

GREMLIN

I was also able to look at GREMLIN, which was my first time assessing this product. Figure 5 below shows a four-panel, with GREMLIN (top left), MRMS Reflectivity (top right), Satellite IR sandwich (bottom left), and GLM Flash Extent Density (bottom right). Just looking at MRMS and IR, the first cell that draws my attention is the cell in southeast Pueblo County as it has higher reflectivities and cooler cloud tops. The cell in southern Otero county looks like the cloud tops are slightly warming with time. However once we start looking at GREMLIN, those two cells look to go back and forth in reflectivity, leading to less confidence in overall intensity. If I were located in an area with poor radar coverage, or if a radar was down and I had to rely on GREMLIN, it may not be straightforward as to which cell could eventually warrant a warning.

Figure 5: Four Panel comparing GREMLIN (top left), MRMS Reflectivity (top right), Satellite IR Sandwich (bottom left), and GLM (bottom right).

That being said, Figure 6 below shows a screenshot of the same four-panel at 21:41Z, which shows GREMLIN having a pretty good grasp on the convection in Stanton and Morton counties (just outside of the PUB CWA). So in this instance, confidence in the GREMLIN product would at least be higher than the previous example shown.

Figure 6: Four Panel comparing GREMLIN (top left), MRMS Reflectivity (top right), Satellite IR Sandwich (bottom left), and GLM (bottom right).

Final Thoughts for Day 1

Overall I enjoyed testing out both of these products. I definitely want to get more hands-on experience with GREMLIN as well as the LightningCast dashboard in order to see these in different scenarios/environments.

– Fropa

Tags: None