Use of Cloud Phase Distinction RGB to anticipate convective initiation over Western Dakotas and Eastern Montana

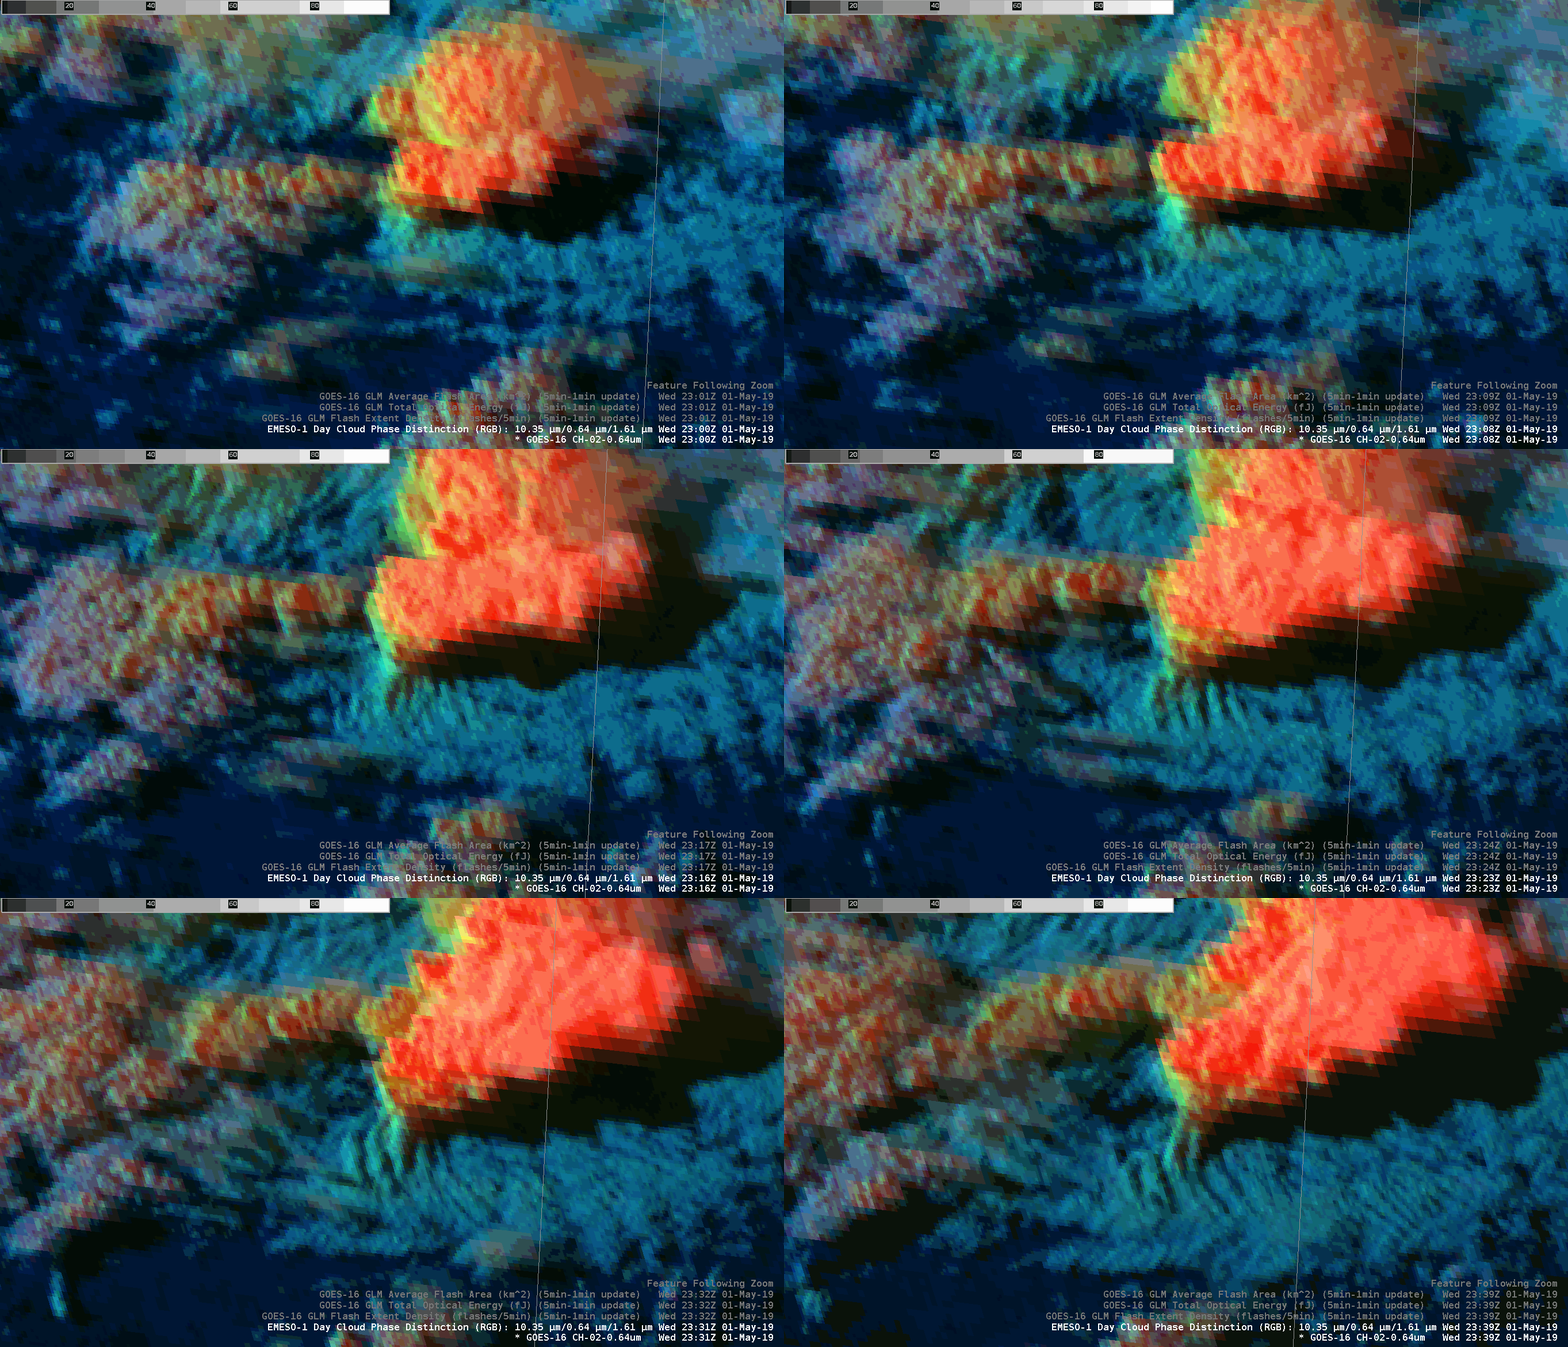
Some members of the 12z Thu Jun 10 HREF run were a bit slow in initiating convection or too far east in developing convection over the Northern Plains. The NSSL WRF-ARW was closest to reality with respect to exact timing and location. A special 18Z RAOB from Glasgow (GGW) MT and the Cloud Phase Distinction RGB proved to be very helpful in showing convection was going to develop earlier than anticipated by the HREF guidance. The 18Z RAOB from GGW (below) showed weak CINH values, while the Day Cloud Phase Distinction RGB (second graphic) showed an agitated cumulus field that was becoming quickly glaciated (single cell with yellow cloud top near the 93/61F sfc obs) indicating deep convective development was imminent.

Once deep convection initiated, single channel ‘Clean IR’ imagery and Day Convection RGB became more useful in determining updraft strength. These two products can be extremely useful in severe weather detection and warning decision making especially in absence of radar and/or lightning data or when used combined due to its faster temporal coverage (1-min in meso sector vs 5-min from radar).

The image above shows updrafts getting stronger in the 10.3 micron imagery (bottom left), and on the Daytime Convection RGB (bottom right) by evidence of yellow (red +green) pixels. Inflow feeder bands, a flanking line, towering cumulus above an invigorating RFD or flanking towers, and above anvil cirrus plume are also observed in the Day Cloud Convection and Cloud Phase Distinction RGBs (top panels) indicative of the storms likely being severe. In fact, the ProbSevere v3 and v2 output both indicated a very high probability of severe weather occurring with these storms with values over 90% (purple colors).

Let’s do the wave

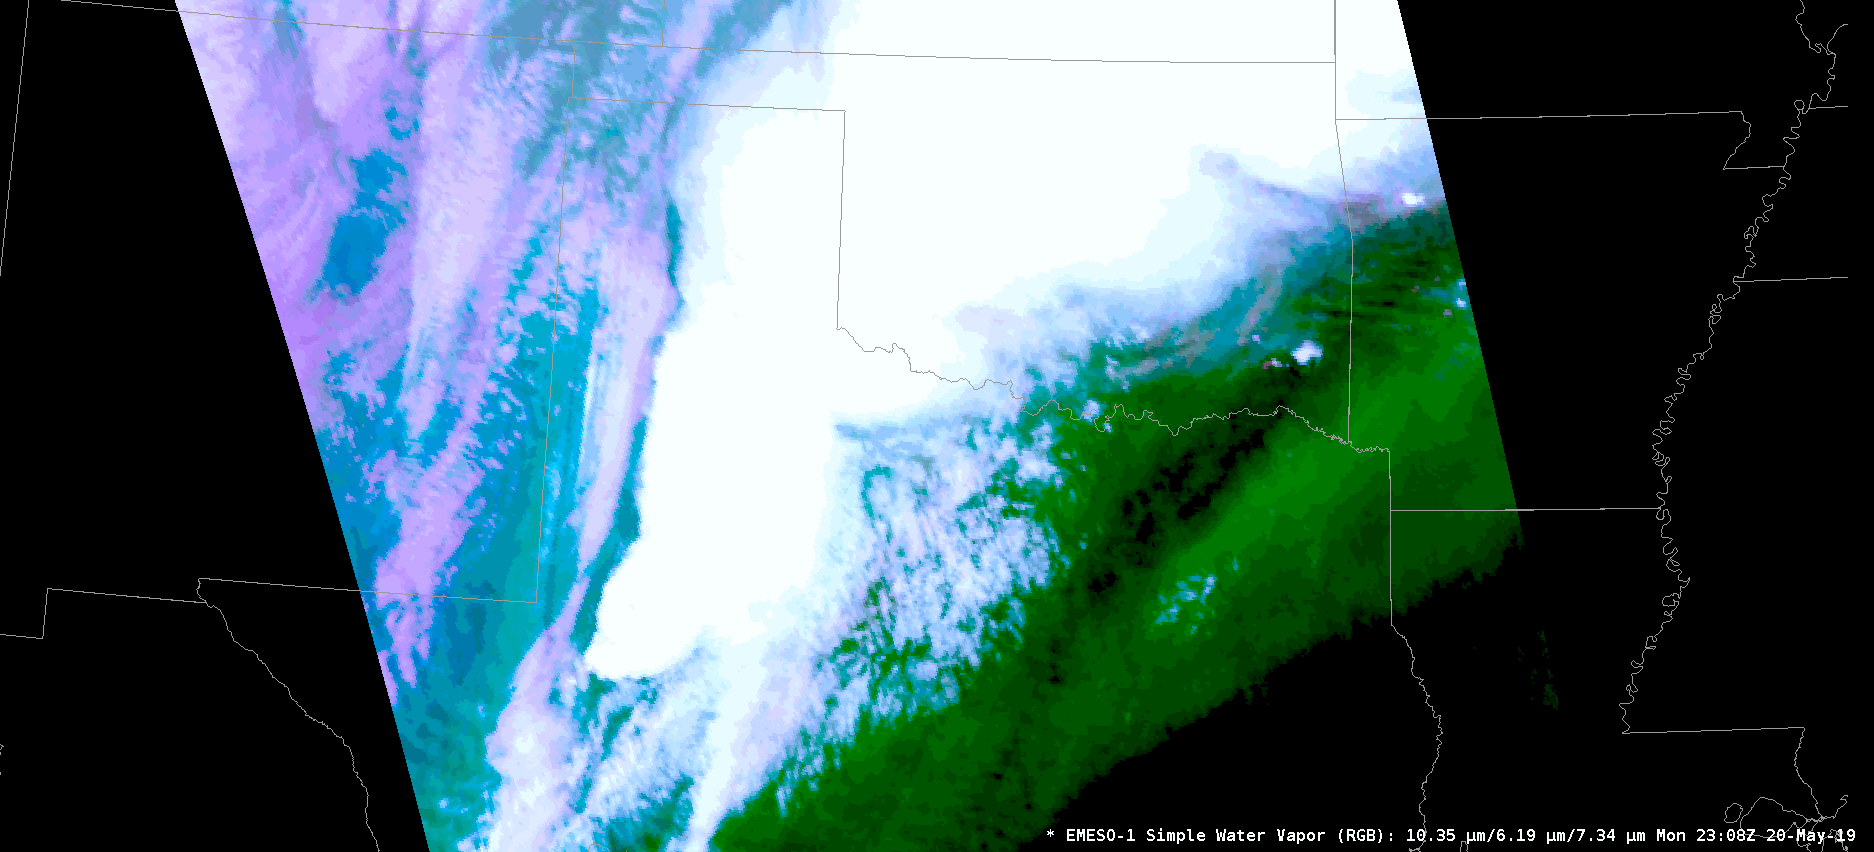
Seeing some interesting waves at different layers on the Simple Water Vapor RGB this evening. As a reminder, the simple water vapor RGB is made up of the low level water vapor image (band  10), the upper level water vapor image (band 8) and the clean window IR image (band 13).

There is one area of east/west waves along the Oklahoma/Arkansas border. The main contribution to those waves is the green channel, so we are “seeing” those waves based on the upper level water vapor.

The other is to the west of the severe convection in west Texas.  These waves have contributions from all the channels.

Thorcaster

Pinwheel Fronts In The Dakotas

Mid afternoon into early evening saw a bretty good bloom of supercells along a SSW-NNE Cold Fronf in North Dakota…

Thru the period the SVRProb and SVRtor seemed to regularly over warn during this outbreak, BUT SVRHail was spot on, a little False Alarm-y, but it sure didn’t miss the Large Hail reports, with %s >90 both instances.  The RGB Day Convection GOES product seemed to respond pretty well with the hail instances as well.
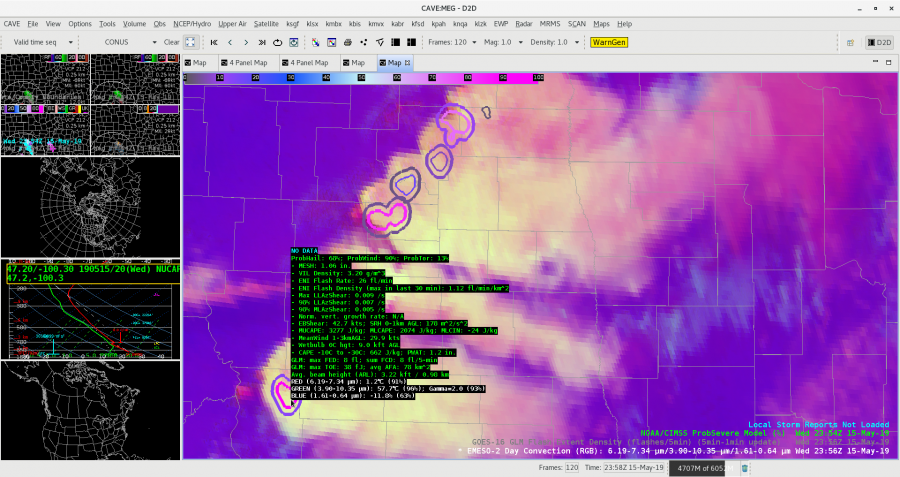
Afternoon NUCAPS over forecast the CAPEs by ~ 500, PW by 0.2″, did well with the Downrush temp and DCAPE tho.

Above Anvil Cirrus Plumes and GLM

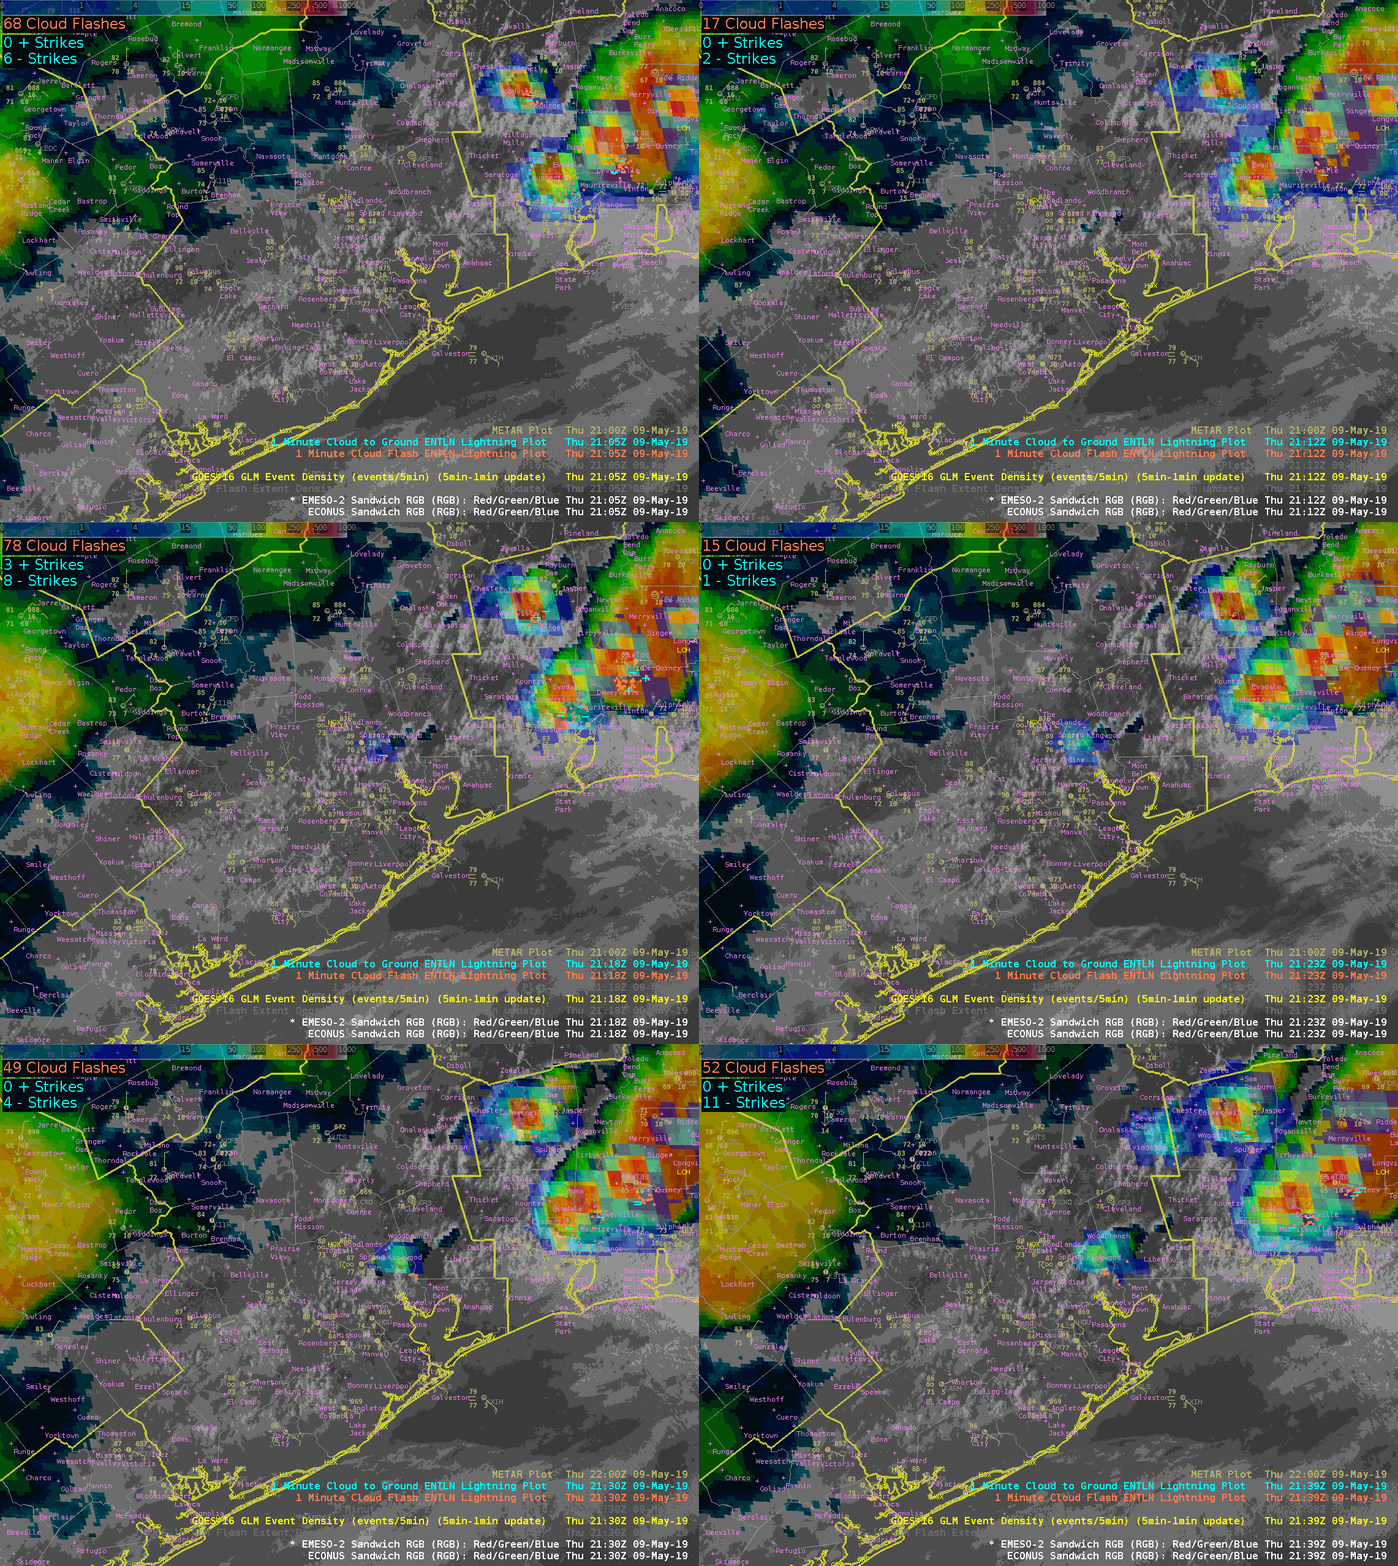
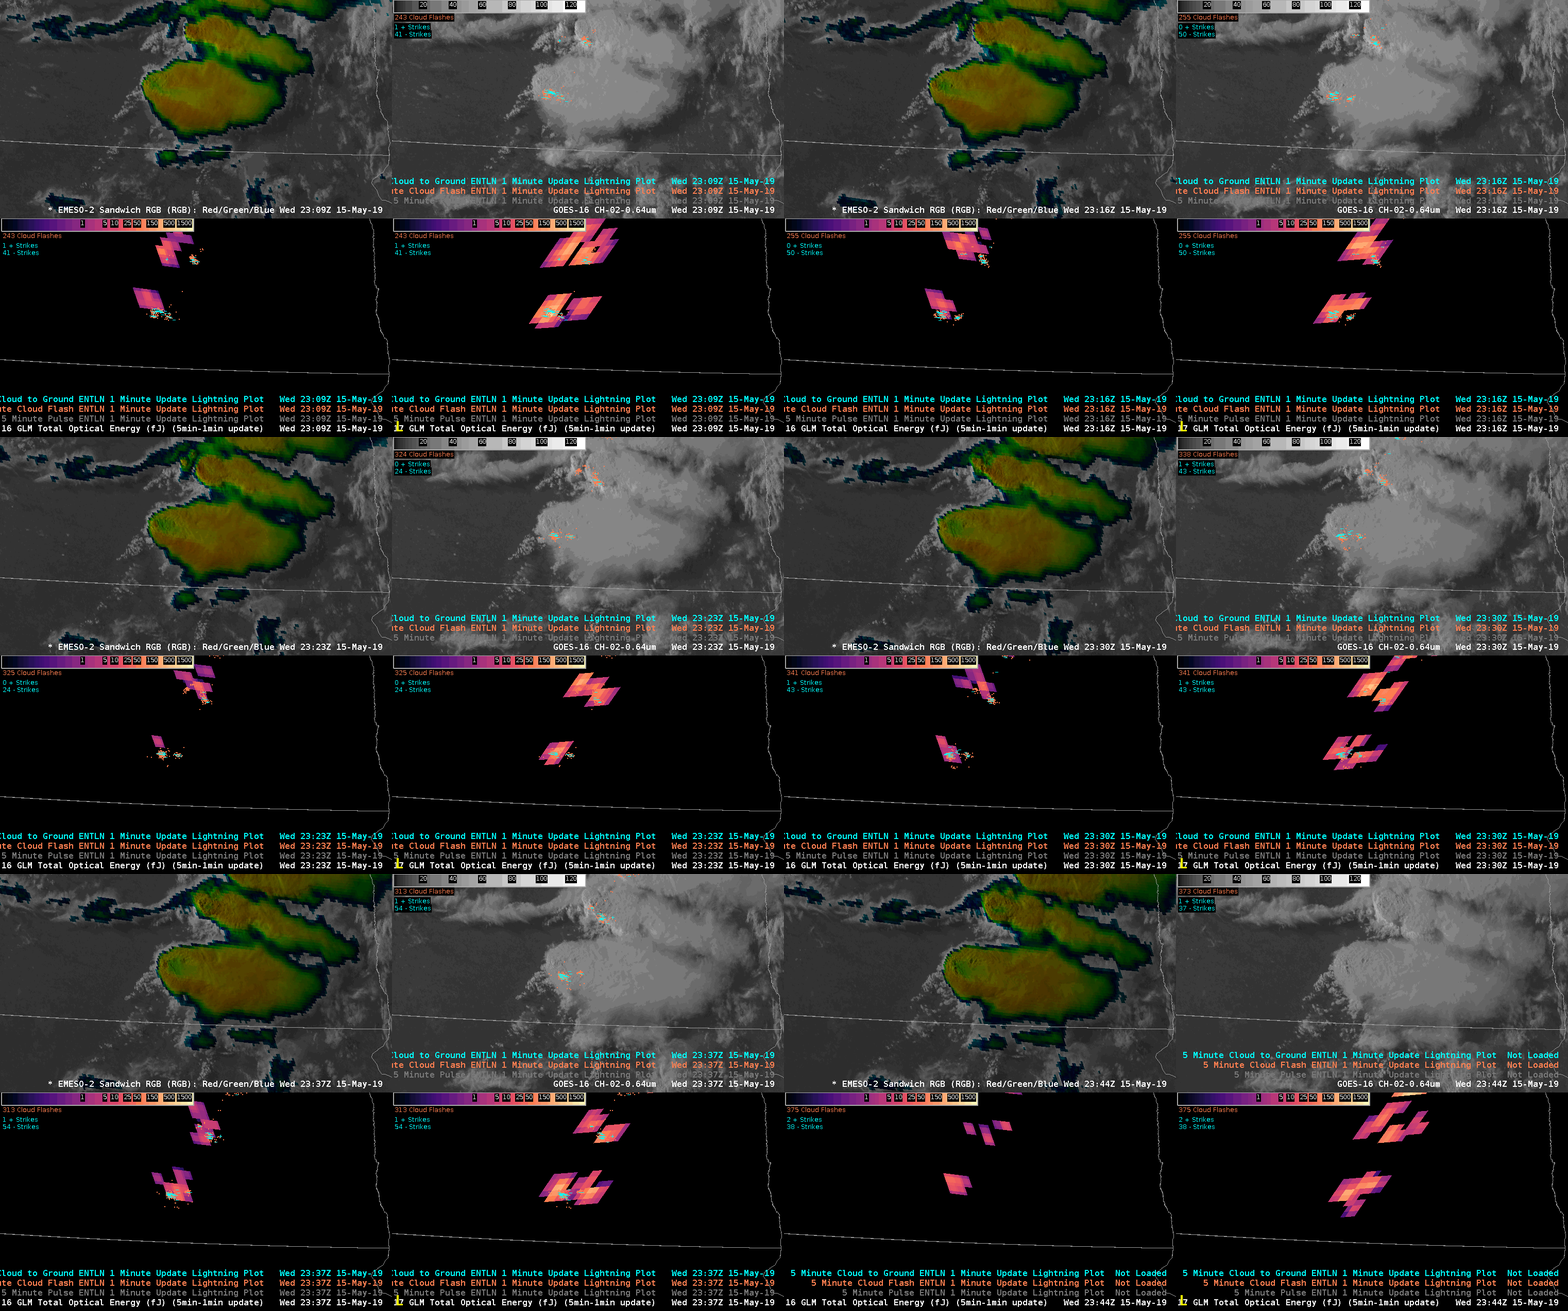
This post will ask more questions than make assertions 🙂 We currently see evidence of a weak above anvil cirrus plume (AACP) based on the GOES-16 Sandwich RGB (upper left) and CH02 visible (upper right). Total Optical Energy from GOES-16 (GOES-17) is plotted on the lower left (right).  For reference, three of the four frames have 5 minute ENTLN data.

I’ve wondered if an AACP could extinguish a significant amount of Total Optical Energy (TOE) if lightning was occurring underneath. There are too many caveats here to draw any conclusions, such as:

  1. Extreme viewing angle for both GOES satellites resulting in significant parallax.
  2. A large viewing component of the sides (instead of just the tops) of the storms, resulting in possibly large and highly variable reflectances that might be harder to calibrate TOE against.
  3. Uncertainty regarding ENTLN efficiency and accuracy this far at the fringe of the ground network.

So, with all of that being said, what we see here is interesting. ENTLN does show two areas of lightning. GOES-16 picks up on the western area but not the area under the plume (at least not at first). GOES-17, on the other hand, has a better grasp  on there being two areas throughout.

I hypothesize that GOES-16 is struggling more in this particular scene because of the large reflectance and possible forward scattering issues that GOES-17 is not as susceptible to at this particular time of day.

Again, this is not a great setting to test any hypothesis about how much an AACP is able to throw a blanket over GLM detections. However, I’m confident that next week will provide many opportunities to test this with extremely stout AACPs at far more optimal latitudes.

#MarfaFront


This was interesting

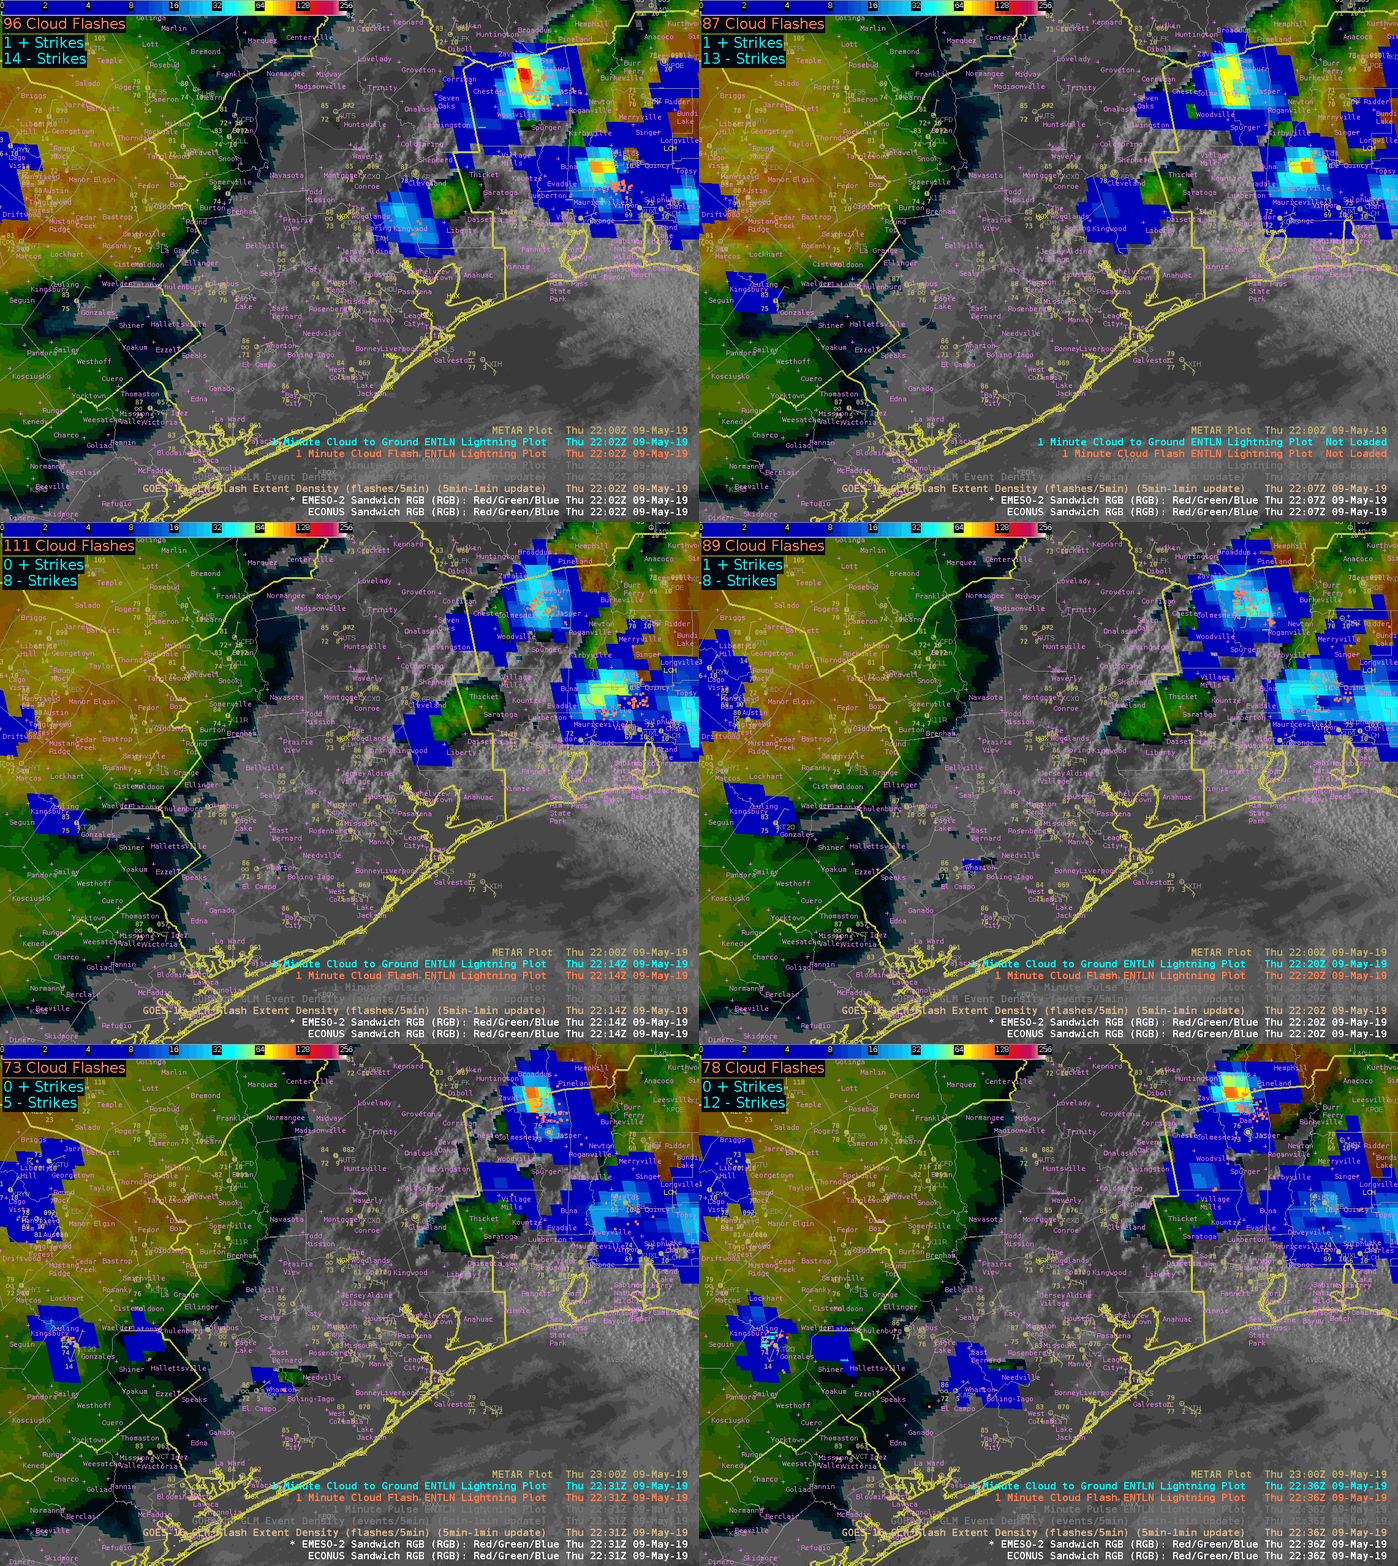
Since things were kinda boring over HGX today I had to look for things to blog about. Here is something interesting that I noticed with the Vis/IR Sandwich RGB. At the beginning of the loop the RGB didn’t show any IR brightness temperatures. As the TCU continued to develop we saw pixels of IR brightness temperatures starting to show up indicating cold cloud tops and the potential for glaciation to start. Low and behold, if we continue to watch the loop, more pixels start showing up…and a few minutes later both GLM and ground based networks picked up on a couple of CGs. As the thunderstorm developed, cloud tops cooled and more pixels started getting displayed we began to see more lightning.  This was something that I didn’t expect the RGB to pick up on and potentially helpful for situational awareness and IDSS in the west where most lightning tends to come from single cell thunderstorms. If you are able to pick up on these ahead of time you may be able to some lead time before lightning occurs.

Update…it happened again, pixels starting being displayed and then lightning occurred within a couple of minutes. If this generally hold true for single cell thunderstorms this would be awesome for outdoor IDSS.

Spectacular 1 min GOES satellite imagery of a Colorado supercell

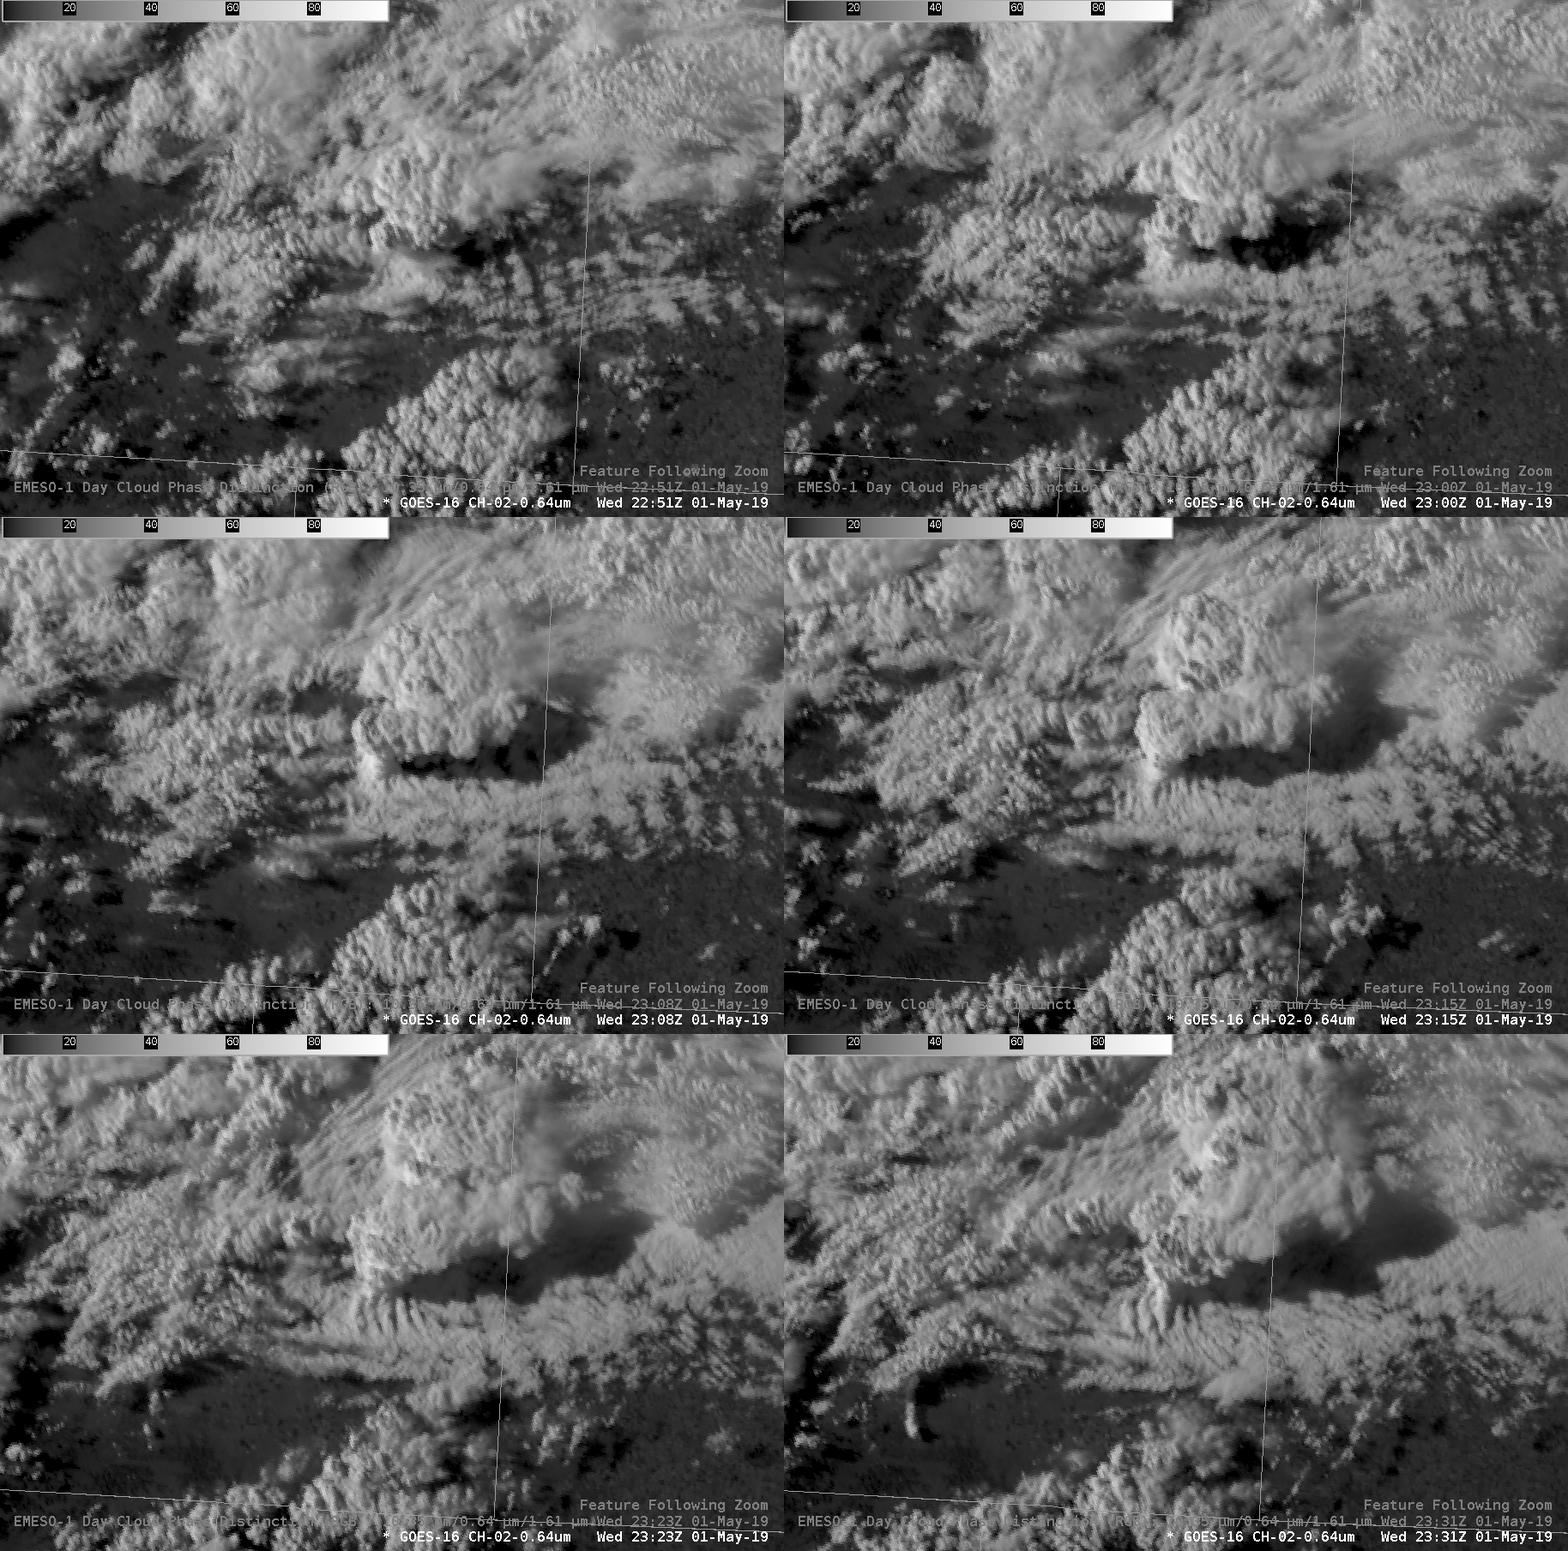
Using feature following zoom to stationary view track a supercell  in ECO. Many things visible here, including uplift and twisting of stratus deck in the inflow region, anvil plume texture, and updraft texture. The parallax error ends up helping the user get more info about the vertical structure and composition of the storm – contrary to the often requested need for ‘parallax corrected’ imagery.

Day cloud phase 1 min of the same storm. Does not get much better than this!

-Dusty Davis