Springfield Illinois Storms

Right now I’m analyzing the various new products to nowcast where and when storms will intensify. Currently I’m comparing ALLsky cape to the mesoanalysis from the spc. Right now the mesoanalysis is higher with cape compared to allsky. Over our area the it’s cloudy so the it’s taking data from the GFS.

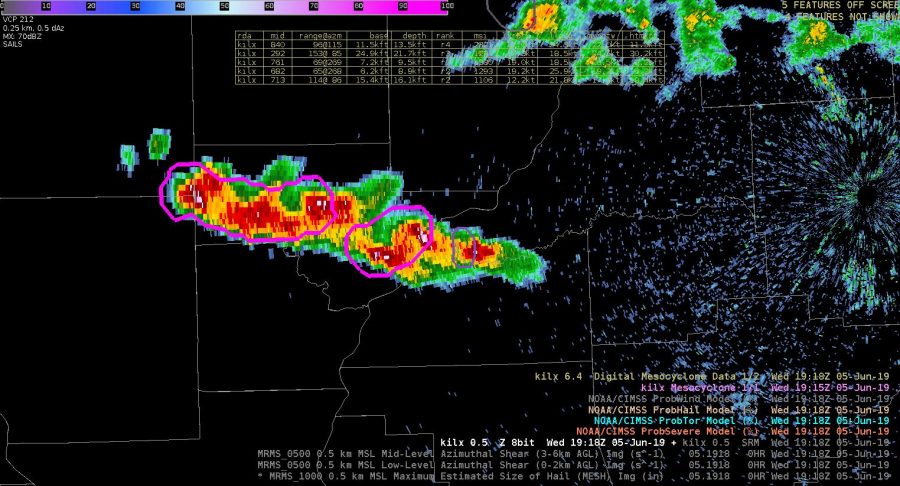
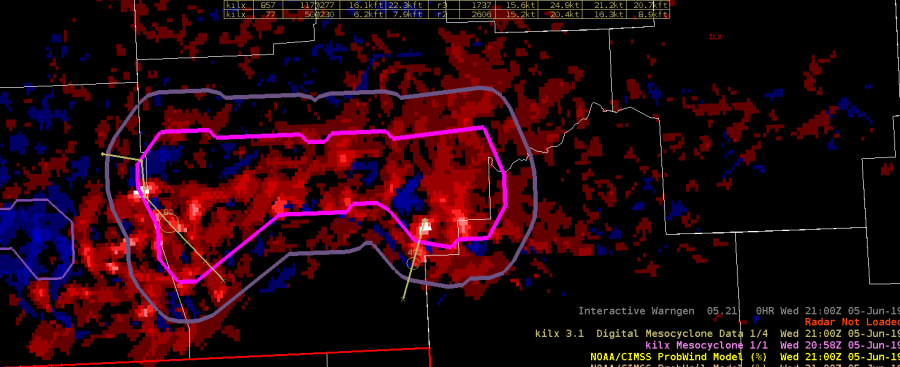
A cell in our western counties ramped up very quickly while our computers were down. Prob severe immediately directed our eye to the cell. The probsevere lined  up with an uptick in vil values and velocity.
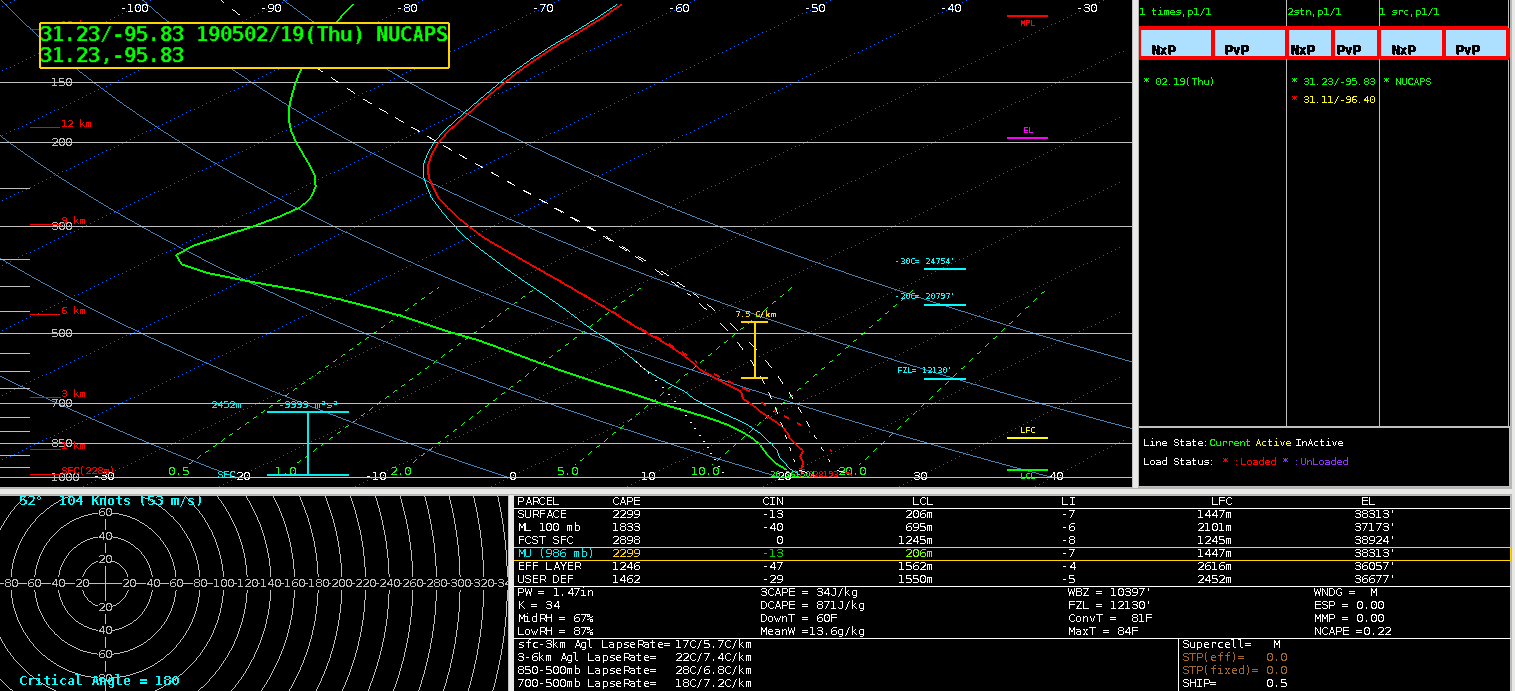
I’m comparing the actual sounding to what’s shown on nucaps, and allsky to see what’s initializing the best. The actual sounding shows 3025kj of surface lavyer cape and 1453 of mixed layer.
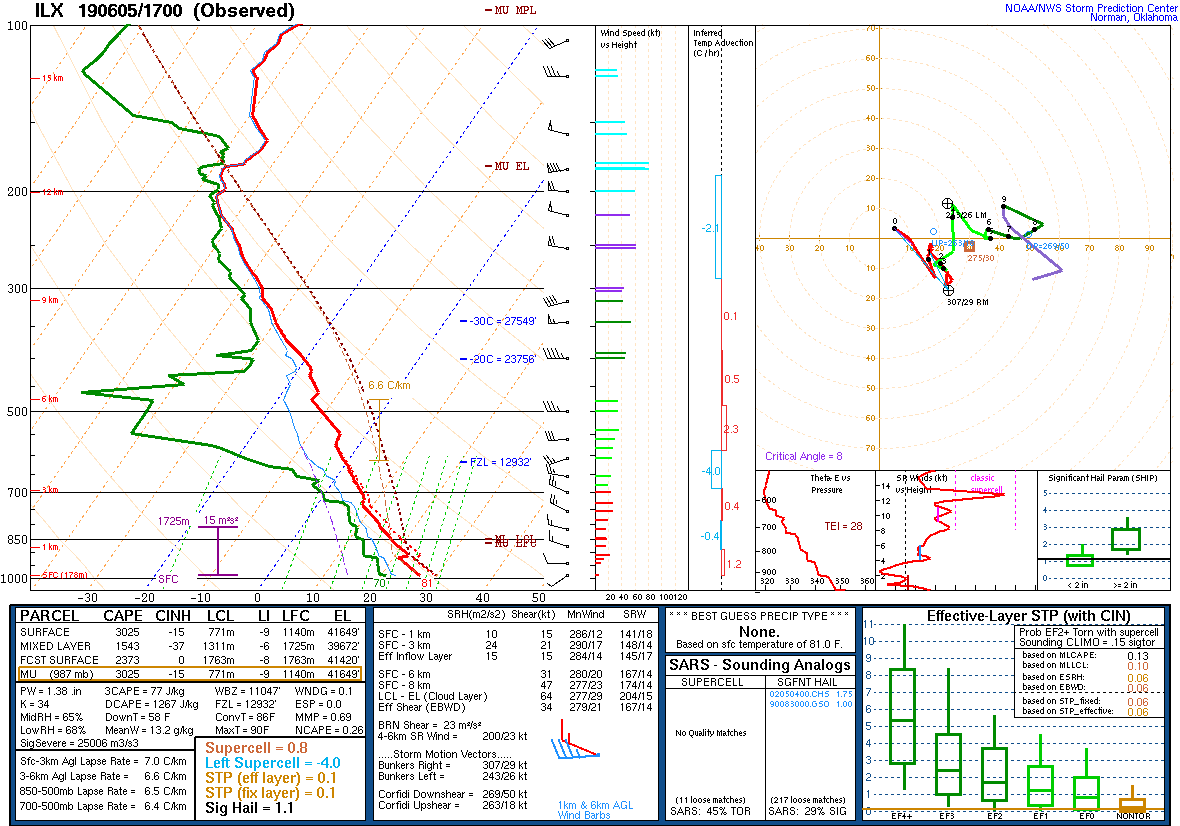
Around the same time allsky shows a similar value of cape.

The modified sounding was closest to the actual sounding with 1515kj of mixed layer cape
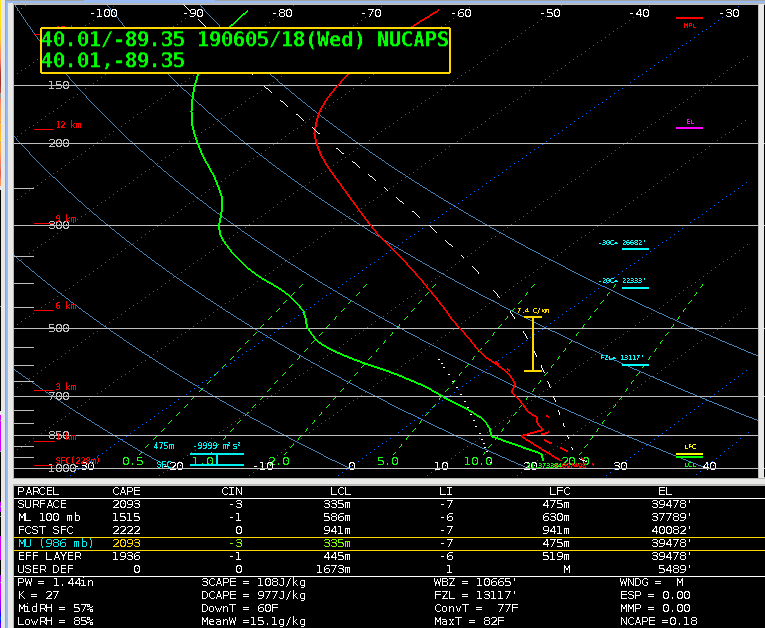
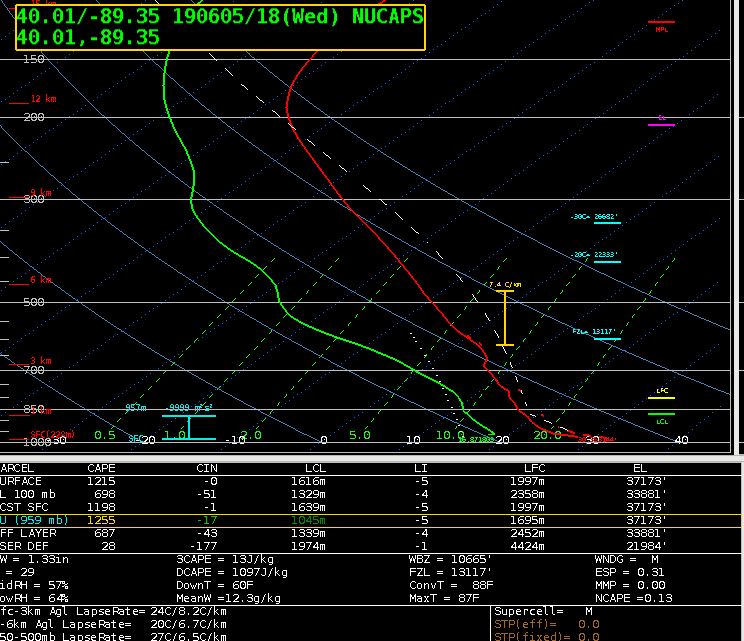
The nonmodified sounding is much lower when it comes to mixed layer and surface cape. In the case the modified sounding was more reliable and gave a more accurate picture of the current state of the atmosphere.
The all sky cape was much higher, around 2300kj.
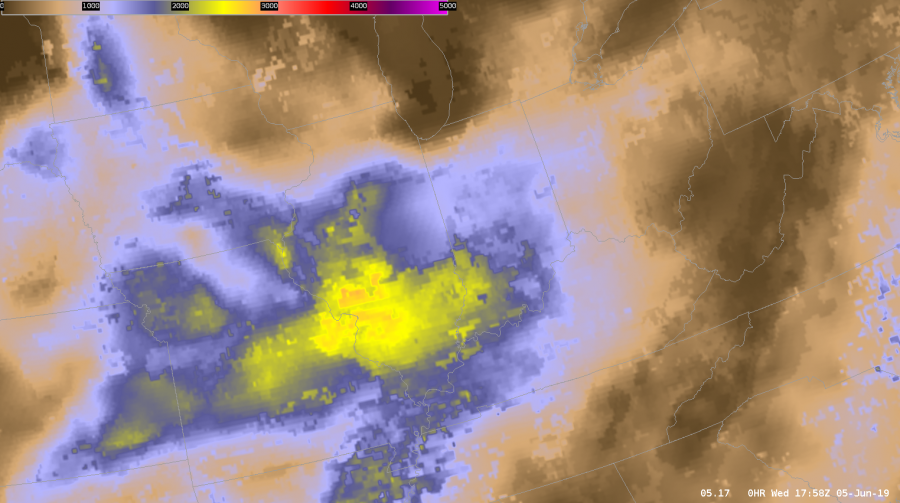
That increase might be due to the fact that the sampled area of interest was filled in by the GFS. Whatever input the GFS was taking into might have lead to it overestimating the amount of CAPE.
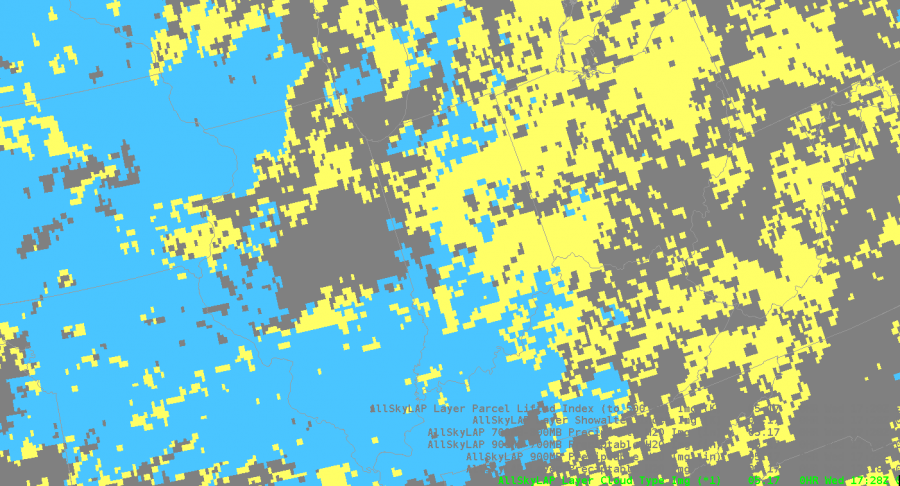
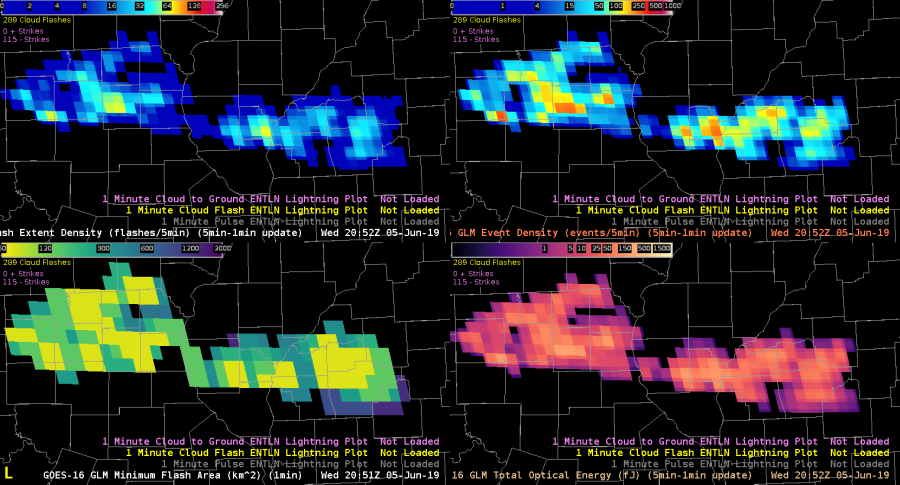
I’m also looking at GLM products to see trends with convection. The combination of event density and GLM minimum flash area help me to see the rapidly growing updrafts as well as cell that are producing hail. That’s the case right now. My warned cell is producing penny size hail.
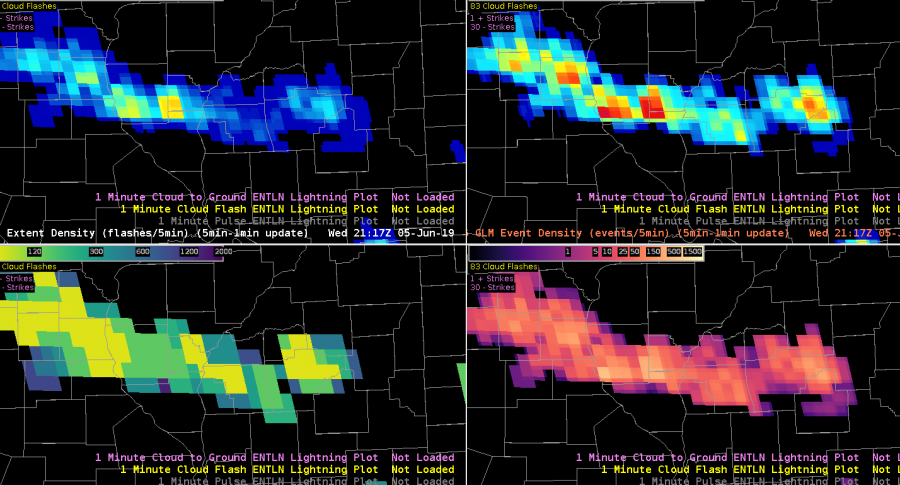
About an hour later the FED Is starting to pick up on longer flashes, but the event density is still showing higher values. The lines up with satellite which shows overshooting tops, but storms are overall keeping their intensity. The overall trend combined with looking at stability indices aids me in nowcasting that storms will at least maintain their strength over the next hour or so.
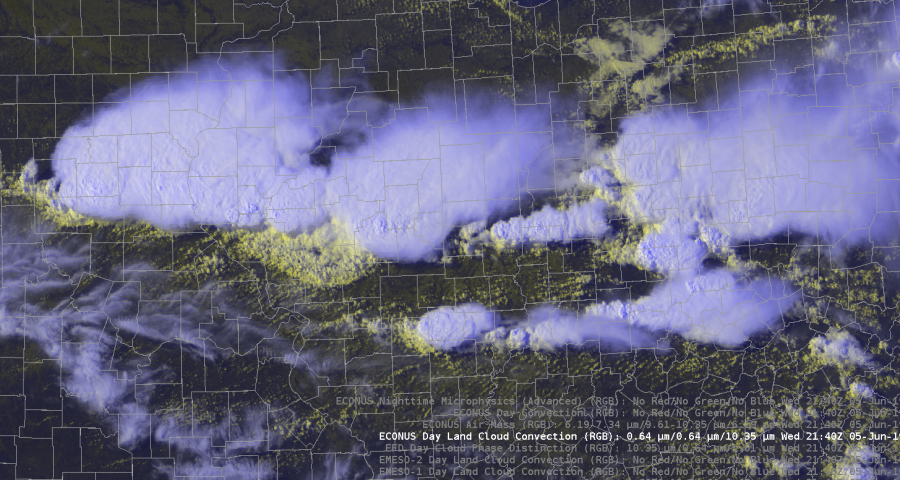
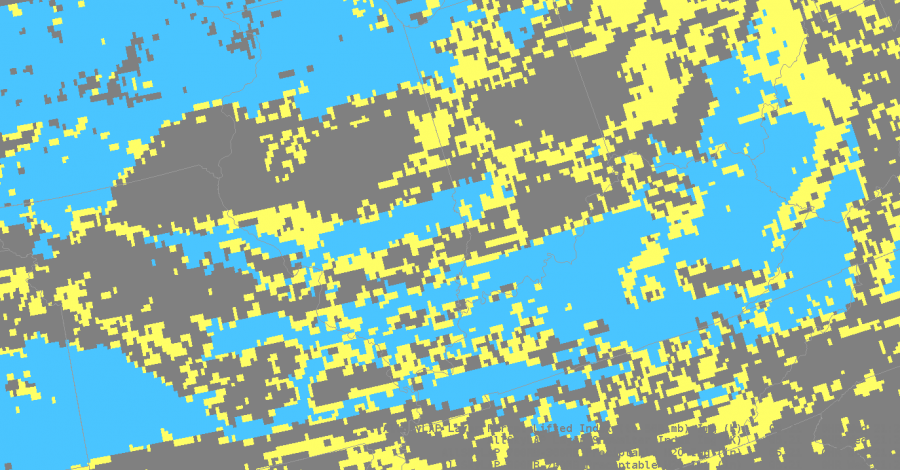
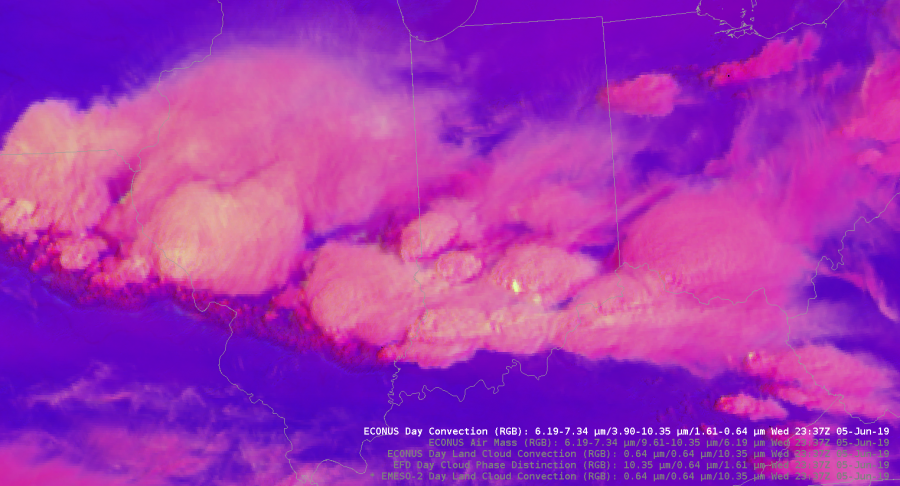
The Day Land Cloud convection RGB was helpful in analyzing different cloud tops. The color scale highlighted the thin cirrus compared to the lower thick clouds. It also dipicted the outflow boundary from our southern storms very well. It gives much more detail to the cloud types compared to the visible satellite.
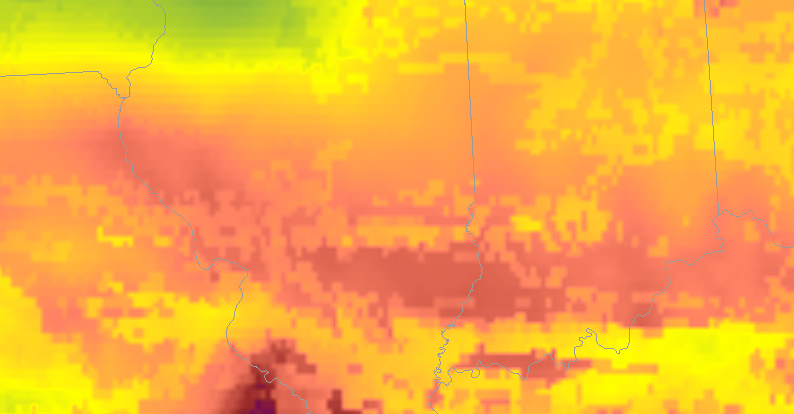
Today I also got the chance to analyze and compare the merged TPW precipital water with the allsky.

During the afternoon the PW values stayed fairly steady across the northern half of the state while moisture increased in southern Illinois.
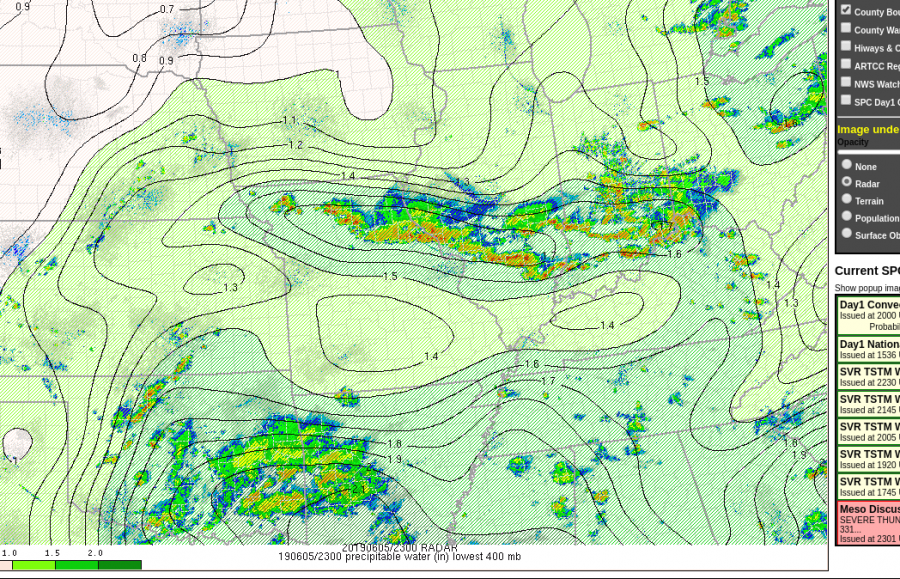
The TPW decreased PWATS to close to 1 inch as storms moved through. T
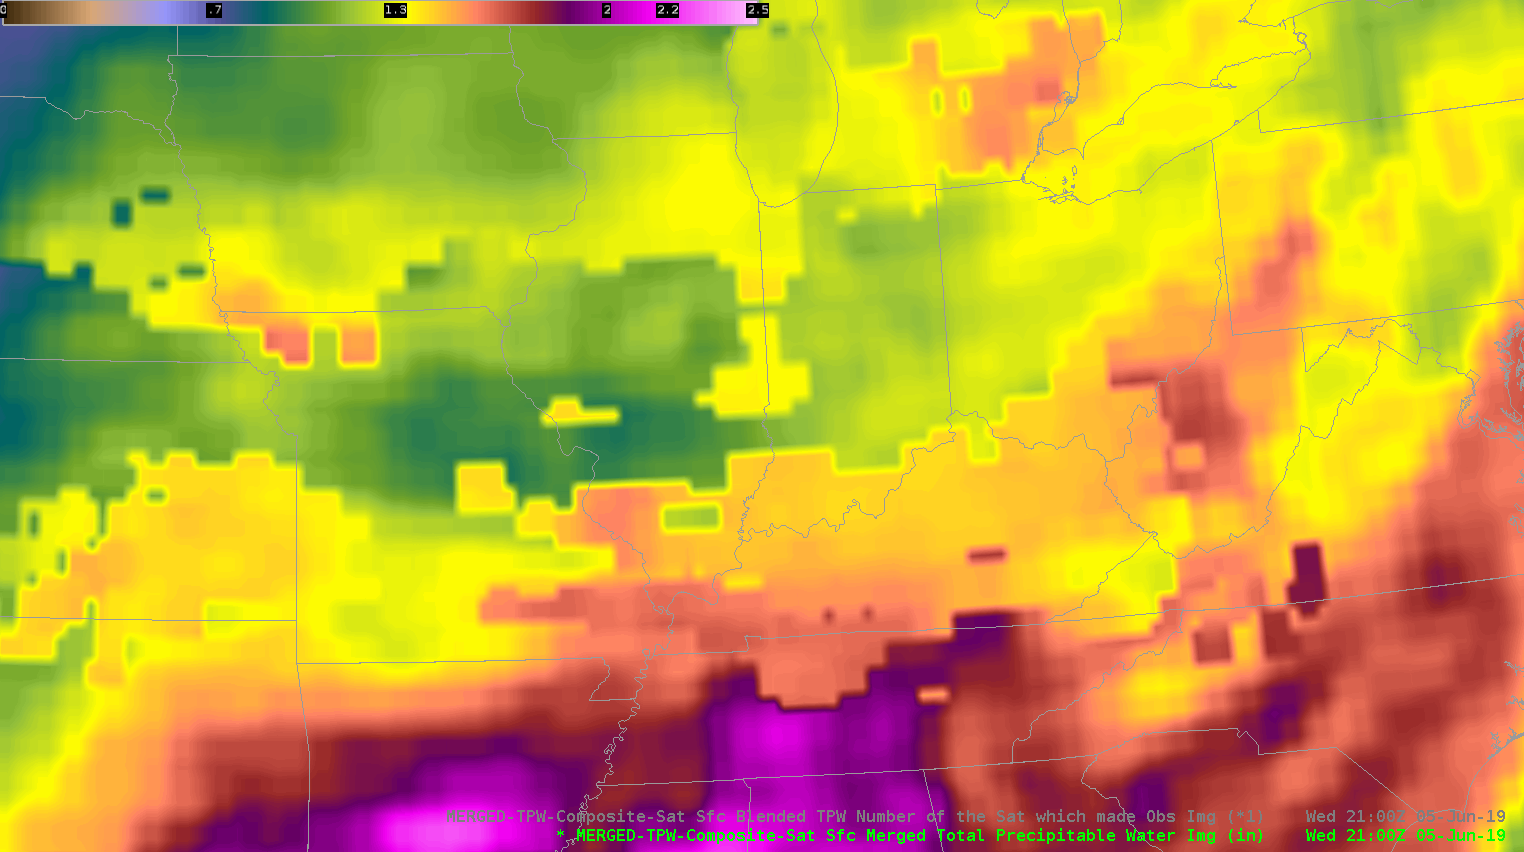
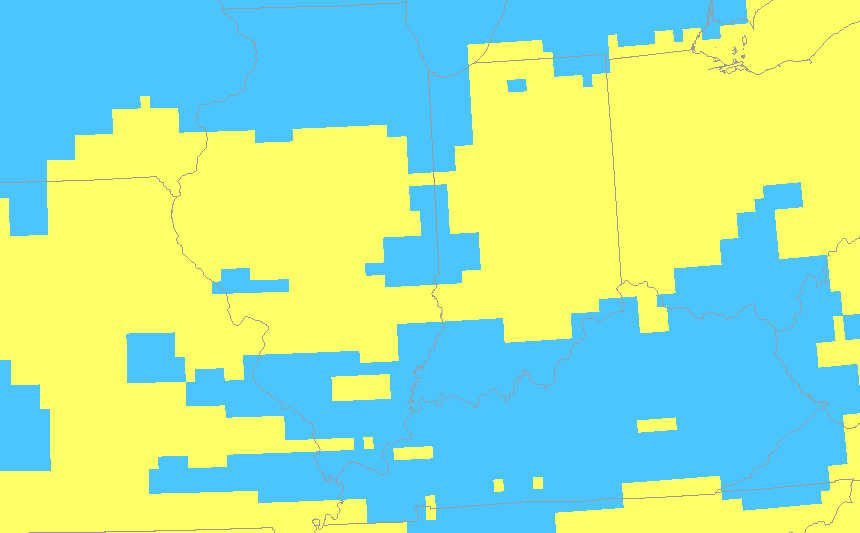
That data was sampled in a cloudy environment.
Meanwhile, the AllSky does show a decrease in PWATS but’s farther north compared to what actually happened. That data was pulled from the GFS since it was in a cloudy location. It was helpful to see how each product performed in this environment. It’s nice to have access to both in order to see which one has the best handle of the current atmosphere. That initialization helps me monitor trends and nowcast.
As storms moved south out of my DMA I used Day convection RGB just to monitor growing cells. It was clear to see the strongest storms because they had the bright yellow maxes.
Earlier in the day was able to compare NMDA with the low level azshear. Tornadoes were’t a major threat, but the NMDA did line up with peak areas of Azshear. That storm did produce wind damage, and strong wind gusts.
Taylor Johnson.

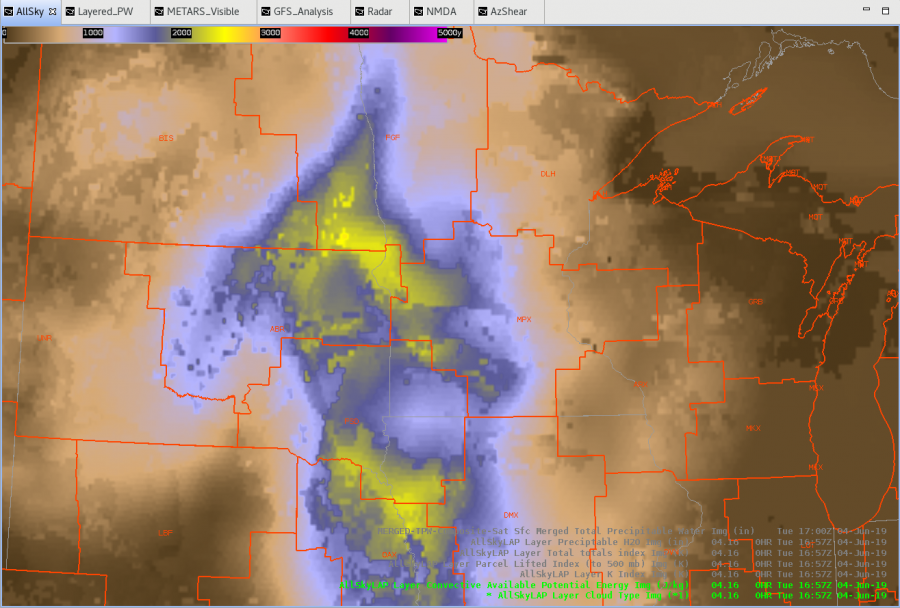
Severe Threat over Minnesota This Afternoon

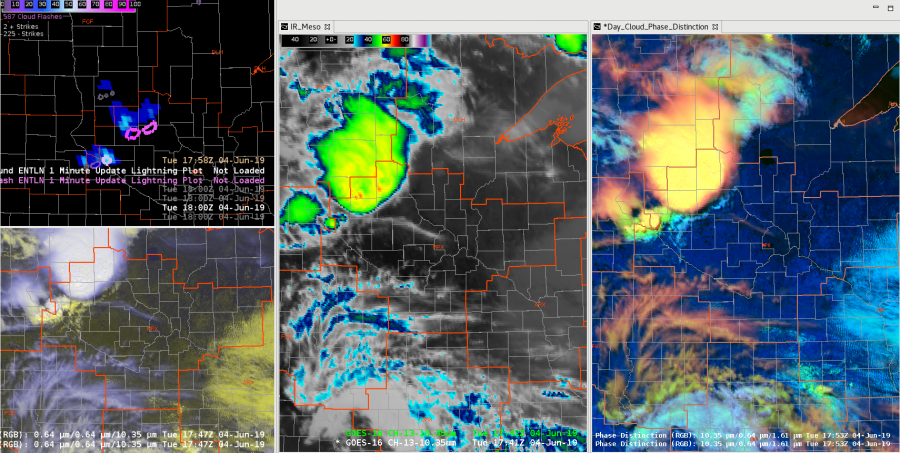
Ongoing complex of thunderstorms pushing into south central MN this hour.  Have a new set of thunderstorms forming in what AllSky is showing as a higher CAPE environment along the outflow pushing out from this complex.  ProbSevere has picked up on this cell as well (near Milan)…showing a Hail chance of 55% now and growing quickly.  Will monitor the downstream growth of both systems.

Comparison of All Sky CAPE to SPC Mesoanalysis CAPE products across Oklahoma

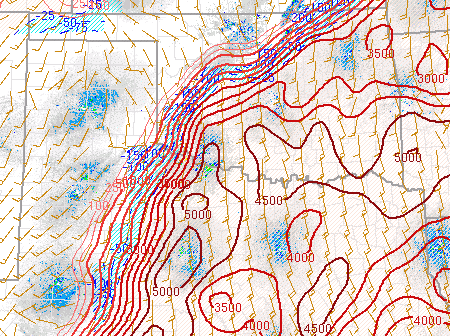
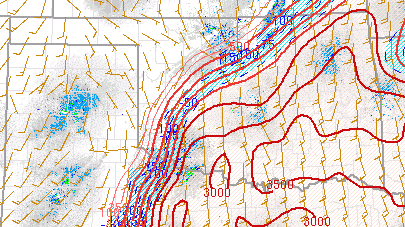
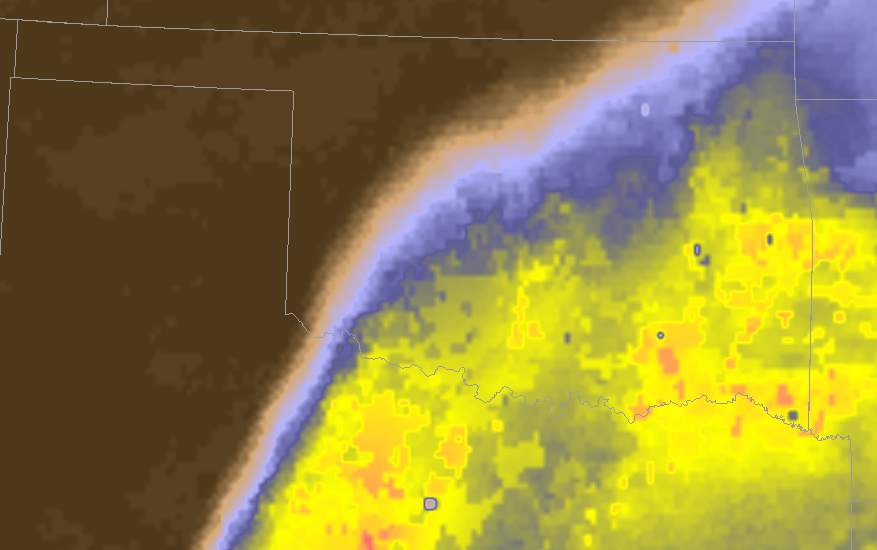
With convective initiation just starting, I wanted to to a comparison of the All Sky CAPE with the SPC mesoanlysis of SBCAPE and MLCAPE. Let’s start with the SBCAPE (all images at 19Z on 5/22).

A very sharp gradient in SBCAPE can be seen in the mesoanalysis above, with values ranging from essentially nil in the northwestern part of the state to values over 4000 J/Kg in the southern third of the state.

The MLCAPE, as one would expect during maximum surface heating, is somewhat less, with values greater than 2500 J/kg running roughly from Tulsa to Norman, and values in excess of 3500 J/kg along the Red River.

Finally, let’s look at the All Sky CAPE. These values are running about 500 J/Kg lower than the SPC MLCAPE in the Tulsa to Norman corridor, and as much as 1000 J/Kg lower near the Red River. However, it does nicely indicate the “shape” of the area that has MLCAPE, and emphasizes the area with the maximum values. This indicates the product is very helpful in a qualitative sense,  but specific values need to be used with caution.

Thorcaster

Life and Death in One Loop

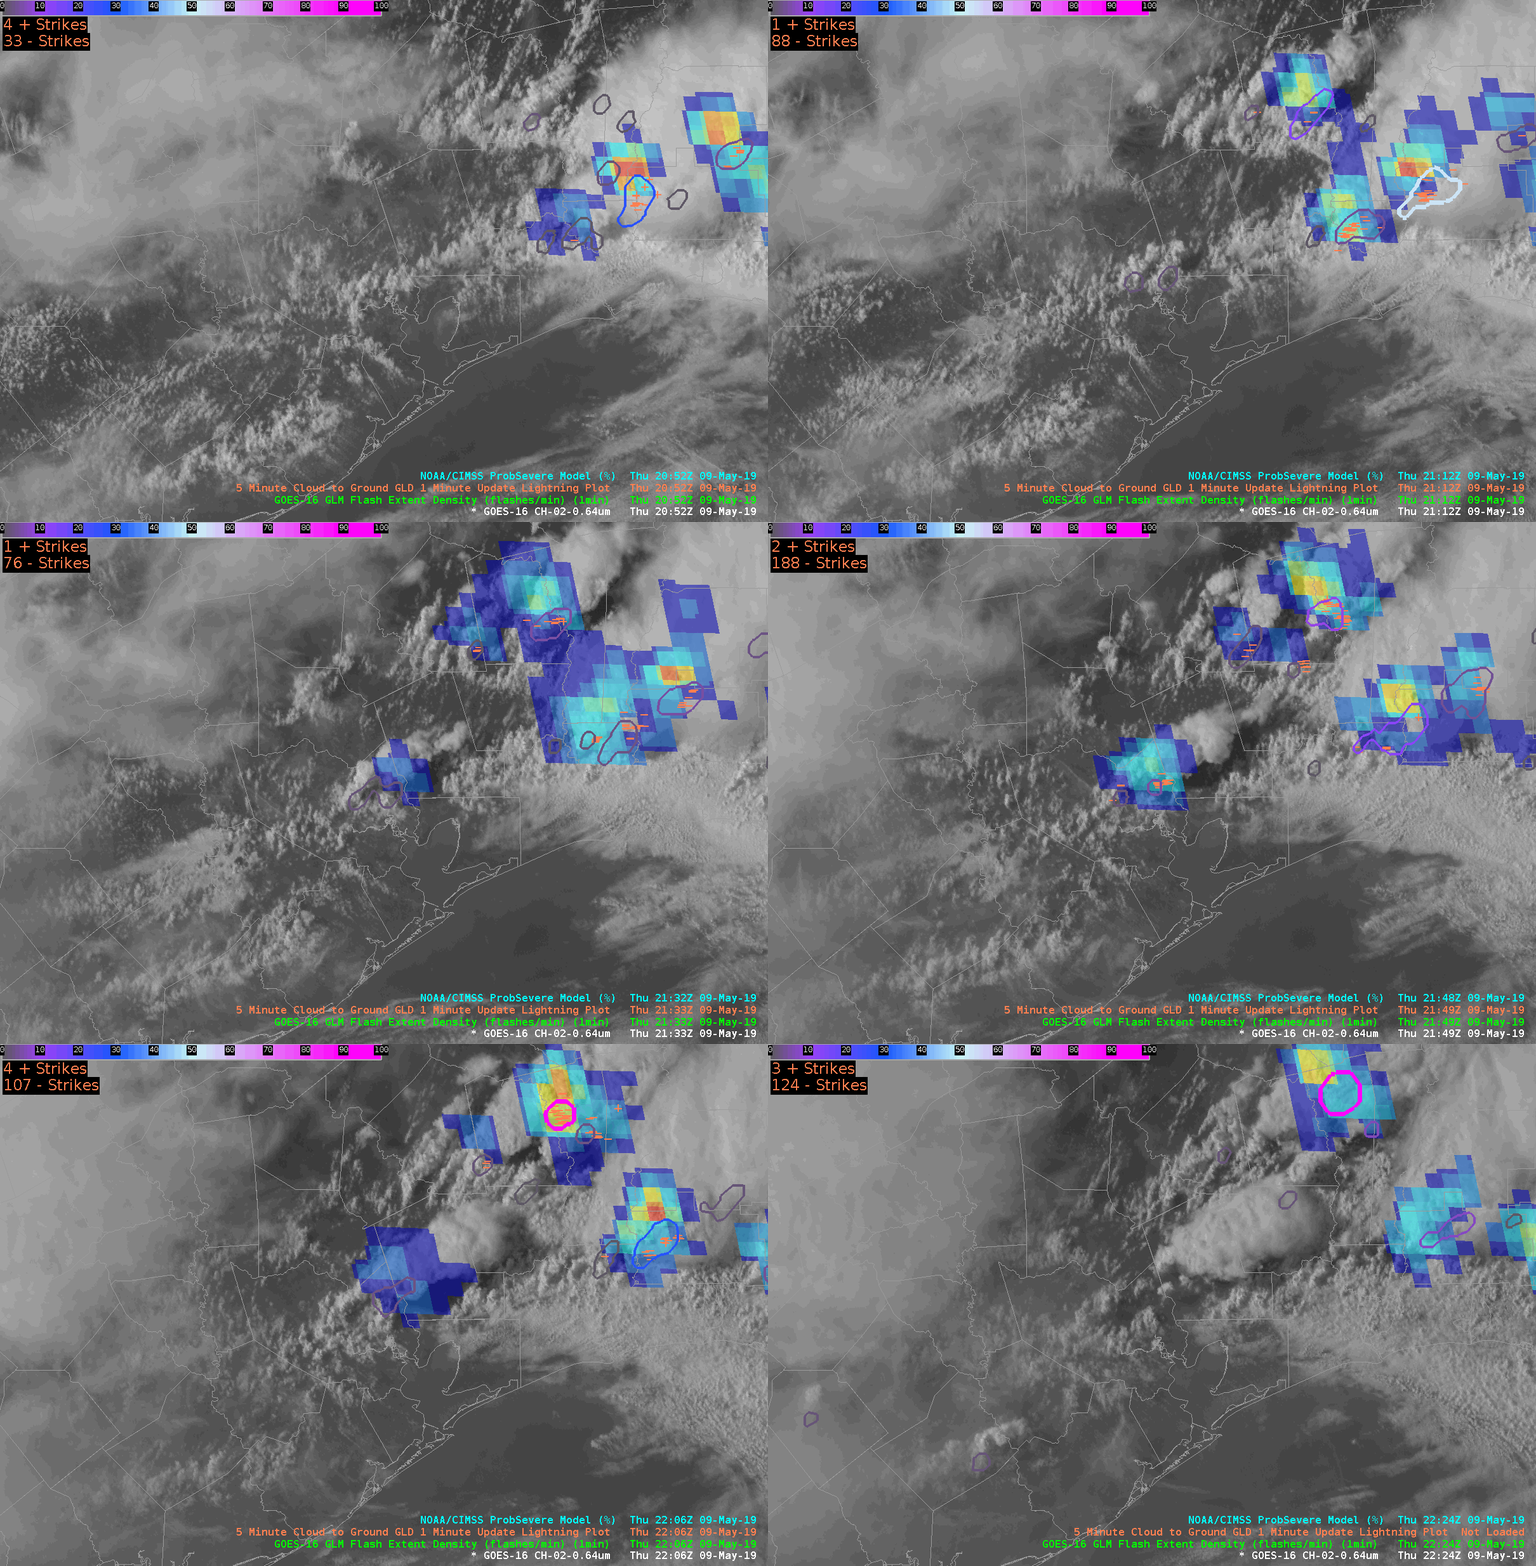
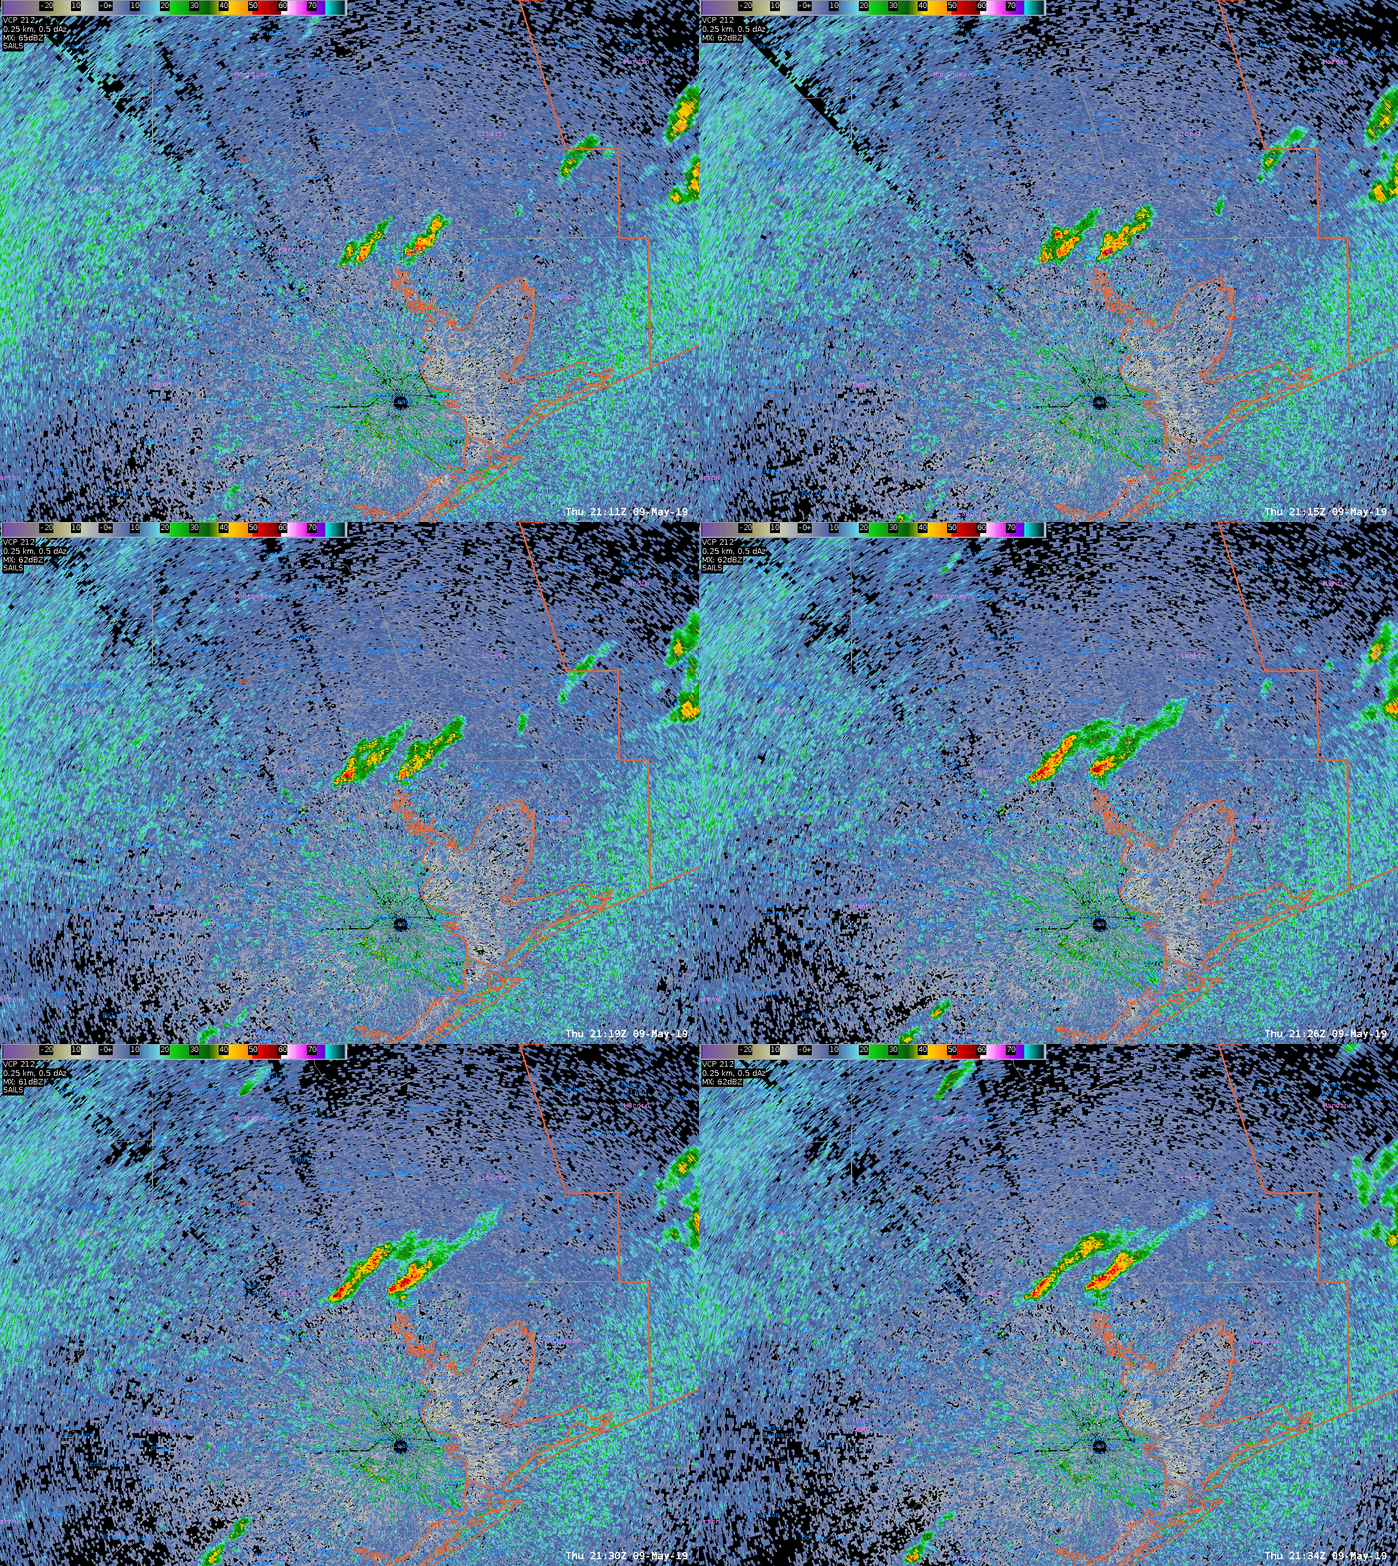
Well, the convection is trying. And dying.  Case in point, the full life cycle of a pair of storms across the  northern suburubs of Houston.  Thoughts below:

You are looking at the 1-minute Mesoscale Sector scan with GLM Flash Extent Density, the Vaisala GLD dataset, and ProbSevere overlays.  Some things to look at:

ProbSevere struggled when the storms were most intense by merging two individual storm objects, splitting them apart, then re-merging back into one object.  Trends were a mess because of this.

GLM lightning activity ceased a full 10 minutes before ProbSevere dissipated the tracking associated with the cells.  However, it continued to show flashes taking place for 7-minutes after the last CG was detected in the GLD data.  Good use for IDSS to let people know that cloud-to-ground strikes are still possible.

The storms initially were moving northwest along a boundary then deviated to the northeast as they strengthened.  As soon as the moved off the boundary…bye bye!

-Dusty

Shields Disengaged

The cap finally broke over Houston’s CWA and we now have some storms to look at. Hopefully, these storms will hold together and become better organized so we can look at other products today. Given that CAPE is generally around 3000-4000 J/kg it shouldn’t be a problem, but we are on borrowed time.

Tags: None

Wherefore art thou Convection?

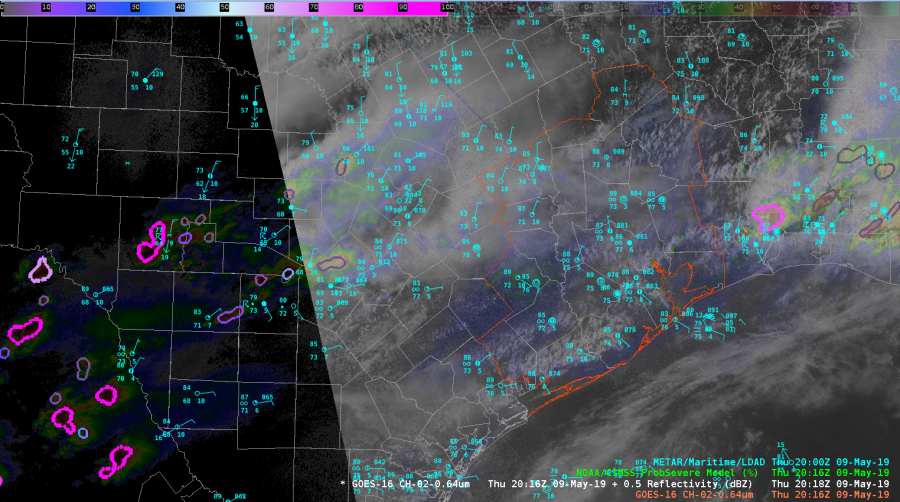
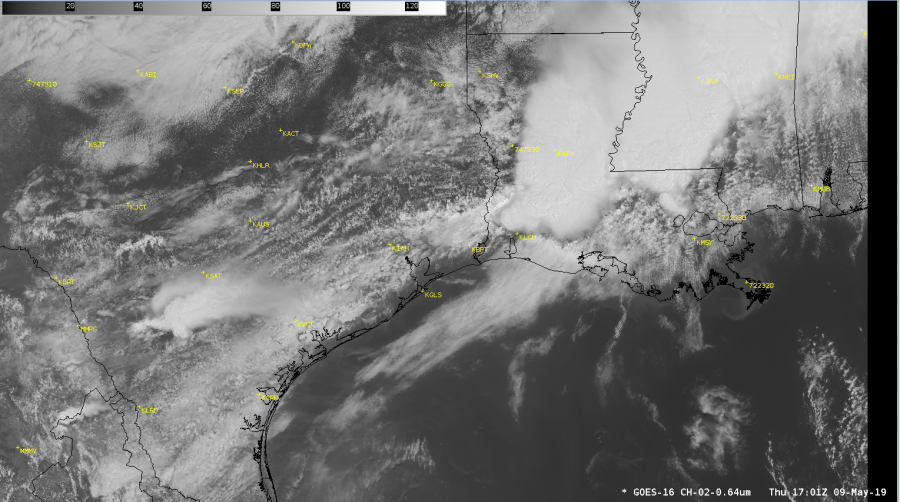
Two hours in and we are STILLLLLL waiting for convection to fire in the KHGX CWA.  Front is stalled across the northern quarter of the CWA and the sea breeze has pushed inland from the southeast.  Come on storms…really?

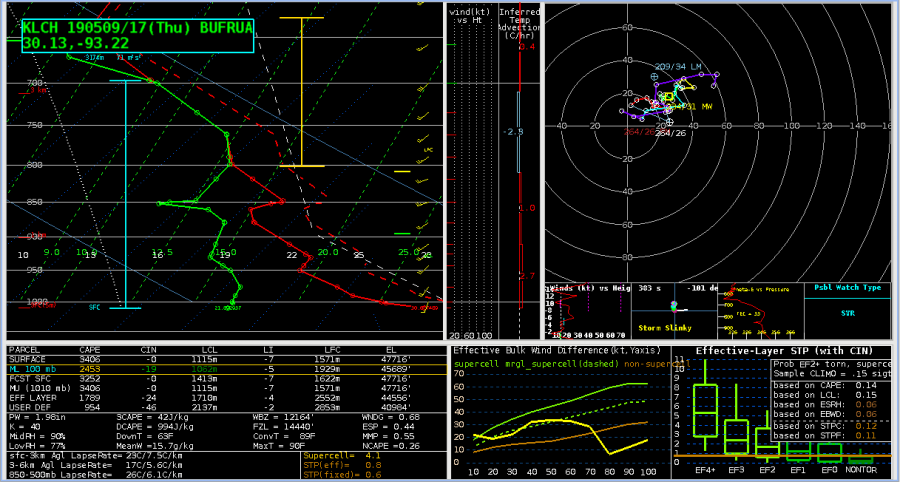
O.K., why no convection?  KLCH launched a sounding at 17Z which looked like this from GOES-E (why this is important in a bit):

Congrats to Lake Charles getting a special sounding off before those storms arrived!  This is what the lowest half of the sounding looked like with boundary layer conditions guessed from the near the center of Houston’s CWA at KTME (Houston Executive Airport):

No Cap, ~2500 J/KG MLCAPE, surface moisture isn’t mixing out too much….so, where are the storms?

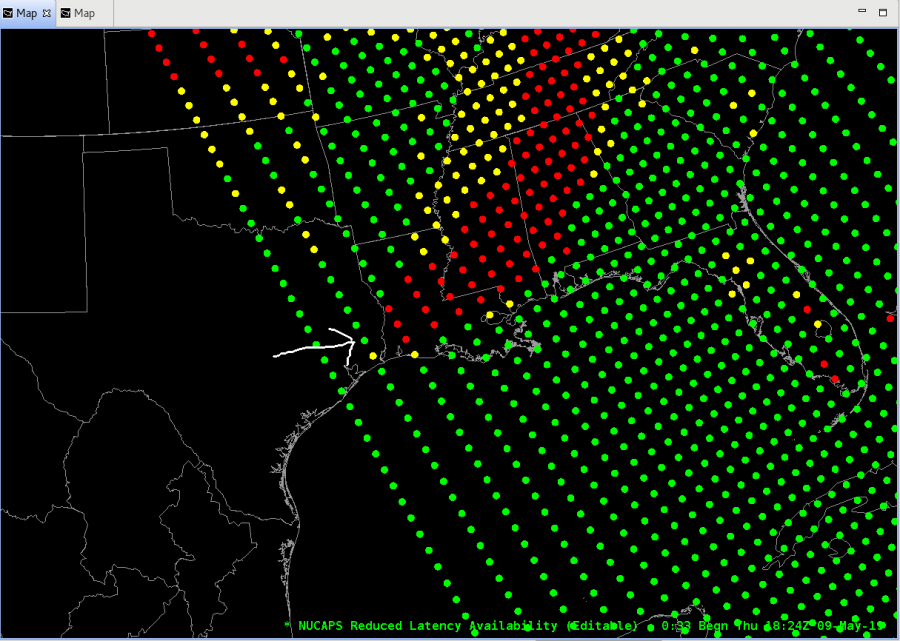
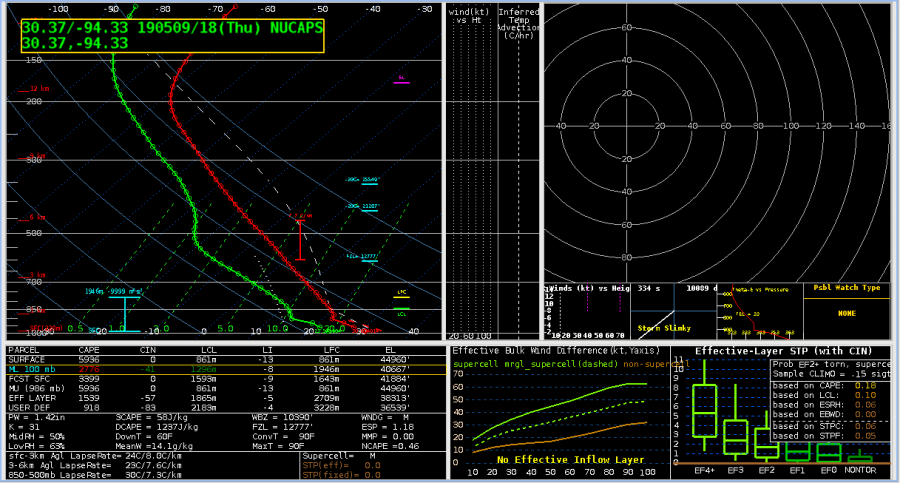
Let’s take a look at a NUCAPS sounding taken from this point almost an hour after the KLCH sounding:

I know you are going to ask…why not the next closest dot further west?  Well, it is on the edge of the instrument swath and that has a whole host of problems.  Second thing is that the soundings along the edge looked…wonky…compared to the next row further east.  The sounding at that point, again modifying the surface conditions for KTME (88/75 T/Td):

Things that make you go; hmmmm.  Using the MLCAPE profile, the NUCAPS sounding shows that there probably is a residual EML behind the departing storms that the KLCH didn’t capture ahead of the storms.  That may be just enough to keep the atmosphere capped and storms at bay.  There isn’t much of a cap, so hope continues we will get convection over the KHGX CWA.

NUCAPS sounding profiles – thumbs up for helping figure out what is going on.  And get more polar orbiters up and going so we can have more than two soundings per day…preferably on different orbital inclinations for better spatial coverage. Please?

-Dusty

TPW Differences Along Dryline

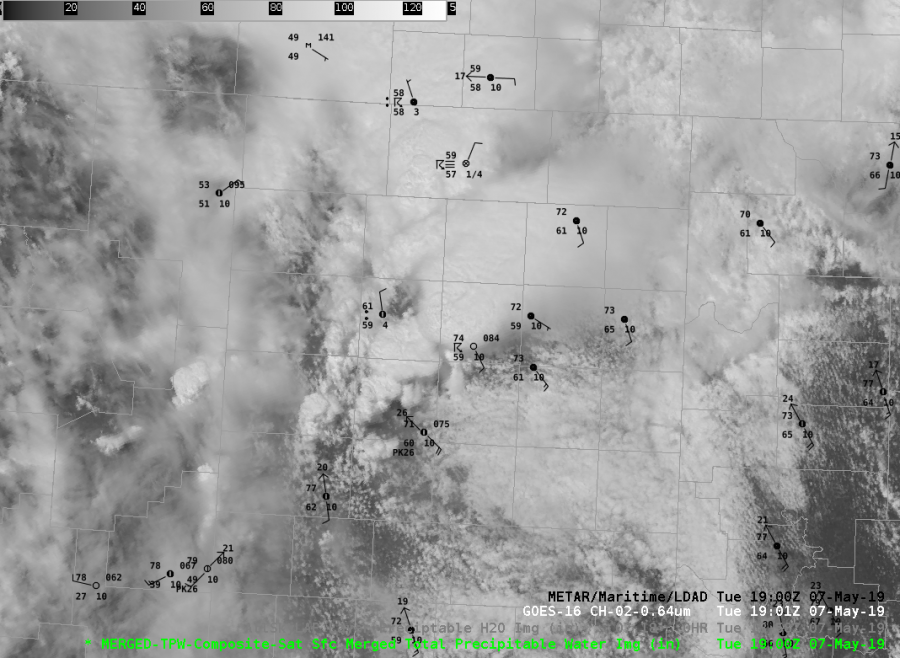
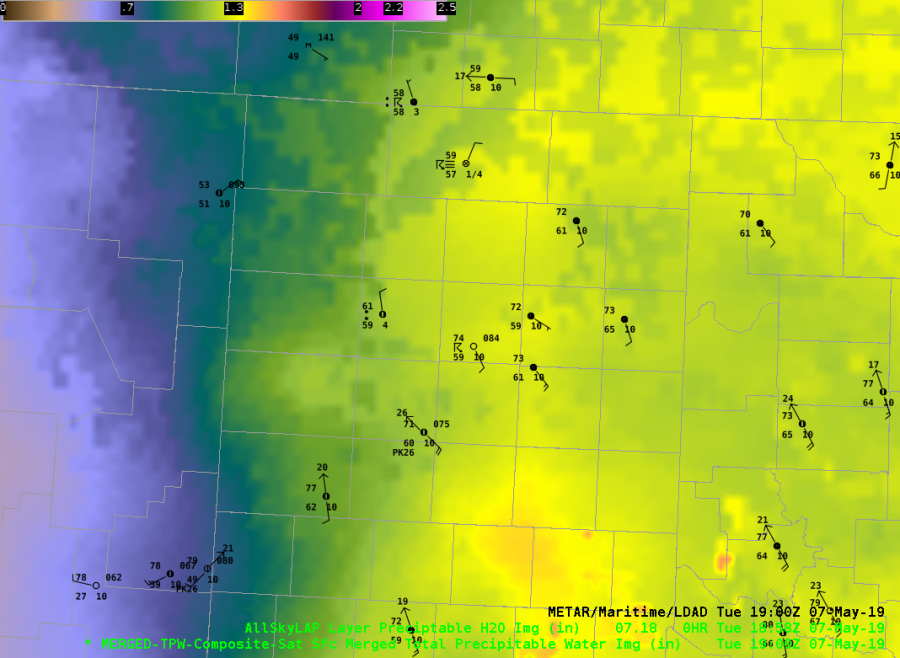
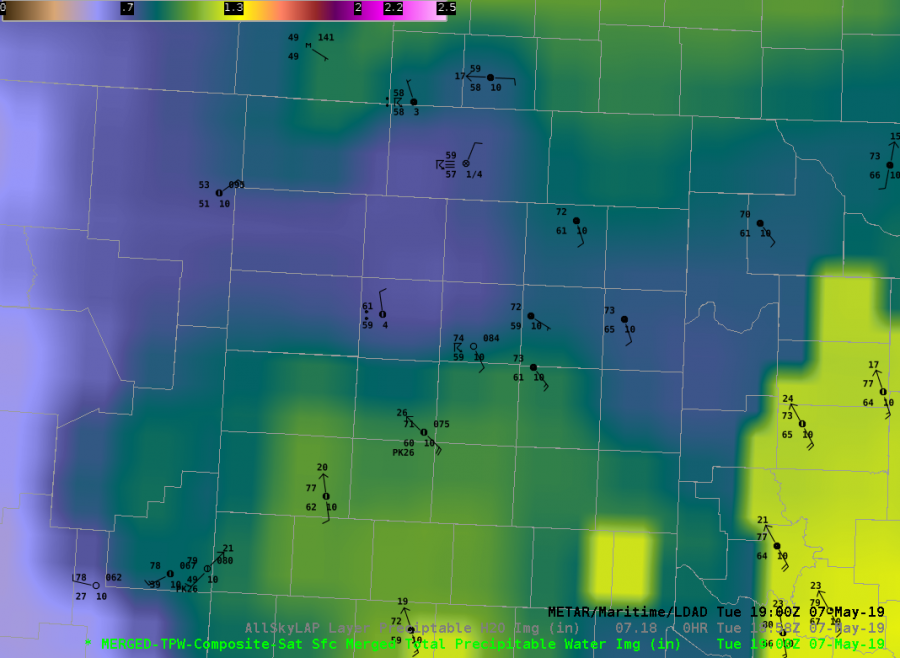
The CIRA Merged TPW and All Sky LAP in the TX panhandle show some differences in the vicinity of the dryline at 19 UTC on 7 May.  This is a cloudy region so the retrievals are either GFS (All Sky LAP) or advected polar microwave (Merged TPW),  The All Sky LAP TPW shows a moist panhandle, with values in green / yellow (1″ or above).  The Merged TPW indicates lower values in green / purple, or about 0.7″.  Surface dewpoints range from 59-65 F, indicating moist air ahead of the dryline.

Surface GPS observations from Suominet at three TX stations in the panhandle (Amarillo – 1.0″, Borger – 1.0″, and Canadian – 1.1″) lean closer to the All Sky LAP analysis.  An hypothesis for the Merged TPW being low is dry retrievals from higher terrain to the west being advected into the moist sector.


JohnF

Mesoscale discussion using All Sky and SPC mesoanalysis page

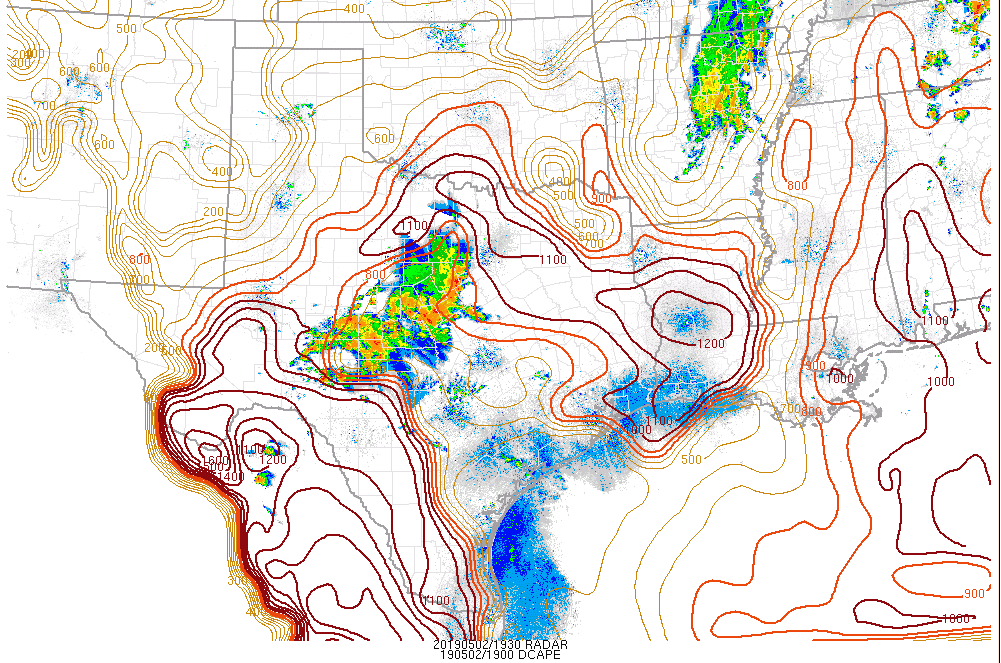
Favorable 0-6km shear aloft from SPC Mesoanalysis page above across FWS CWA

All Sky Total PW above shows deeper moisture in southern FWS CWA.

High DCAPE values across the FWS area per SPC mesoanalysis page above


Mesoscale Discussion…40-50kts of wind shear aloft and high DCAPE values show conditions favorable for severe winds to occur, mainly for locations where  All Sky total PW shows strong moisture gradient along surface front in southern part of the CWA.

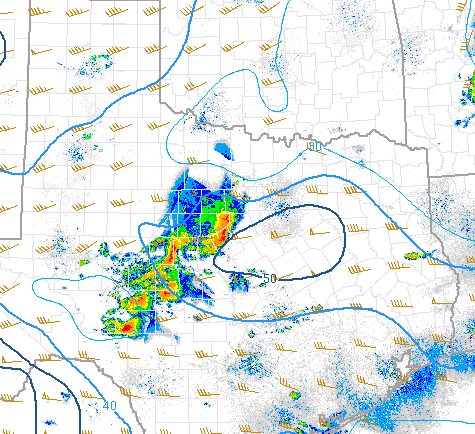
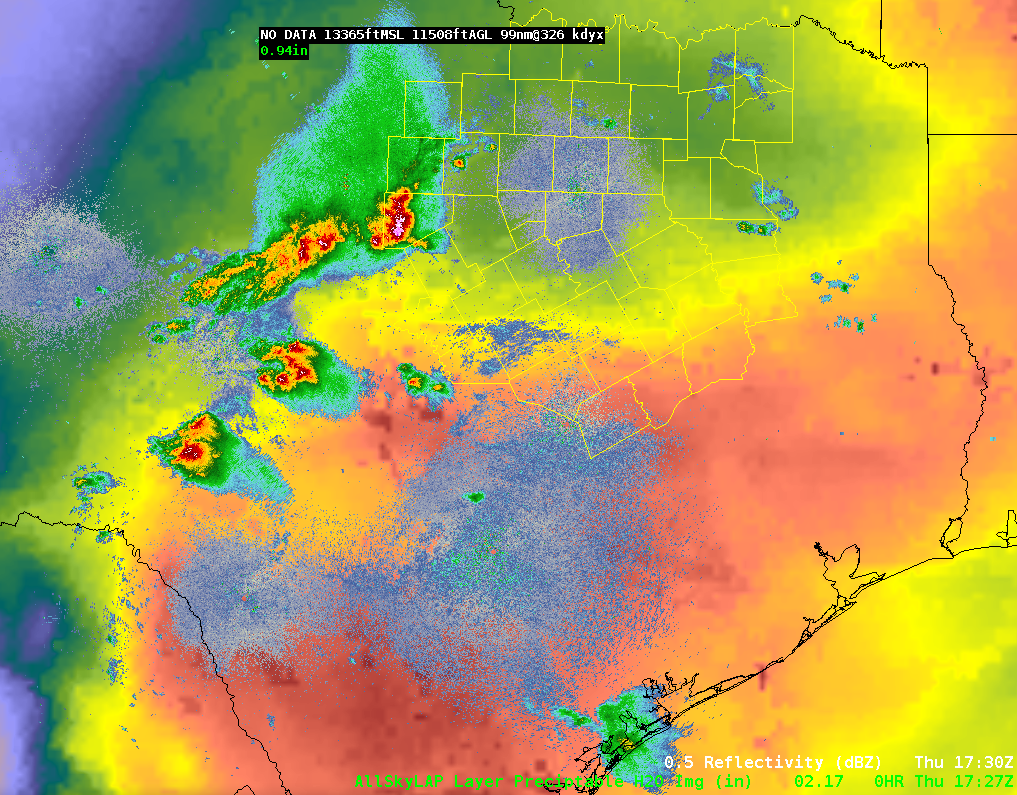
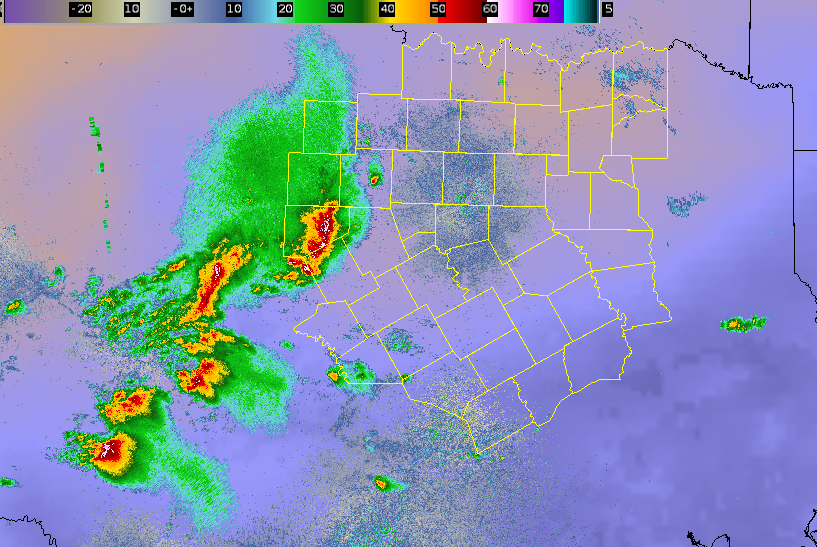
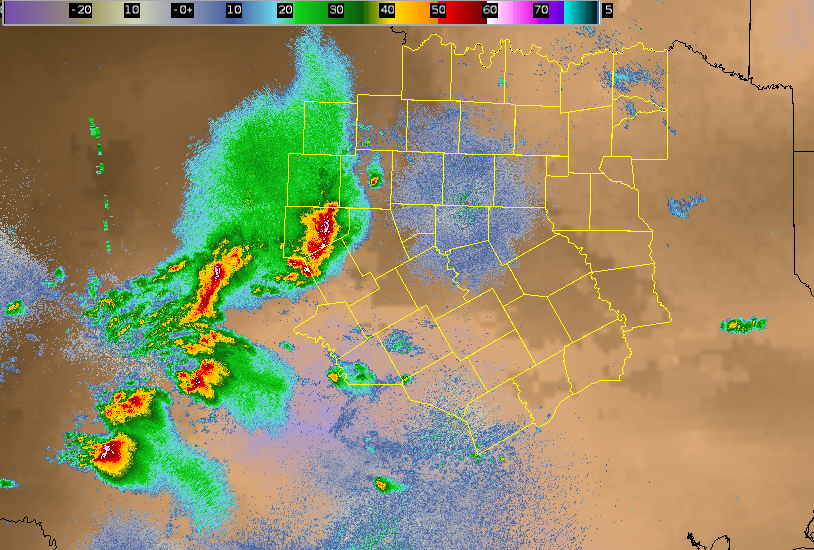
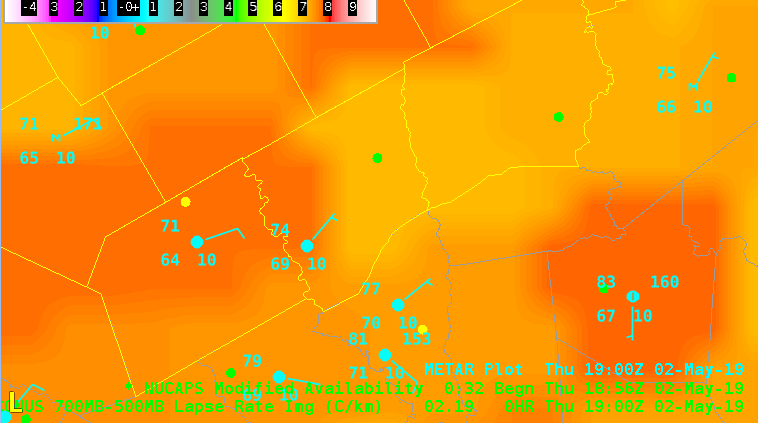
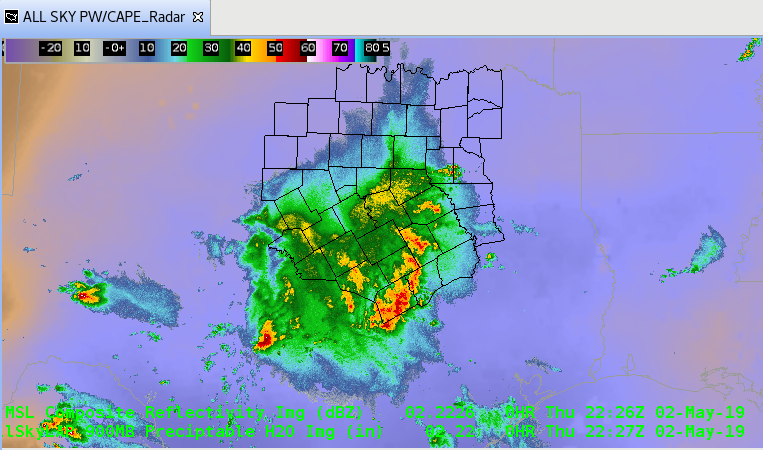
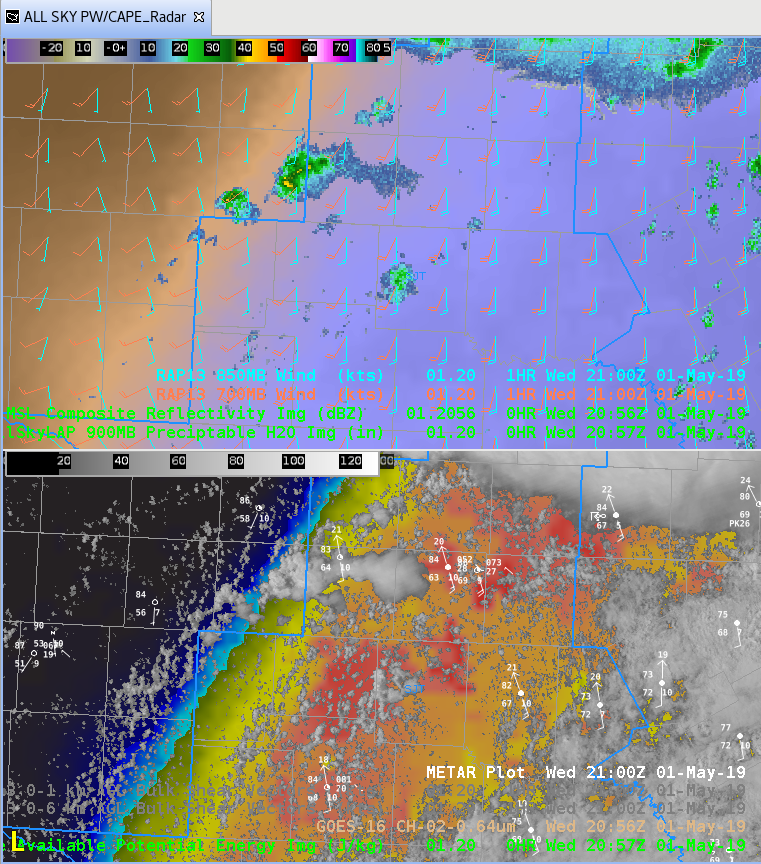
This is a loop of radar and All Sky LAP CAPE.  Notice the higher CAPE values in the southern part of the CWA. This is were linear convection could grow upscale become surface based and capable of produce damaging winds.  -Jake Johnson


The ProbSevere Wind spiked to 80% with a thunderstorm that later moved across southern FWS CWA, which was our area of concern.

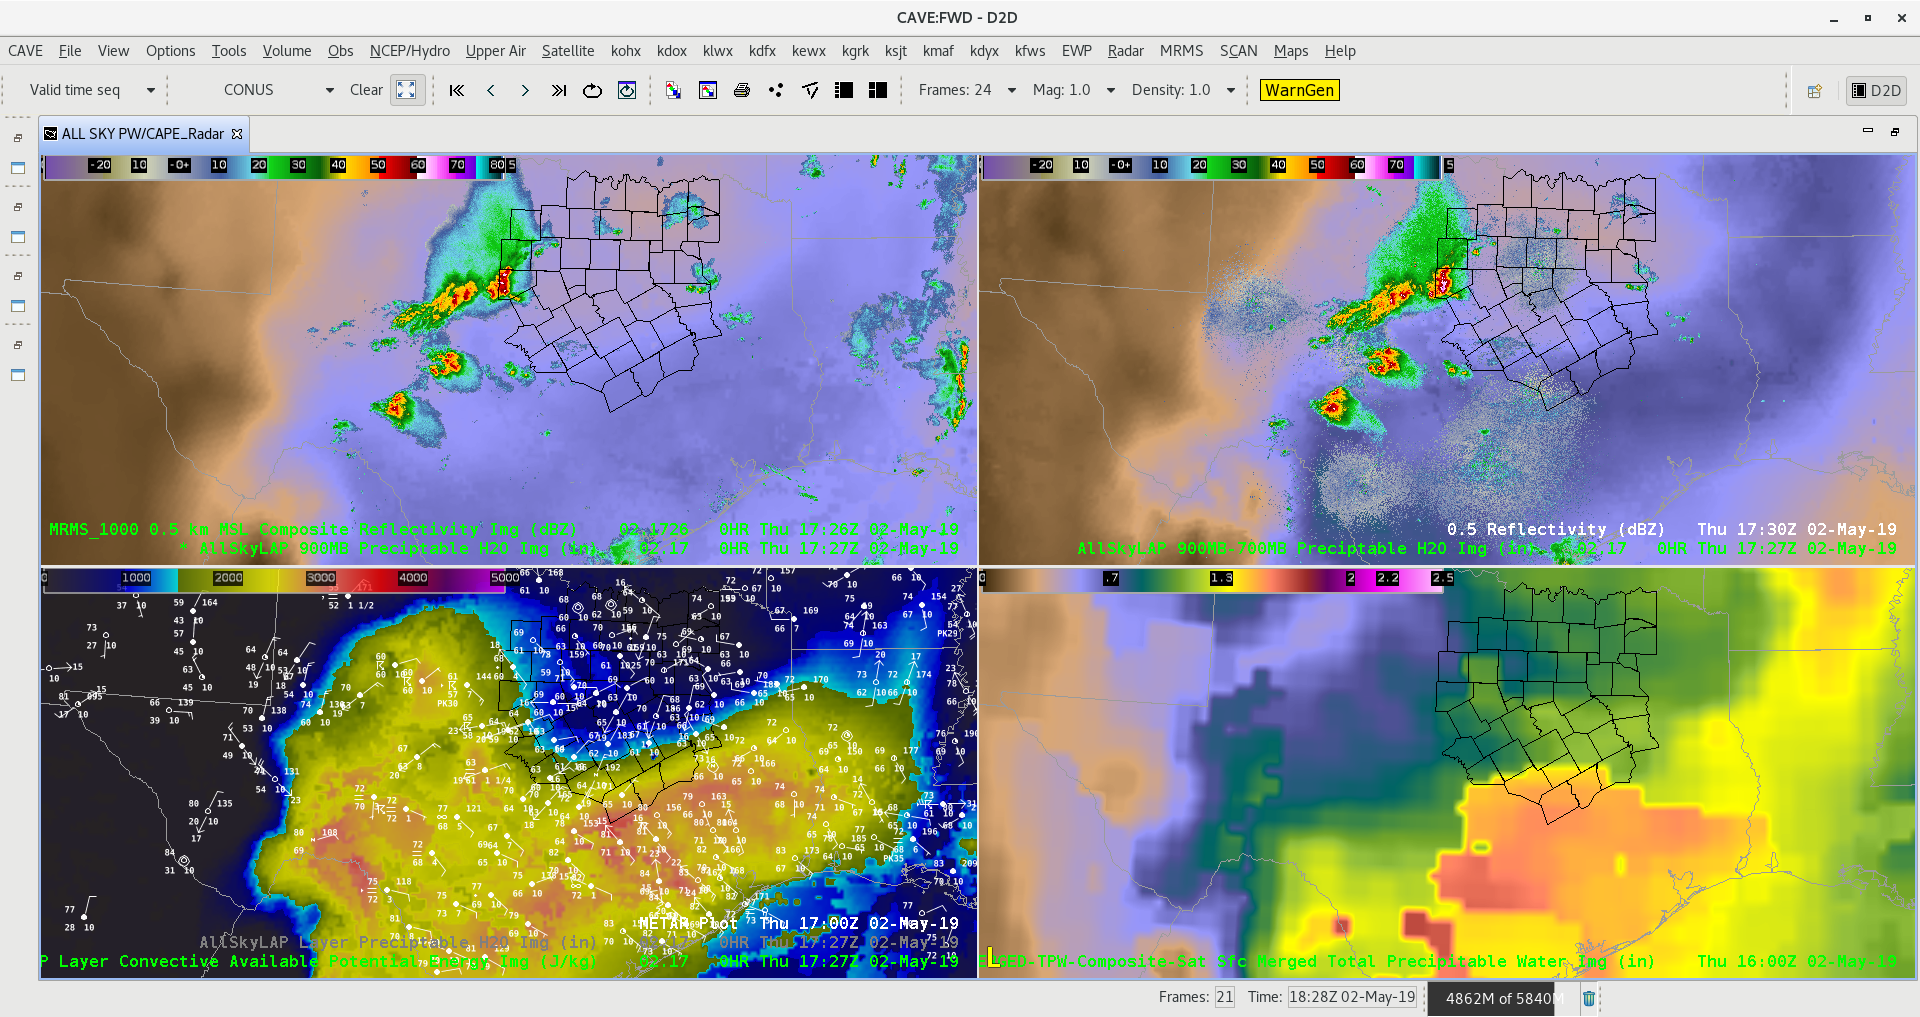
May 2, 2019 All Sky Total PW vs Merged Total TPW

Figure A

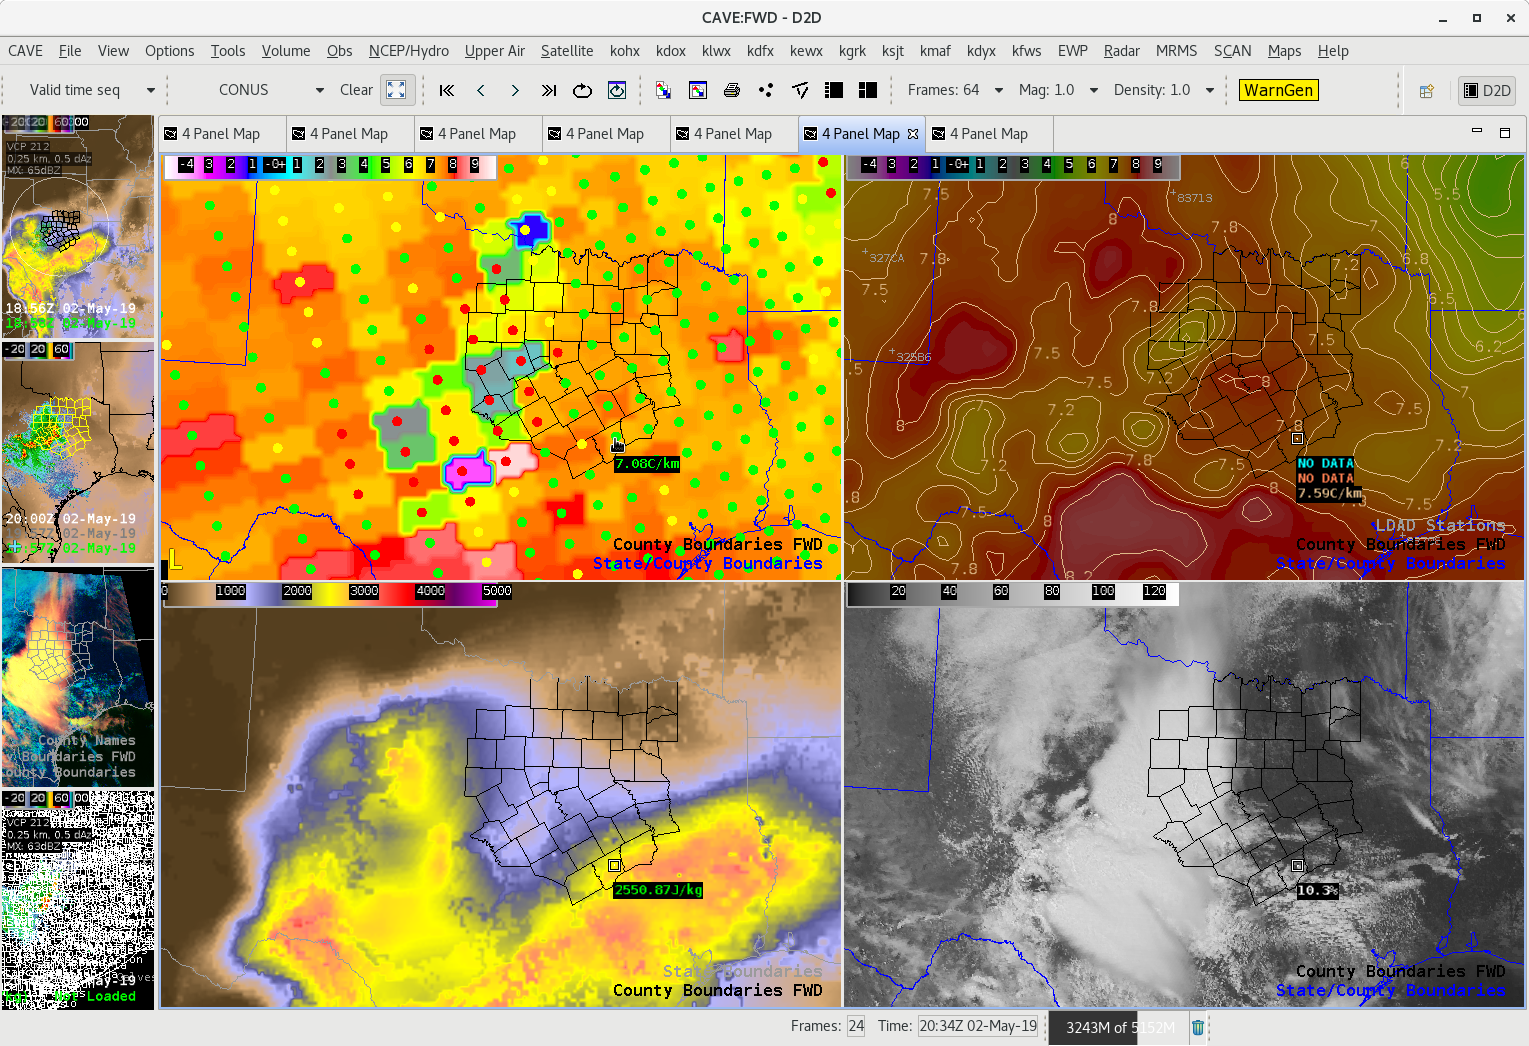
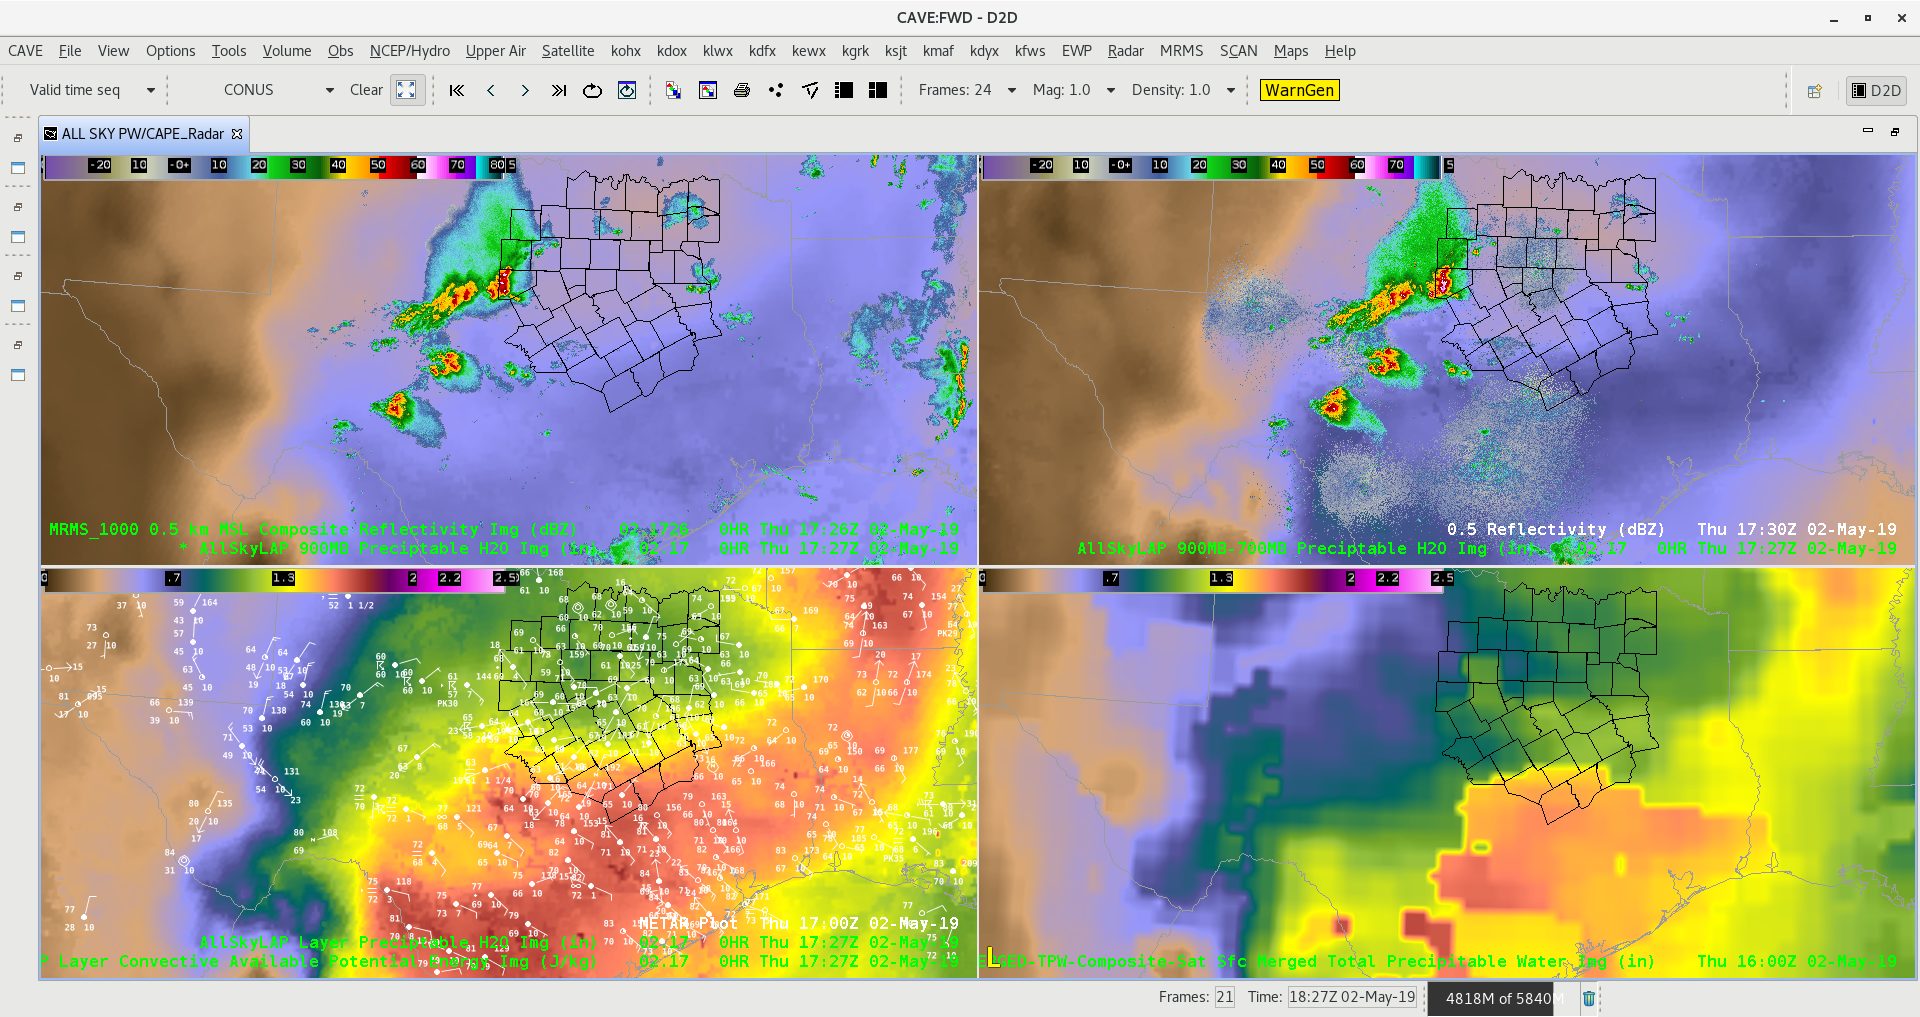
All sky continues to handle total PW better than CIRA Merged Total PW looking at the bottom two frames. Notice the westward expansion of better moisture in the All Sky which matches up with surface obs compared to much lower values further west on Merged Total PW.

Figure B

Looking at the lower left panel for CAPE in the All Sky product we see a well defined instability gradient in southern FWS area which has our interest for higher probability of severe weather. Storms across central and northern parts of Dallas/Fort Worth area will be elevated, however storms that develop in southern part of the CWA could become surface based along the instability gradient.  -Jake Johnson

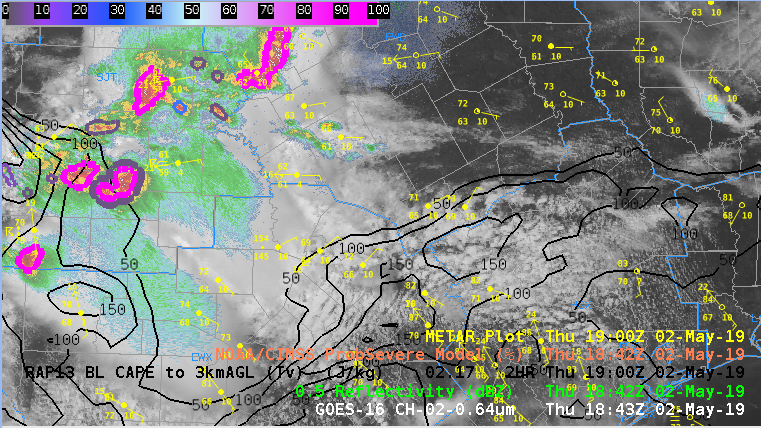
Figure C

RAP13 0-3km CAPE is favorable for surface based storms in far southern FWS CWA.