An official website of the United States government
Here’s how you know
Official websites use .gov A
.gov website belongs to an official government
organization in the United States.
Secure .gov websites use HTTPS A
lock (
) or https:// means you’ve safely connected to
the .gov website. Share sensitive information only on official,
secure websites.
As the MCS moves towards the Northern Alabama LMA, I thought it was a good time to compare colormaps and get feedback from each of the forecasters.
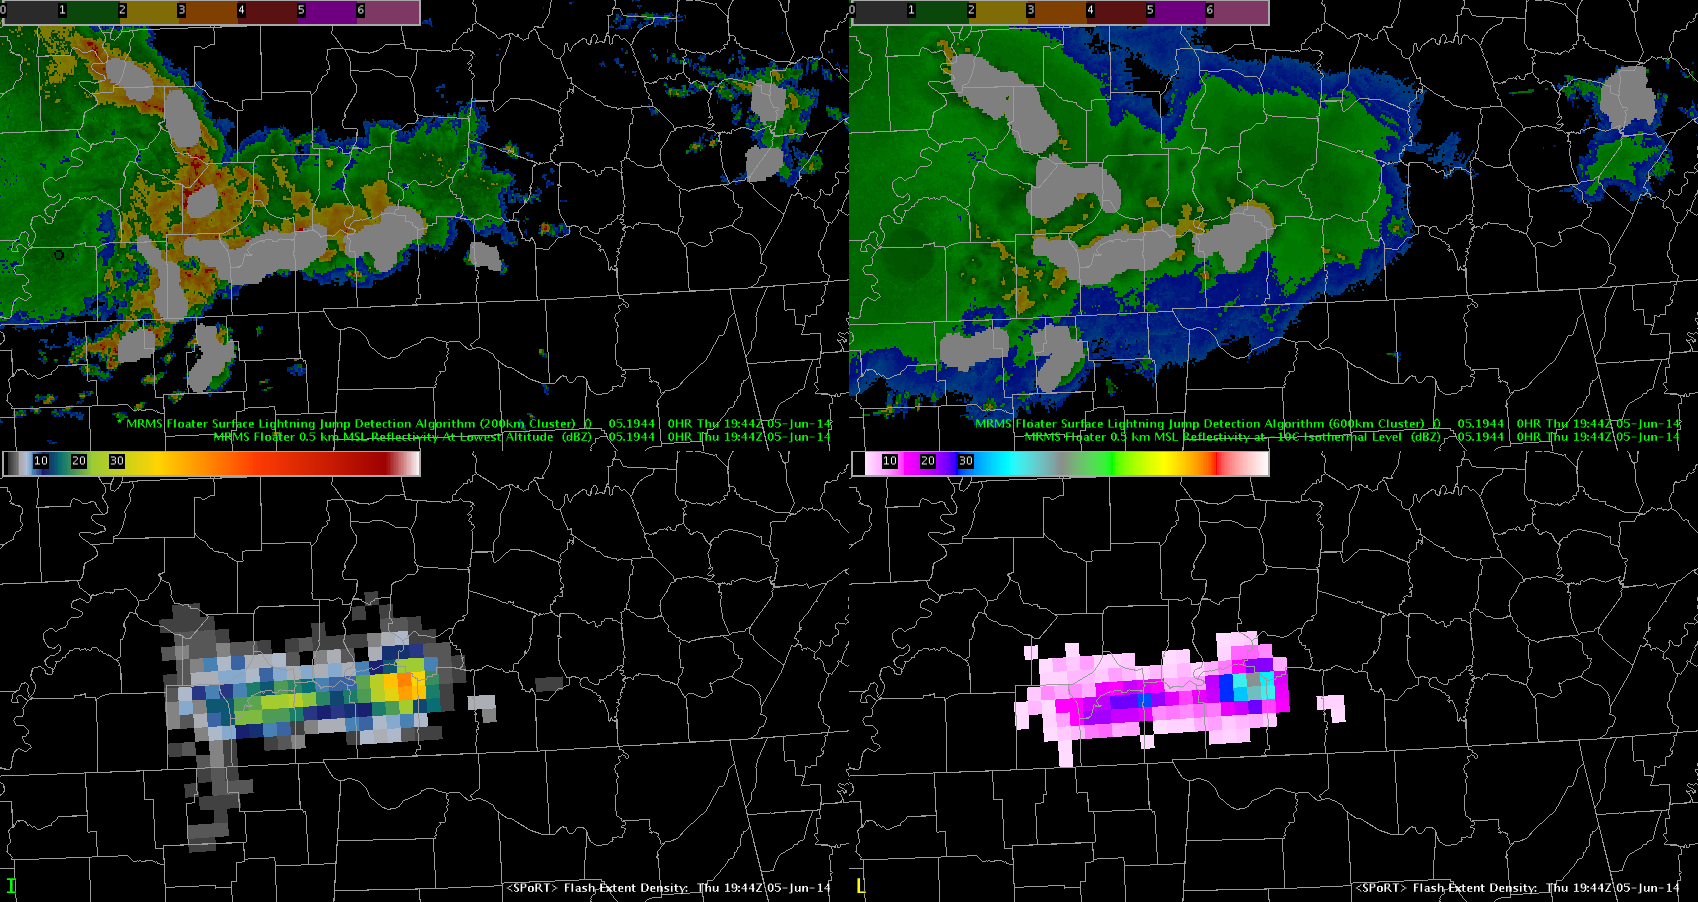
I added the following image to the large screen of the situational awareness display within the HWT and asked each forecaster which colormap they preferred – the one on the bottom left or the one on the bottom right.
top left: 200 km2 LJA over MRMS lowest refl. Top right: 600 km2 LJA over refl at -10 C. Bottom left: PGLM flash extent density (colormap 1). Bottom Right: PGLM flash extent density (colormap 2)
All forecasters this week preferred the colormap on the bottom left except for one specific case: when they want to overlay the data on radar. For that particular occurance, the bottom left is a bit to similar to the radar. However, all agreed that on its own or overlaid on satellite the colormap on the bottom left is much preferred. (note: the colormap on the bottom right is the default colormap for AWIPS2).
The 2013 Experimental Warning Program (EWP) has offered a great opportunity to test the NASA SPoRT / MDL total lightning tracking tool. Part of EWP’s efforts are to demonstrate future GOES-R capabilities, such as the Geostationary Lightning Mapper. This is being done with the pseudo-geostationary lightning mapper products being produced by NASA SPoRT in collaboration with seven ground-based total lightning networks. With total lightning observations (intra-cloud and cloud-to-ground) forecasters are looking for lightning jumps, or very rapid increases in total lightning activity ahead of severe weather. In the past, this has been done by visually inspecting the PGLM data. From previous evaluations by both SPoRT and the EWP, the number one request was for a way to visualize the time series trend of total lightning in real-time. With AWIPS II and the ability to create custom plug-ins, the first effort for this has been developed and is now here in operations at the EWP. One design feature was to make this a manual tool. In other words, it is the forecaster who selects the cell track and not an automated tracker, which traditionally has difficulty with merging and splitting cells or not activating at the proper time. Once the forecaster places two points, the tracker activates and will create a track based on these points. Each point can be moved individually to adjust the track and the tracker will attempt to maintain the track as new data are ingested. We wanted to evaluate the utility of the total lightning tracking tool as well as its impact on operations. In only a couple days, the feedback has been great. First, here is an example of the PGLM with the total lightning tracking tool this evening.
The PGLM flash extent density observing a maximum of 49 flashes with the total lightning tracking tool time series (pop-up to left). The lightning jump can be seen early in the time series as it goes from 20 to 49 flashes in two minutes.
Overall, feedback has been very positive as forecasters have appreciated being able to visualize the time series instead of creating a mental picture. Also, the time series plot is pinned to always be on top, which prevents it from being lost behind the D2D display. Also, the feedback has been very constructive to help improve the look and provide ways to minimize the time impact. Some of the commentary has focused on modest improvements to the layout and look.
Add a minimize button to the time series display pop-up.
Have the time series trend color match the active cell point color for the track.
Have a way to change the default size of the cell point radius of influence (which determine how much lightning data to query).
The feedback also has included very interesting options to save time in implementation.
The tracker initiates after two points are plotted. However, it attempts to extrapolate the cell track after placing one point. This results in the cell points being very spread out. Suggest waiting to extrapolate the track until after two points placed.
Also, when the storms are more discrete, instead of using individual cell points created a small “domain” around the storm cell of interest. The forecaster selects a “polygon” of where the storm will be and the tracker selects the PGLM value within this domain at each time step. This may be able to be done by using the tools similar to how forecasters plot a warning polygon as well as how that can be edited. Furthermore, the storm motion could be added to further aid the plot. The big advantage here is that this polygon may be much quicker to place than several individual cell points.
All of these are very good suggestions and this feedback will be taken back to see what can be implemented. The polygon suggesting is very interesting to consider, while the current cell point method would be most viable in a multi-cellular environment. Additionally, this feedback has been very useful in that it helps refine the total lightning tracking tool ahead of its next evaluation as part of the Operations Proving Ground later this summer.
Tomorrow should be another good day to gather additional feedback.
WoF updraft max indicating increasing updraft strengths along the line of storms moving east across Winston County. Based on this, slight up-trend in pGLM lightning with that storm, and with NEXRAD data showing increasing strength…issued SVR for Cullman county. To the north, trends indicate weakening with stronger convection and winds 30 to 40 mph being reported. Expect this trend to continue.
Thunderstorm line moving across Lauderdale, Colbert and Franklin counties starting to indicate potential of weakening slightly next 1 to 2 hours. Storms are initiating along the leading edge of a strong cold pool…and that process will continue farther east into the current SVR tstm warning polygon. WoF indicating updraft strength weakening slightly past few passes, and the lightning rates have shown a decrease over the past 4 passes. Expect to see 50+knot winds along and behind the bow to continue being brought down at times next hour…but for areas farther east suggested to have a slightly more stable airmass in place in the GOES Vertical Theta-e Diff Low-Mid imagery…which would suggest the threat might diminish as the storms approach the Cullman and Huntsville areas. Stay tuned.
UAH_CI and CIMSS Cld Top Cooling imagery indicating potential for stronger storms over southwestern forecast area…mainly Franklin, Lawrence and Cullman counties next hour or so. Continue Severe Thunderstorm Warnings for Franklin and Colbert counties but threat passing south of Limestone county. May see shallow spinnup on the leading edge of the bowing structure moving into Red Bay area…but nothing to warn on for tornadoes right now.
CIMSS_NRE Vertical Theta-e Difference forecast fields showing deeper layer instability ahead of the squall line moving southeast across Mississippi and will increase across Northwest Alabama over the next three hours. We don’t expect a lot of weakening of the strong to severe storms along the line moving southeast passing north of Tupelo into NW Alabama. CIMSS CI-Layer cloud top cooling rates now around -23C indicative of strong updrafts in storms north of Tupelo…and NSSL-NAL pGLM 1 minute composite showing an increase to 4 over past 5 minutes…and increasing updraft strengths. Given the environment, we expect to see an increased risk of severe storms with damaging winds in excess of 60 mph, frequent lightning over Franklin Colbert and Limestone counties over the next 1 to 2 hours. Storms over northern Mississippi past half hour still indicating localized winds to near 70 mph, according to spotter reports out of the Memphis NWS Foreccast Office.
Here is an good example of 3d Var picking up on a strengthening storm and some mid level rotation. The top 4 panel 3 d var from 1905 and the second is radar from 6 minutes later. The updraft strength, updraft helicity and updraft velocity products show a strong signal while the mid level storm relative velocity images (3 and 4 degree scans especially) have good rotation developing. Not much at low levels (images not shown) but nice example of 3-d Var pick up and highlighting mid level rotation. One additional feature that would be very good to have in the 3d var data is something that shows the height of max updraft helicity. Built a 4 panel to compare all tilts radar (top two panels) to 3-d var updraft helicity and storm top (10 km) divergence as they seem to be good parameters to for finding rapidly intensifying/severe storms and will have to see how it works for the next storm. Below is an example of the procedure with interesting gravity wave like features from the previously dissipating storm but nothing much firing yet to see how it works.
Interestingly there is a red (94%) and a few other CI detections in the vicinity of the ‘gravity wave’ looking things. Curious to see how they build…
Lightning activity has been prevalent in the FL-LDAR domain today and the ltg jump alg has detected multiple jumps in range of the domain. Scale_0 seems to be the most stable at keeping the storms ID’s unique while scale_1 seems to be dealing with lots of mergers/splits.
In the past half hour (2230-2300 UTC) at least 3 jumps have been detected at scale_0: cell IDs: 31025 @ 2242 UTC, 31107 @ 2245 UTC, and 31184 @ 2248 UTC (additional jumps likely occurred prior to this time).
Storm clusters at scale_0 at 2242 UTC. Cell 31025 was the primary storm of interest in the testbed.
The main cell of interest for forecasters in the HWT operating in the MLB domain has been #31025. 3DVAR products depicted increases in max updraft and vorticity as early as 2230 when the domain was re-centered over the storm. The storm maintained its strength through over the next half hour and the forecaster opted to continue the warning at 2256 UTC (the first TOR warning issued in the HWT was at 2225 UTC, see the forecaster post associated with these warnings for more info). The screenshots below from AWIPS2 include lightning, 3DVAR, MRMS & KMLB radar data for this event:
AWIPS2 screenshot 2245 UTC. Top left: 3DVAR max updraft composite; Top right: MRMS Refl @-10C, pGLM lightning flash extent density, & 1-min NLDN CG data; bottom left: MRMS MESH; bottom right: 3DVAR updraft helicity and 2 km winds
At the time the tor warning was issued in the HWT:
AWIPS2 screenshot @2257 UTC: Top left: pGLM flash extent density and 1-min NLDN CG data; top right: pGLM flash initiations & Tor warning; bottom left: refl @-10C; bottom right: KMLB 0.5 deg refl
Even as the clusters have become a bit more muddled, the storm tracking algorithm has seemed to maintain a good handle on individual clusters at scale_0, though some of the cell ID’s have changed…
WDSSII image at 2324 UTC: Left: Refl at lowest altitude and lightning flash contours; right: scale_0 storm clusters overlaid on pGLM flash extent density.
SHAVE is also operational today over this same area… current reports include 1 in hail and high wind:
SHAVE data between 2200 and 0000 UTC in the Kennedy Space Center domain. Gray H circles correspond to no hail, green H circles 1 in hail, and blue W circles severe wind. Reports include 1 in hail piled against side of house & dents to truck.
Technical difficulties of note: the KML images are not currently updating on the webpage, but should be back up in the next day or two; it is also possible that cron job notification of a python script stopped running mid-day on 2 May 2012 and data between 2 May and 14 May, may need to be reprocessed to assure that jumps occurred within the network range.
Based mainly on radar (Tampa’s and Melborne’s). We had just switched CWAs and were loading up new products so hadn’t had time to load and look at new products. The warning was issued for wind and hail for a storm right next to the Melborne radar. The storm which was tracking SEward then ran into line coming up from the south and fell apart (probably got its updraft source cut off). Had some issues with the AWIPS II set up to get the warning out with warngen. pGLM was showing flash rate of green (around 16 or 17 flashes per min per grid box) at this time.
Animation from 12 May 2011 covering from 2211-2226 UTC. The PGLM flash extent density is on the left with the corresponding radar reflectivity on the right. To see the animation, please click on the image.
Today’s afternoon shift started with forecasters working across the Norman, Tulsa, and Little Rock county warning areas. With the some storms beginning to form south and east of Norman, Oklahoma, it was felt this would be a good opportunity to take another look at the PGLM flash extent density observations and focus on total lightning. The PGLM flash extent density was very useful in identifying when the first cloud-to-ground strikes would occur. The PGLM was preceeding the first cloud-to-ground strike by approximately 30 minutes today.
As the the afternoon progressed, the storms began to intensify, both on radar and with the PGLM flash extent density and we shifted from using the PGLM for lightning safety and moved into warning operations. By 2211 UTC on 12 May 2011 (the first image of the loop shown above), three severe thunderstorm warnings were in effect. The area of interest for this post is in between the two existing warnings in the west. At 2211, the PGLM flash extent density was no more than a few flashes per minute. By 2214 UTC the number of PGLM flashes was already approaching 40 per minute. This continued to rapidly increase through 2220 UTC when the PGLM flash extent density observe 82 flashes in a 1 minute interval for a single 8×8 km grid box. This was one of the largest lightning jumps of the day with an increase of 75 flashes per minute in a nine minute time span. With this major lightning jump, along with the forecaster’s interrogation of radar data, a new severe thunderstorm warning was issued at 2226 UTC. This warning was later verified with several severe hail reports.
Submitted by Geoffrey Stano, PGLM PI for week of 9-13 May.