
As the MCS moves towards the Northern Alabama LMA, I thought it was a good time to compare colormaps and get feedback from each of the forecasters.
I added the following image to the large screen of the situational awareness display within the HWT and asked each forecaster which colormap they preferred – the one on the bottom left or the one on the bottom right.
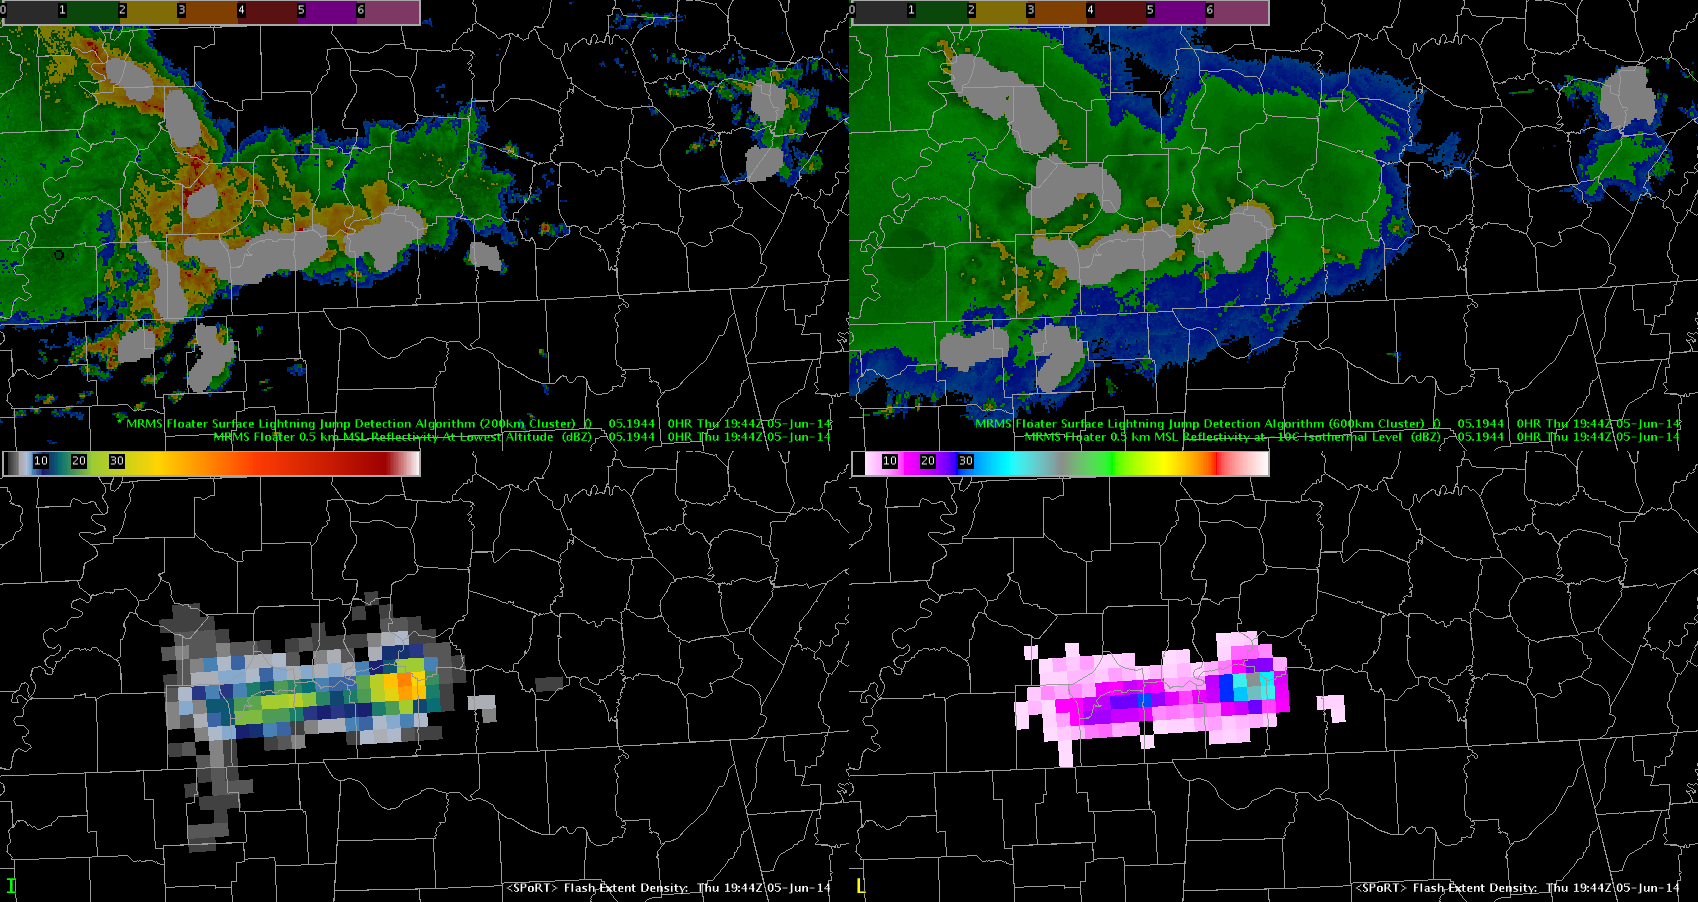
All forecasters this week preferred the colormap on the bottom left except for one specific case: when they want to overlay the data on radar. For that particular occurance, the bottom left is a bit to similar to the radar. However, all agreed that on its own or overlaid on satellite the colormap on the bottom left is much preferred. (note: the colormap on the bottom right is the default colormap for AWIPS2).
-K. Calhoun