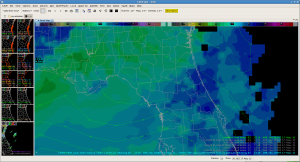
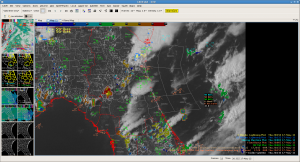
Noticed an interesting diagonal differential heating sort of boundary in across northern Florida where the next round of convection appears to be initiating. It show up well on the nearcast as s thetaE gradient and is now showing up on Vis and CI products…if this end up being the focus of more critical convection later in the afternoon this could be a really good application the nearcast product. There was a similar looking (though not sure if it was the same cause) feature when we were MLB two days ago that was where the bigger stuff triggered. Waiting to see….
Tag: GOESR-Nearcast
GOES sounder nearcasting CAPE
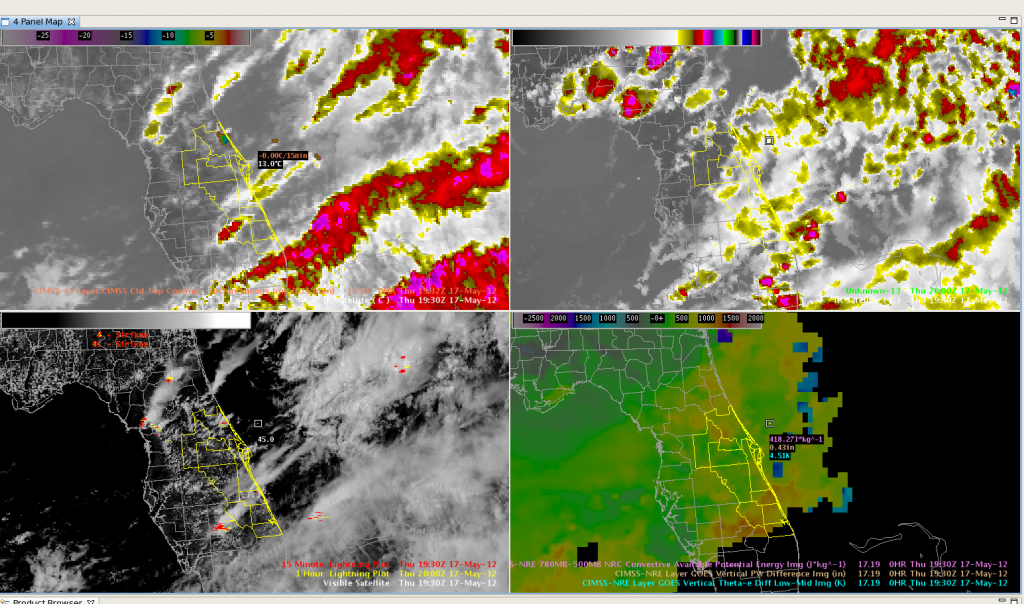
We’ve been keeping an eye on the relationship between the GOES nearcasting CAPE field and the coverage of the developing convection over Florida today. The synthetic satellite imagery has also done a good job on delineating the areal coverage of developing convection. The four-panel image has actual Infrared imagery on the upper left, synthetic satellite imagery on the upper right, visible satellite and lightning data on the lower left and a layered CAPE field derived from GOES-13 sounder nearcasting data. The highest CAPE values, around 1200 joules/kg, are located just to the northwest of Lake Okeechobee, with an axis of lower CAPEs further to the north. There is also a subtle increase in CAPE values over northern Florida, where additional convection is developing. The region with the lower CAPEs has weaker convection at this point. The synthetic satellite imagery is a 12 hour forecast using the 06z run of the WRF model, valid at 18z. It also does a nice job depicting less convection in the region of lesser instability.
Dankers/Kearney
NearCasting for JAX
We are focused on the JAX CWA today. While there is convection ongoing in the extreme northern portion of the area (bordering FFC and CHS), the GOES-R NearCast CAPE (new this week) and vertical theta-e difference suggest that the southern half of the JAX CWA is more conducive for new convection.
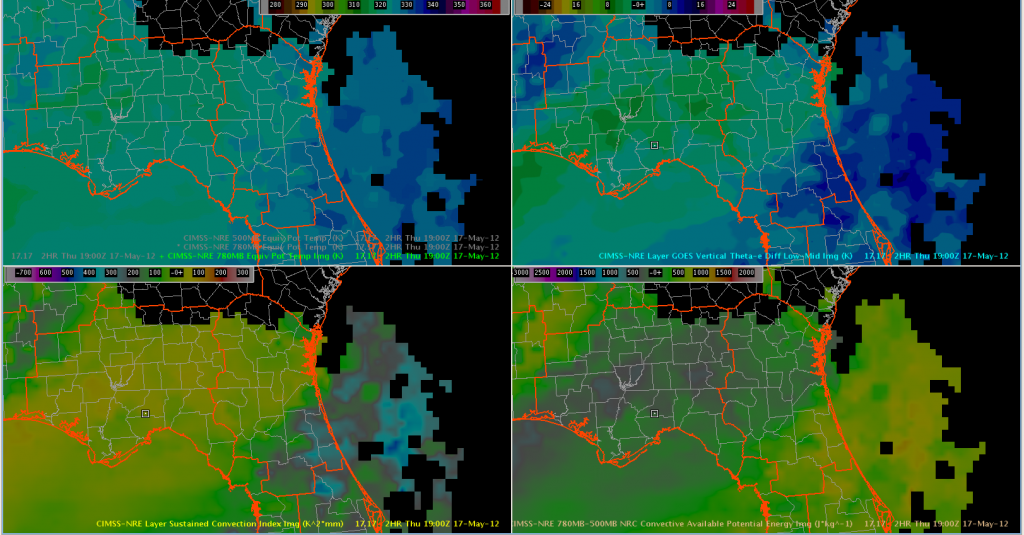
The NearCast has been challenging to interpret this week due to interpretation confusion (are negative versus positive theta-e differences indicative of instability) and then a mid-week visualization change in AWIPS 2. The NearCast shows promise for helping with the tremendously-difficult 1-6 hour timeframe, but the product stability has presented a problem.
The beat GOES on
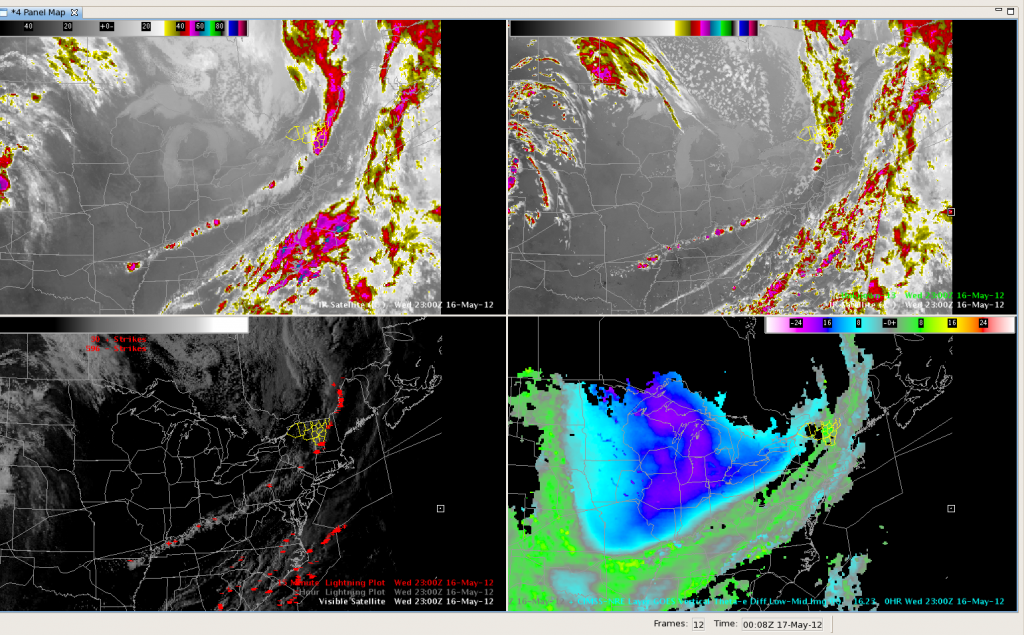
The synthetic imagery did a nice job of placing convection southward along the cold front through the Ohio and Lower Mississippi Valleys. Here’s a screen capture from 2300UTC, with the actual IR on the upper left and the model forecast on the upper right. Visible imagery with lightning is shown in the lower left pane, with the theta-e Nearcast product on the lower right. All in all, the GOES products did well today depicting where convection would be in relation to the cold front. This would be an excellent application to the CWSU environment for air traffic planning purposes.
Miscellaneous musings from ALY
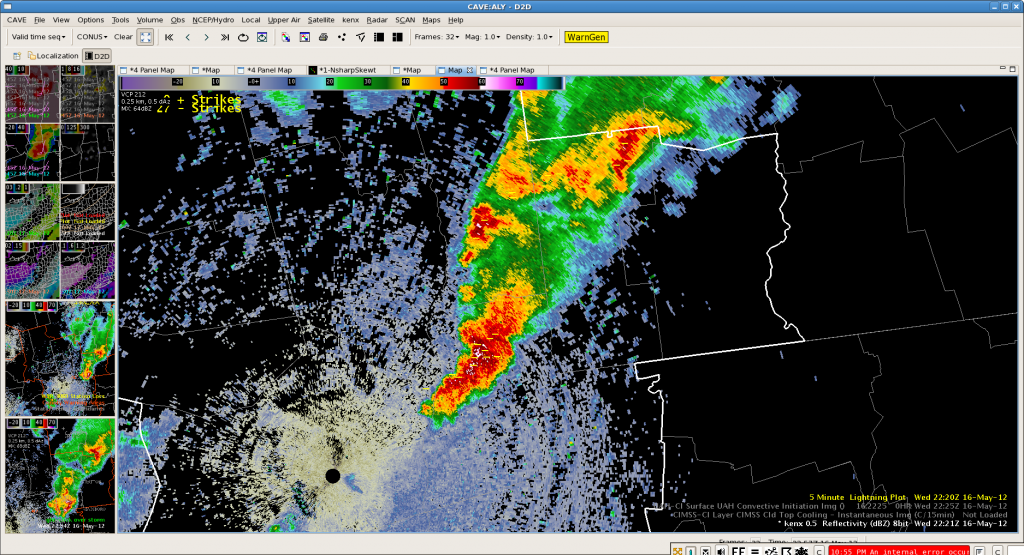
Had an interesting day working with convection in Albany’s CWA today. Several storms grew big enough to make severe hail, strong winds and show nice organized rotation..also a bow echo looking storm. In general the 3D Var and MRMS products proved useful for detecting hail concerns and also evaluating whether or not updrafts were strengthening or weakening…how high they were and whether or not there was good updraft helicity/vorticity. Also the azimuthal shear product from MRMS was useful/interesting. The nearcast thetha e product had its scale and units reversed since yesterday which caused some initial confusion but did seem to depict the more unstable regions well…though instability was fairly marginal.
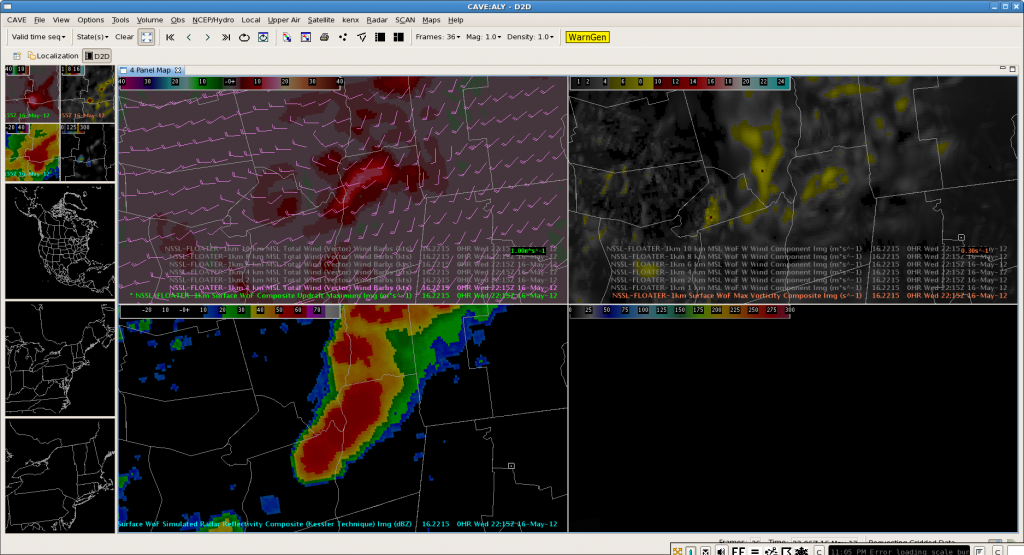
Some product limitations we ran into: With all the new fancy products we had, there really wasn’t anything to aid with max wind gusts. With the bow echo storm the 3d var fields were barely perturbed and did not at all seem representative of the probable wind speeds (images below show reflectivity and 3d var quad at same time with 1km (lowest available) winds…higher levels didn’t show much either)…old school use of radar velocities worked much better.
Some other products that would really be nice to have would be a 3-d or cross section way to look at updraft and downdraft strength, the horizontal plots of this could be overlayed at 1 km spacing in 3 d-var and was useful to watch through the life cycle of the storms but was very clunky to step through and hard to mentally visualize. In a 3d view this could be a very powerful way for forecasters to monitor and diagnose storm structure. Another thing we ran into today were training storms and flash flood concerns…dual pol was handy for this among other things but wonder about what applications of the fancy new products there might be to hydro concerns.
AWIPS 2/Warngen/CAVE issues continued again today with warnings that wouldn’t go out, multiple Cave crashes, lots of random error messages and slow downs. This system is not at all ready for operational use as they slowed/prevented warning issuances and having Cave crash mid warning ops when all the work station is running are 2 Caves not at all confidence inspiring when you think about everything else AWIPS in WFOs runs and does in addition. Also found an interesting bug with the map background in the quad panels where they don’t always stay linked and you can unpredictably end up with map scales and alignments in different sections of the quads.
Monitoring & Forecasting DVN Convection
Despite strong indications from the NSSL-WRF SimuSat imagery, convection in the DVN CWA has stayed rather benign. The NSSL-WRF appears to have overestimated the low-level prefrontal moisture.
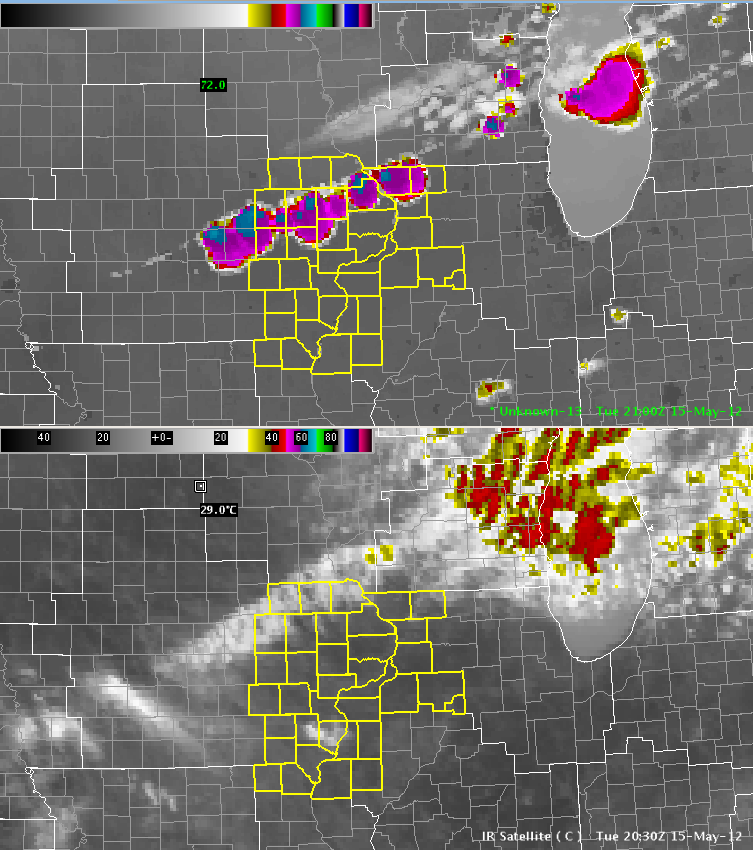
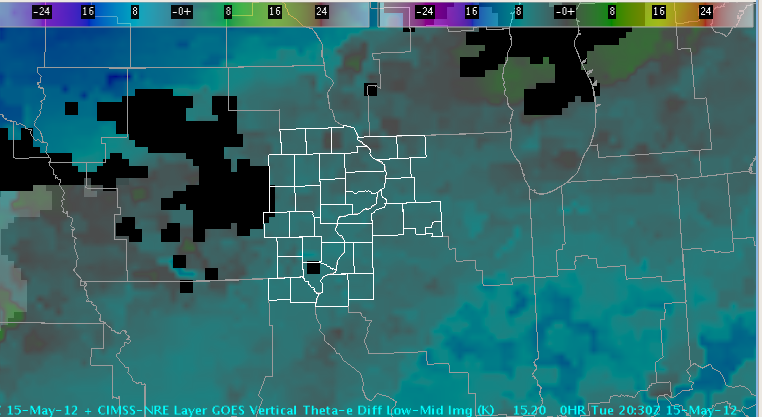
The GOES-R NearCast Theta-E Low vs. Mid-Level Theta-E image indicates very little destabilization ahead of the front (in fact, it actually indicates increased stability). This is consistent with surface dewpoints in the 30s and 40s reported ahead of the front.
There have been a few cloud-to-ground lightning strikes just to the northeast, and the 3DVAR and MRMS data have helped to monitor the convection across multiple CWAs and on the edges of multiple radars.
LWX 20Z
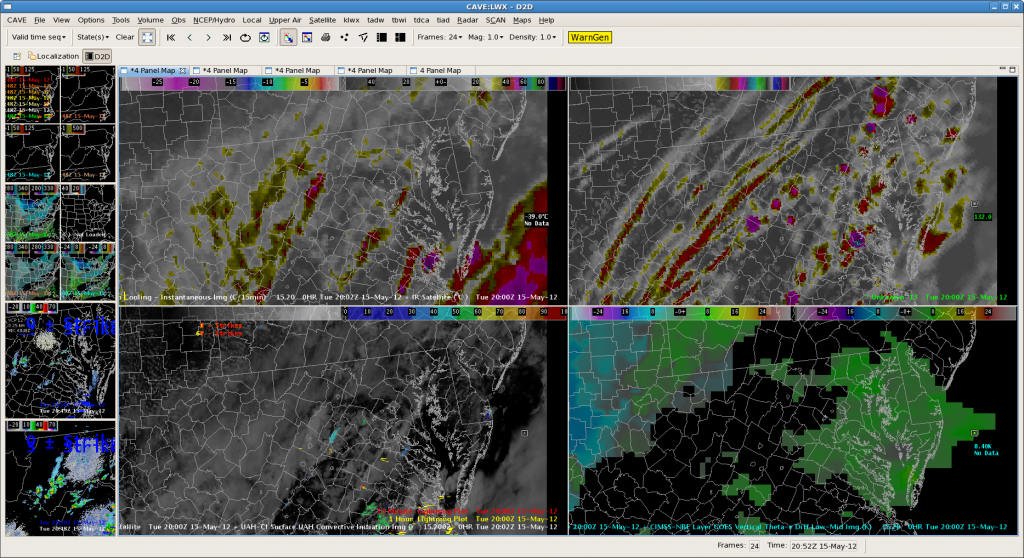
Being LWX today for another rather quiet day. Nearcast products and simulated satellite (and HRRR and 3dVAR) both showed marginal instability and a few air mass sort of thunderstorms and that is what has been happening. It has let us see a few flashes on the pGLM products but not really enough to evaluate usefulness in warning situation. Image below shows nearcast theta e product in lower right (showing not much) and simulated IR in upper right showing spotty but unimpressive convection. Left two panels are real IR & Vis sat showing that the simulated stuff not bad. The CI products seem to be hitting areas that do end up as the small thunderstorms but not sure they are showing more than can be diagnosed by looking at the satellite imagery so not sure if I would warn on this product any more often than the satellite and radar alone but good quick check to make sure I am not missing anywhere I should be watching.
BRO MESO Desk @ 0010Z
NearCAST guidance continues to support the enhancement of thunderstorm development from Jim Hogg and Starr counties. It’s appears the model indicated a weak disturbance increasing Theta E across forecast area between 01Z and 04Z, which will add to the existing unstable conditions. Severe thunderstorm potential remains high. Emergency managers and other decision makers are strongly encouraged to prepare for the threat of severe weather through 05Z. Isolated tornadoes are still possible. rn/ams
BRO Meso Analysis with Nearcast/Sythetic WRF at 2030Z
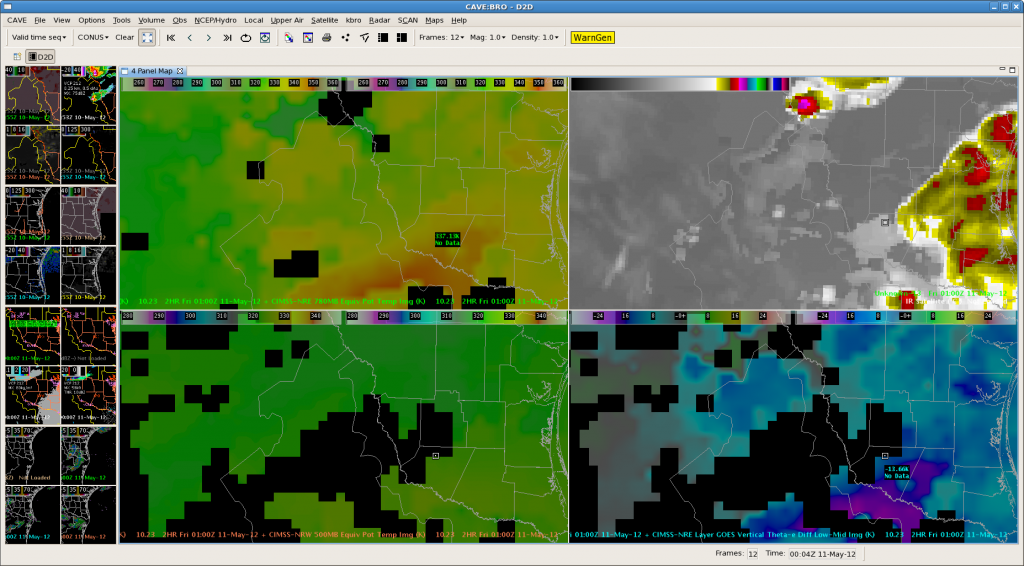
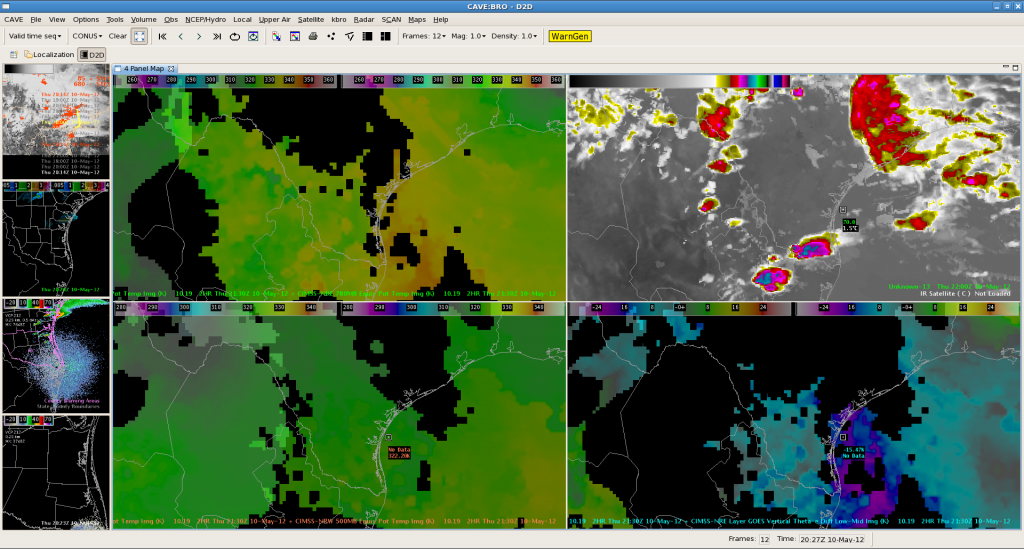
The below image at 22Z depicts nearcast theta-e at 780 mb in the upper left pane, synthetic WRF IR in the upper right, nearcast theta-e at 500 mb in the lower left, and nearcast vertical theta-e difference low-mid in the bottom right.
Looking at the 780 mb theta-e, it shows areas in yellow of best moisture/instability predicted for this afternoon which matches up with storms predict in synthetic IR imagery. Because the 2 products derived off of different model projections are in decent agreement, this lends more confidence to this convective scenario for this afternoon.
AMS/Nunez

