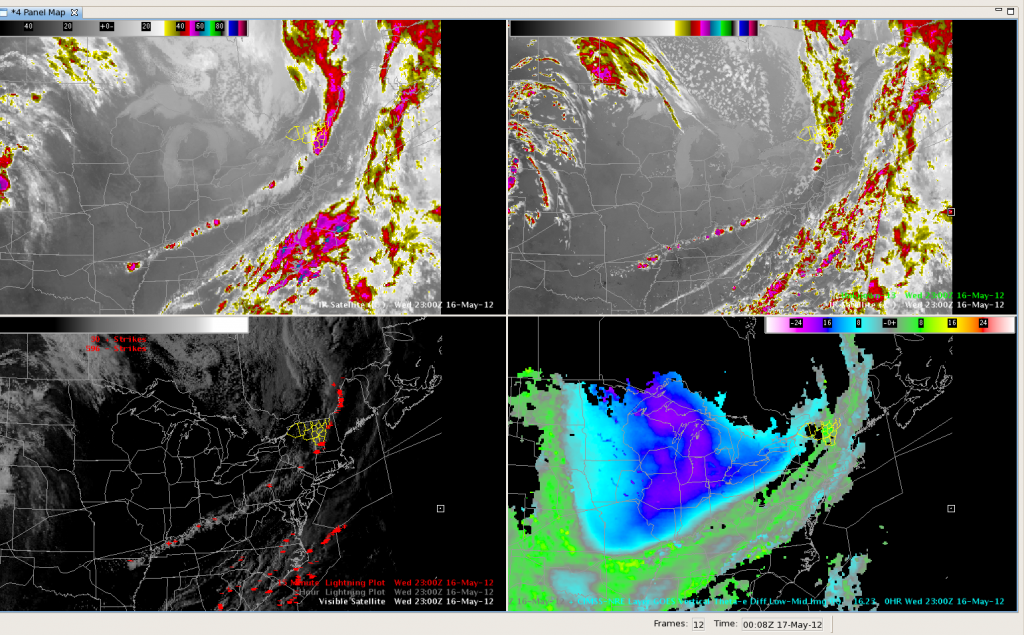
The synthetic imagery did a nice job of placing convection southward along the cold front through the Ohio and Lower Mississippi Valleys. Here’s a screen capture from 2300UTC, with the actual IR on the upper left and the model forecast on the upper right. Visible imagery with lightning is shown in the lower left pane, with the theta-e Nearcast product on the lower right. All in all, the GOES products did well today depicting where convection would be in relation to the cold front. This would be an excellent application to the CWSU environment for air traffic planning purposes.

