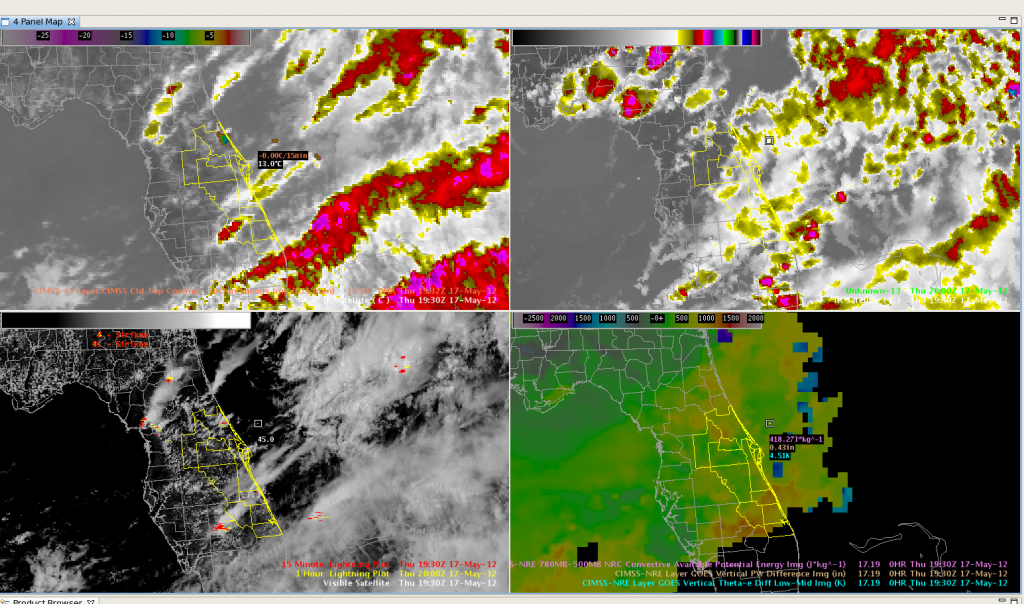
We’ve been keeping an eye on the relationship between the GOES nearcasting CAPE field and the coverage of the developing convection over Florida today. The synthetic satellite imagery has also done a good job on delineating the areal coverage of developing convection. The four-panel image has actual Infrared imagery on the upper left, synthetic satellite imagery on the upper right, visible satellite and lightning data on the lower left and a layered CAPE field derived from GOES-13 sounder nearcasting data. The highest CAPE values, around 1200 joules/kg, are located just to the northwest of Lake Okeechobee, with an axis of lower CAPEs further to the north. There is also a subtle increase in CAPE values over northern Florida, where additional convection is developing. The region with the lower CAPEs has weaker convection at this point. The synthetic satellite imagery is a 12 hour forecast using the 06z run of the WRF model, valid at 18z. It also does a nice job depicting less convection in the region of lesser instability.
Dankers/Kearney

