EWP2012 PROJECT OVERVIEW:
The National Oceanic and Atmospheric Administration (NOAA) Hazardous Weather Testbed (HWT) in Norman, Oklahoma, is a joint project of the National Weather Service (NWS) and the National Severe Storms Laboratory (NSSL). The HWT provides a conceptual framework and a physical space to foster collaboration between research and operations to test and evaluate emerging technologies and science for NWS operations. The Experimental Warning Program (EWP) at the HWT is hosting the 2012 Spring Program (EWP2012). This is the fifth year for EWP activities in the testbed. EWP2012 takes place across five weeks (Monday – Friday), from 7 May through 15 June. There are no operations during Memorial Day week (28 May – 1 June).
EWP2012 is designed to test and evaluate new applications, techniques, and products to support Weather Forecast Office (WFO) severe convective weather warning operations. There will be three primary projects geared toward WFO applications this spring, 1) evaluation of 3DVAR multi-radar real-time data assimilation fields being developed for the Warn-On-Forecast initiative, 2) evaluation of multiple CONUS GOES-R convective applications, including pseudo-geostationary lightning mapper products when operations are expected within the Lightning Mapping Array domains (OK/west-TX, AL, DC, FL), and 3) evaluation of model performance and forecast utility of the OUN WRF when operations are expected in the Southern Plains.
WEEK 2 SUMMARY:
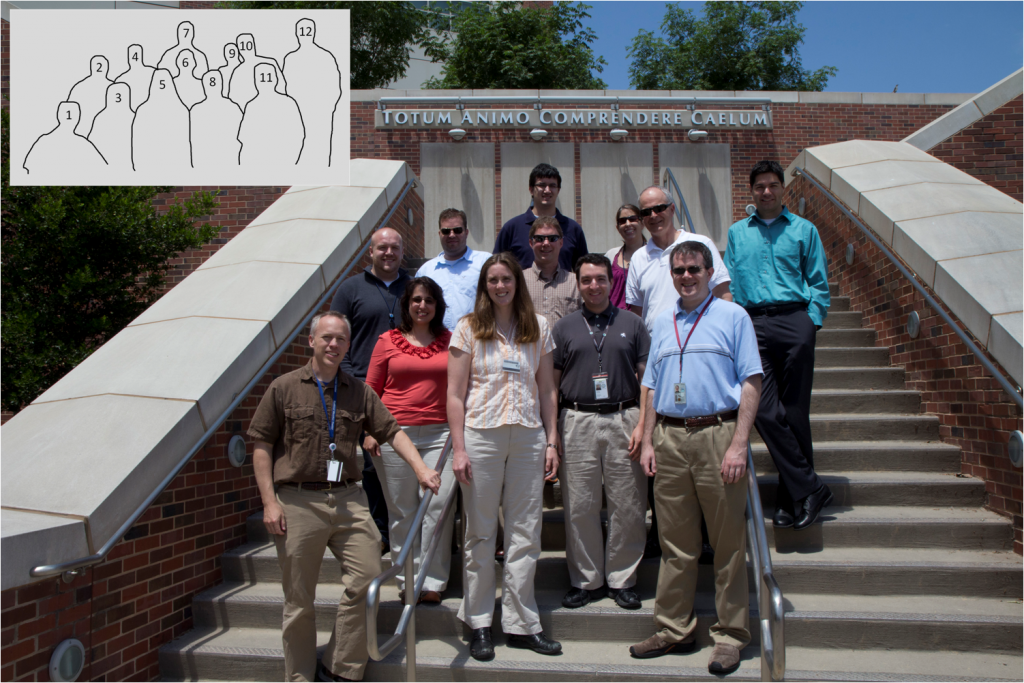
Week #2 of EWP2012 occurred during 7-11 May. NSSL and the GOES-R program provided travel funds for four forecasters from the NWS: Brian Carcione (WFO, Huntsville, AL), Stephen Kearney (CWSU, Memphis, TN), Julia Ruthford (WFO, Charleston, WV), and Todd Dankers (WFO, Denver, CO). Other visiting participants this week included Dave Carlsen (Environment Canada), Bob Aune (UW-CIMSS), Wayne Feltz (UW-CIMSS), Jordan Gerth (UW-CIMSS), Lori Schultz (UAH), and Chad Gravelle (GOES-R NWSTC liaison, Kansas City, MO). Overall the weather pattern was exceptionally quiet for this time of year as a large ridge dominated the central US. Nevertheless, southern stream disturbances brought convection to the Rio Grande Valley eastward into Florida. And northern stream flow over the ridge allowed short-wave troughs to deliver convection from the Western Great Lakes to the East Coast.
Photo: 1) Jim LaDue (NWS/WDTB), 2) Chris Siewert (CIMMS/SPC/GOES-R), 3) Lori Schultz (UAH), 4) Chad Gravelle (GOES-R NWSTC liaison), 5) Julia Ruthford (WFO, Charleston, WV), 6) Todd Dankers (WFO, Denver, CO), 7) Jordan Gerth (UW-CIMSS), 8) Stephen Kearney (CWSU, Memphis, TN), 9) Kristin Calhoun (CIMMS/NSSL), 10) Bob Aune (UW-CIMSS), 11) Brian Carcione (WFO, Huntsville, AL), and 12) Gabe Garfield (CIMMS/WFO Norman, OK). Photograph by Greg Stumpf (CIMMS/NWS-MDL).
REAL-TIME EVENT OVERVIEW:
14 May: SC early, and then Central FL. SW TX was also briefly worked.
15 May: Western VA, Eastern IA, and Central FL all had marginal storms.
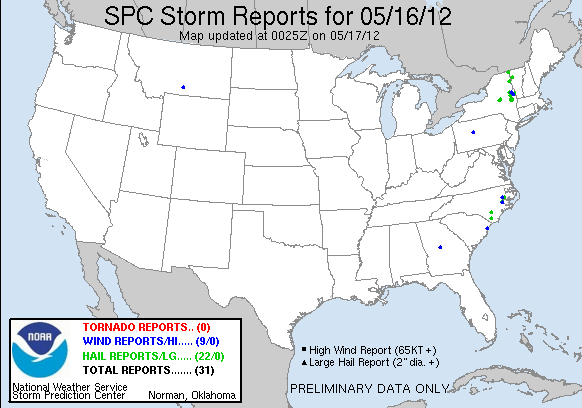
16 May: Hailers in VT and Upstate NY.
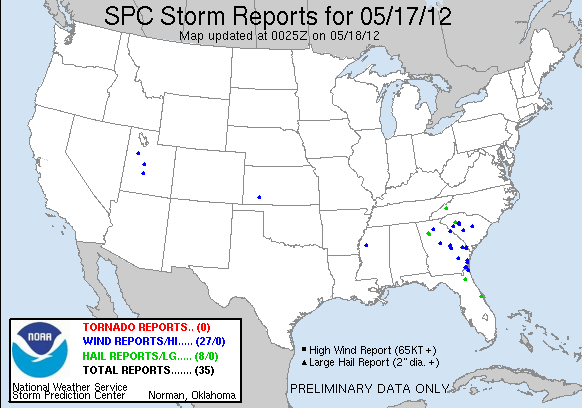
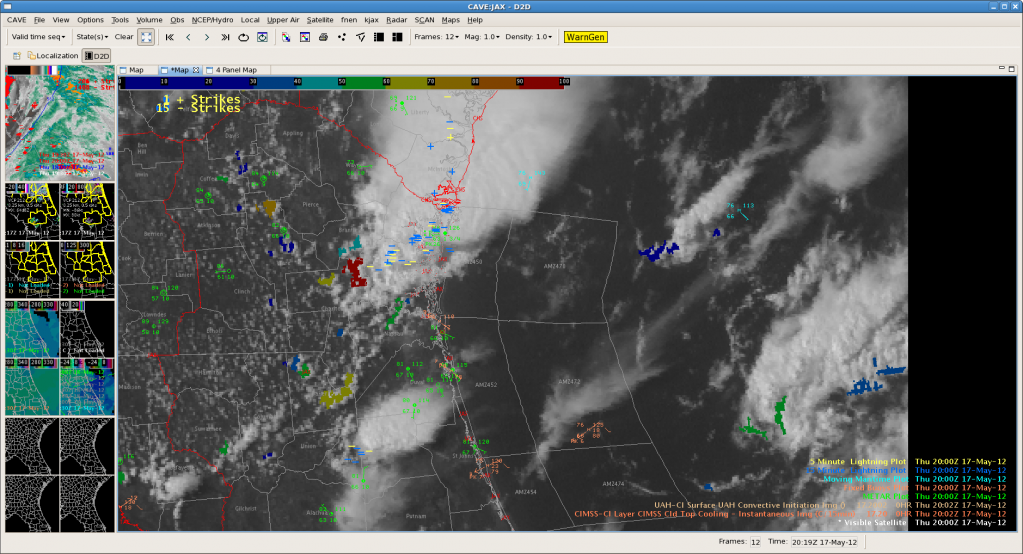
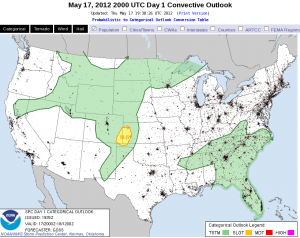
17 May: A marginally-severe event across eastern FL, GA, and SC.
FEEDBACK ON EXPERIMENTAL PRODUCTS:
NSSL 3DVAR DATA ASSIMILATION:
NSSL 3DVAR products were quite useful as judged by the majority of forecaster comments. But there were a few drawbacks. The following are specific comments:
Benefits:
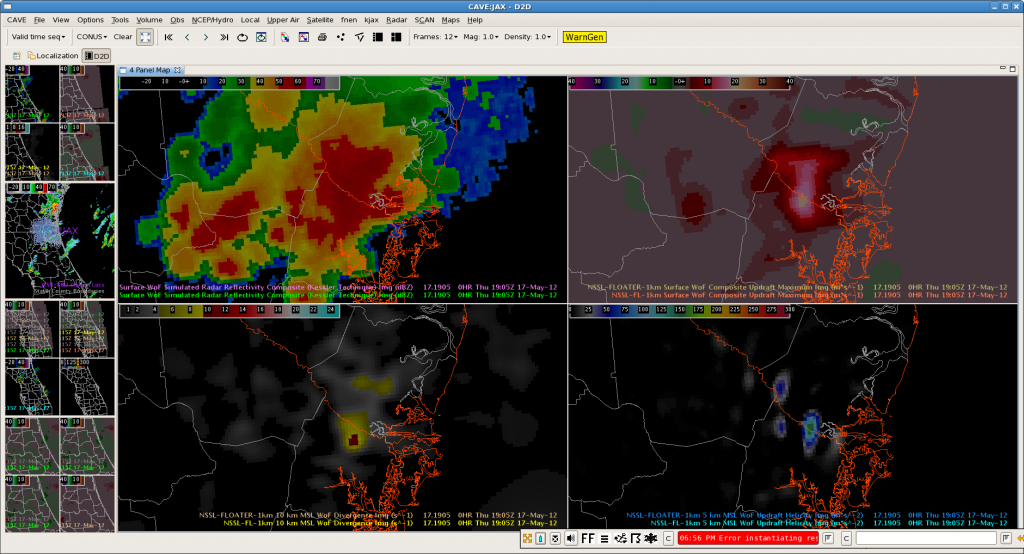
- Ten km divergence was extremely useful. Somehow when the colorscale turned red (10 ^s-1), it seemed to precede severe weather. On May 16, 10 km divergence turned red 20 min before the first report of large hail. It also was useful at far ranges from radars. NSSL may actually adjust so that max divergence at upper levels would be used, or storm top divergence would be added.
- Updraft helicity was extremely useful too. But it was more the trend that was important.
- Updraft strength was used with success. The team that covered the NWS Burlington, VT CWA storms on May 16 noted values of 12 – 16 m/s preceded severe reports.
Challenges:
- 3DVAR had problems depicting the rear inflow into a bow echo northeast of Albany, NY on May 16.
- Beam blockage issues in Burlington’s area possibly produced spurious updrafts.
- There was little calibration with respect to identifying what horizontal winds at the lowest levels could be associated with severe winds at the ground.
Wishlist:
- Would’ve liked cross-sections and information on elevation of max vorticity and updraft strength.
- What can be done about visualizing 1 km wind? Fabricating 1 km wind and making comparison to ground reports is desirable. Preferred something in addition to wind barbs. Would’ve liked isotachs on wind barbs.
- Forecasters would like to go up in MRMS product height levels like all-tilts does with PPI elevation scans.
- No one compared the 3DVAR maximum vorticity to the MRMS azimuthal shear product.
OUN-WRF:
There were no events within the OUN WRF domain this week.
Multiple-Radar / Multiple-Sensor (MRMS)
Everyone was in agreement that the MRMS products were quite useful in depicting storm intensity trends at higher frequency than traditional radar data. Here are some other remarks below:
Benefits:
MRMS was very good in quantifying trends azimuthal shear without having to worry tilts.
- MRMS was complimentary to 3DVAR in highlighting first indications that a storm was going severe.
- Could see MESH, and 60 dBZ height products trend upward before single radar features.
- It was good in figuring out if warning should be continued.
- Liked using height of 50 dBZ above -20 and -10 C, especially for lightning anticipation.
- Accuracy was good in MESH though perhaps with a somewhat high bias. That may be due to lack of perfectly placed reports.
- MRMS Helped validate base data.
- Most common products: height of 50 dBZ above -20C & -10C, MESH.
- Update frequency seemed good, not too frequent, not too noisy.
Challenges:
- Could see a forecaster just warning when a 50 dBZ echo reaches above a certain temp level.
Wishlist:
- Thought a negative in the volume browser was having NSSL 0.5 km vs 1 km split into different grids.
- Need good training to calibrate forecaster to strong values within MRMS products.
- MRMS needs to be imported into FSI
- Forecasters would like to go up in MRMS product height levels like all-tilts does with PPI elevation scans.
GOES-R SimuSat:
The simulated satellite imagery was useful to visualize model output, and sometimes scarily accurate given the storm-scale model was run almost 24 hours before the experiment time. Here are some comments below:
Benefits:
- Couldn’t live without it? Thought it was amazingly useful tool for evaluating model convection. WRF runs were quite accurate.
- The product was useful in figuring out whether to go to Chicago or Davenport on Tuesday. Would we have made those same decisions looking at QPF?
Challenges:
- Didn’t recognize that the output was tuned to GOES-R instruments and not current GOES. This was especially true with WV imagery. It looked very different compared to obs.
Wishlist:
- Would it be better to have a somewhat different colorscale.
- Would like simusat in GFE because that’s where the grids are being produced. Would also like a cloud base image (the cloud base is not satellite but camera view).
GOES-R Nearcast:
The Nearcast product was often used by forecasters mostly before they were consumed by warning decisions. Both CAPE and delta-Theta-E were used most often. Here are a few comments below:
Benefits:
- Really liked the CAPE product. Qualitatively it was highlighting the areas needed for closer inspection of convective potential.
- Noticed CAPE did differ from delta-Theta-E in places.
- Noted the good job nearcast products diagnosed the outflow interacting with the seabreeze and then having the storms initiate there later.
- There were good delta THTE gradients in Arkansas
Challenges:
- Nearcast products didn’t depict the Hudson Valley instability maximum as well as RAP data, or just looking at surface dewpoint observations.
- None of them liked the signs of delta THTE changing from one day to the next. Credibility was lost a bit.
GOES-R CI (UAH, UW Cloud top cooling)
Both tools received mixed reviews but mostly positive. Forecasters found that they were useful at most times. Though sometimes, the CI product didn’t detect CI for various reasons (e.g., cirrus, other unknowns). Here are specific comments below:
Benefits:
- Thought that adding the strength of signal color scheme was a significant improvement to the UAH CI tool.
- The cloud top cooling product detections were better correlated with potential severity than the UAH CI detections.
- Would like to pull in these products into the NWS pilot projects.
Challenges:
- Had to stop from associating high UAH values with intensity. Be wary of missed expectations with products. This potential for confusion could be reduced with good training.
Wishlist:
- Would like to include it into the pilot project in Charleston.
GOES-R PGLM
While we used the LMA a couple times, there was not enough action to get a good feeling for what values constituted timing for using for warning decision. The case study showed jumps in the first hour of initiation. This product was a bit lost within all of the other products.
There are more GOES-R feedback details on the GOES-R HWT Blog Weekly Summary.
AWIPS2
The following comments were made by the forecasters as they recalled their memories of using AWIPS2 in HWT experimental warning operations:
- Paraphrasing the forecaster’s thoughts, If they could use up-arrow keys to ascend model layers or any 3-D grid, that would be great!
- FSI should add 3-D visualization for MRMS or 3dVAR.
- Julia would like to be able to contour image and overlay contours on other images.
- Julia experienced difficulty with keeping AWIPS2 up and running more so than others. Her failure rate for issuing warnings was 25%.
- AWIPS2 was great for loading any data on CONUS scale and zooming in as far as WFO-scale could do in the past.
OVERALL COMMENTS:
We were short on logistics discussions but a few points came out worthy of note:
- Training day was great! But still struggled on the first days.
- Would like training delivered a few weeks ahead of time. Took training in smaller chunks than time allowed.
- Couldn’t get an admin shift added for the last minute.
- There are the usual WES issues. Some offices have operable WES machines while others do not.
- Thought a quick reference guide would be good.
CONTRIBUTORS:
Jim LaDue, EWP2012 Week #2 Weekly Coordinator


