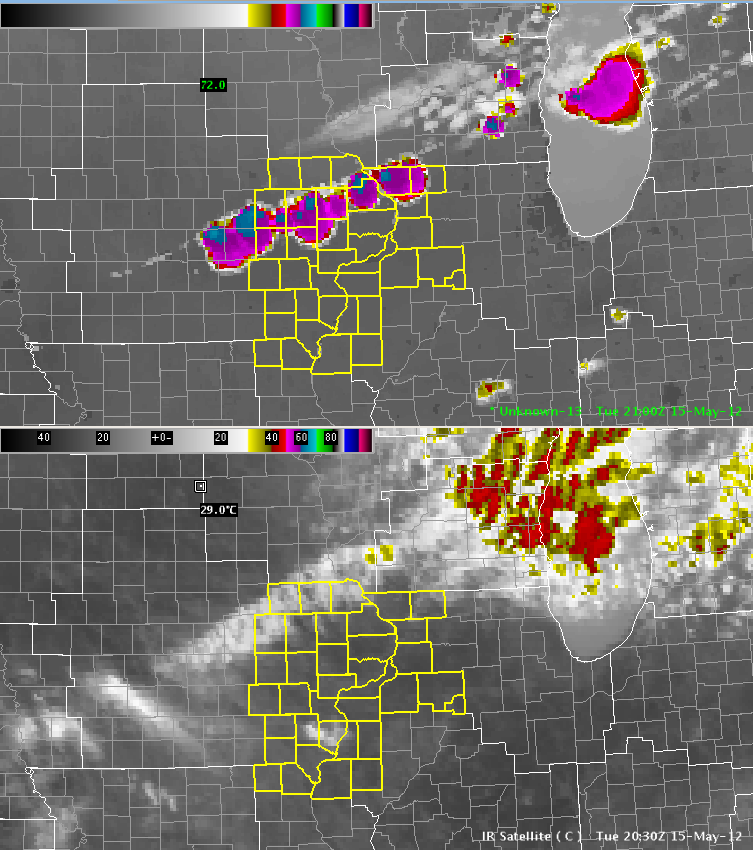
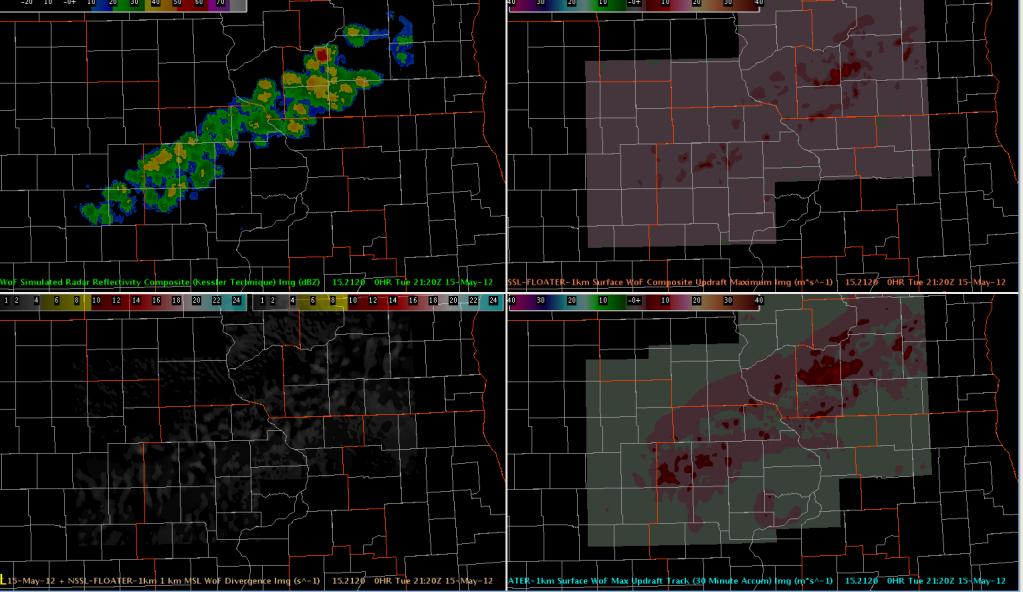
Despite strong indications from the NSSL-WRF SimuSat imagery, convection in the DVN CWA has stayed rather benign. The NSSL-WRF appears to have overestimated the low-level prefrontal moisture.

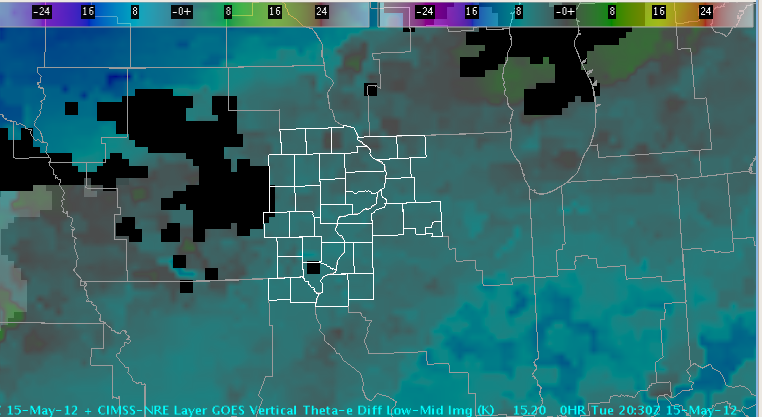
The GOES-R NearCast Theta-E Low vs. Mid-Level Theta-E image indicates very little destabilization ahead of the front (in fact, it actually indicates increased stability). This is consistent with surface dewpoints in the 30s and 40s reported ahead of the front.

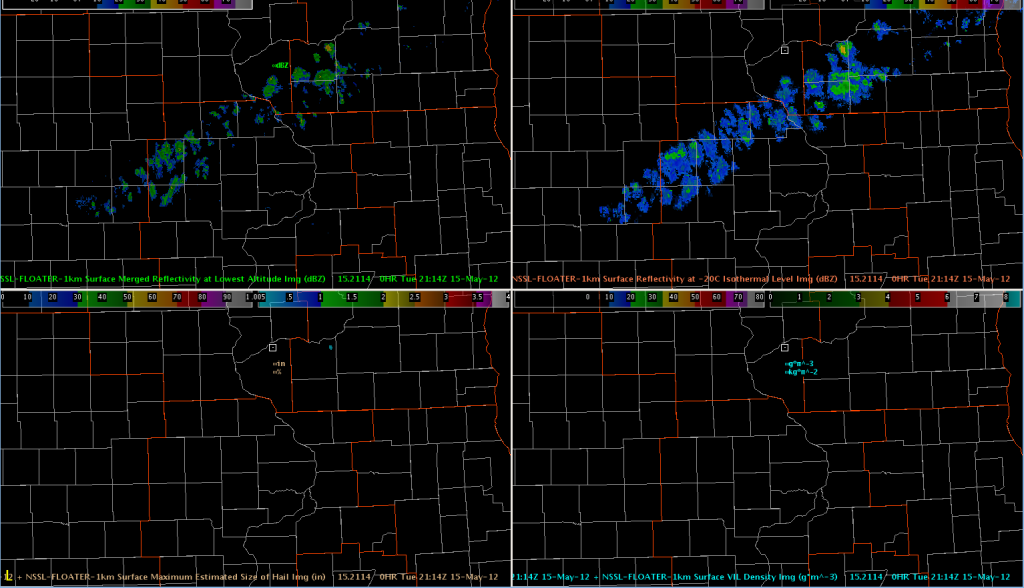
There have been a few cloud-to-ground lightning strikes just to the northeast, and the 3DVAR and MRMS data have helped to monitor the convection across multiple CWAs and on the edges of multiple radars.


