Single-Radar AzShear vs MRMS Merged Shear: Lag Time

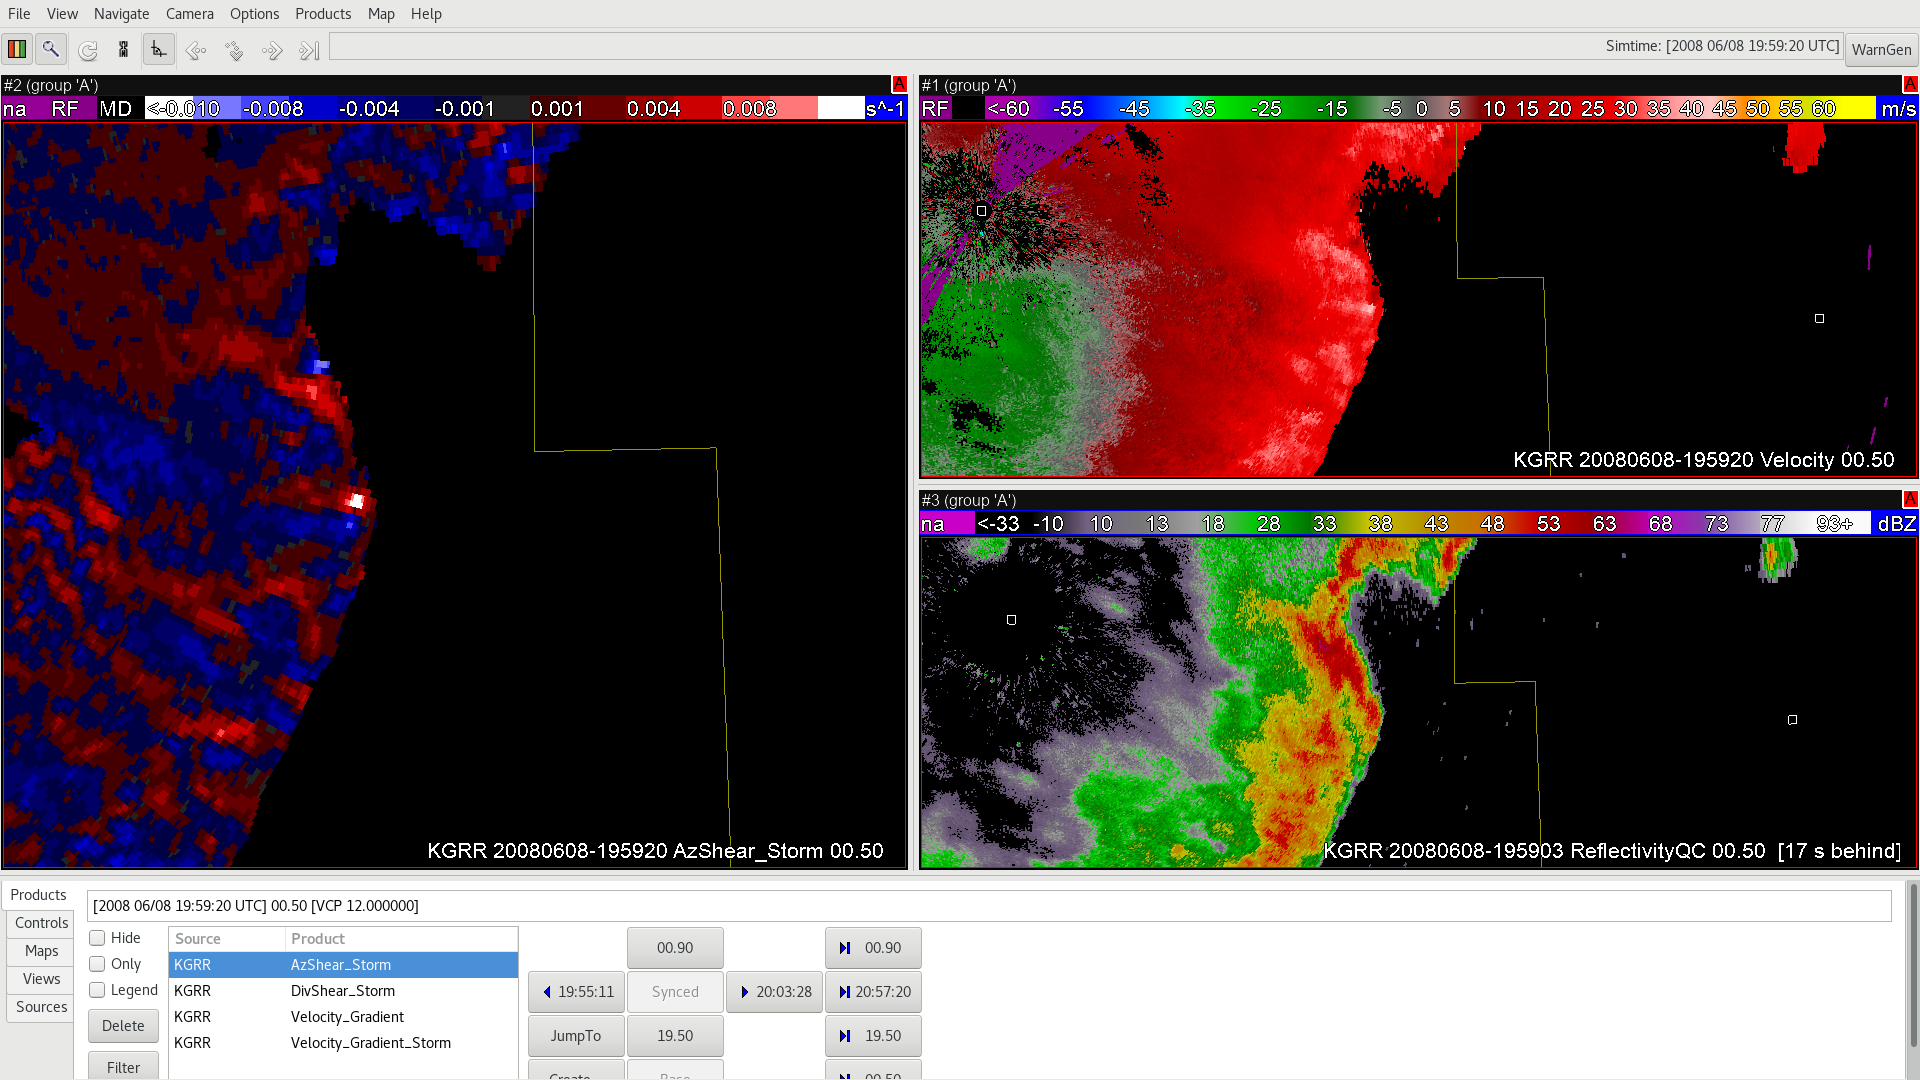
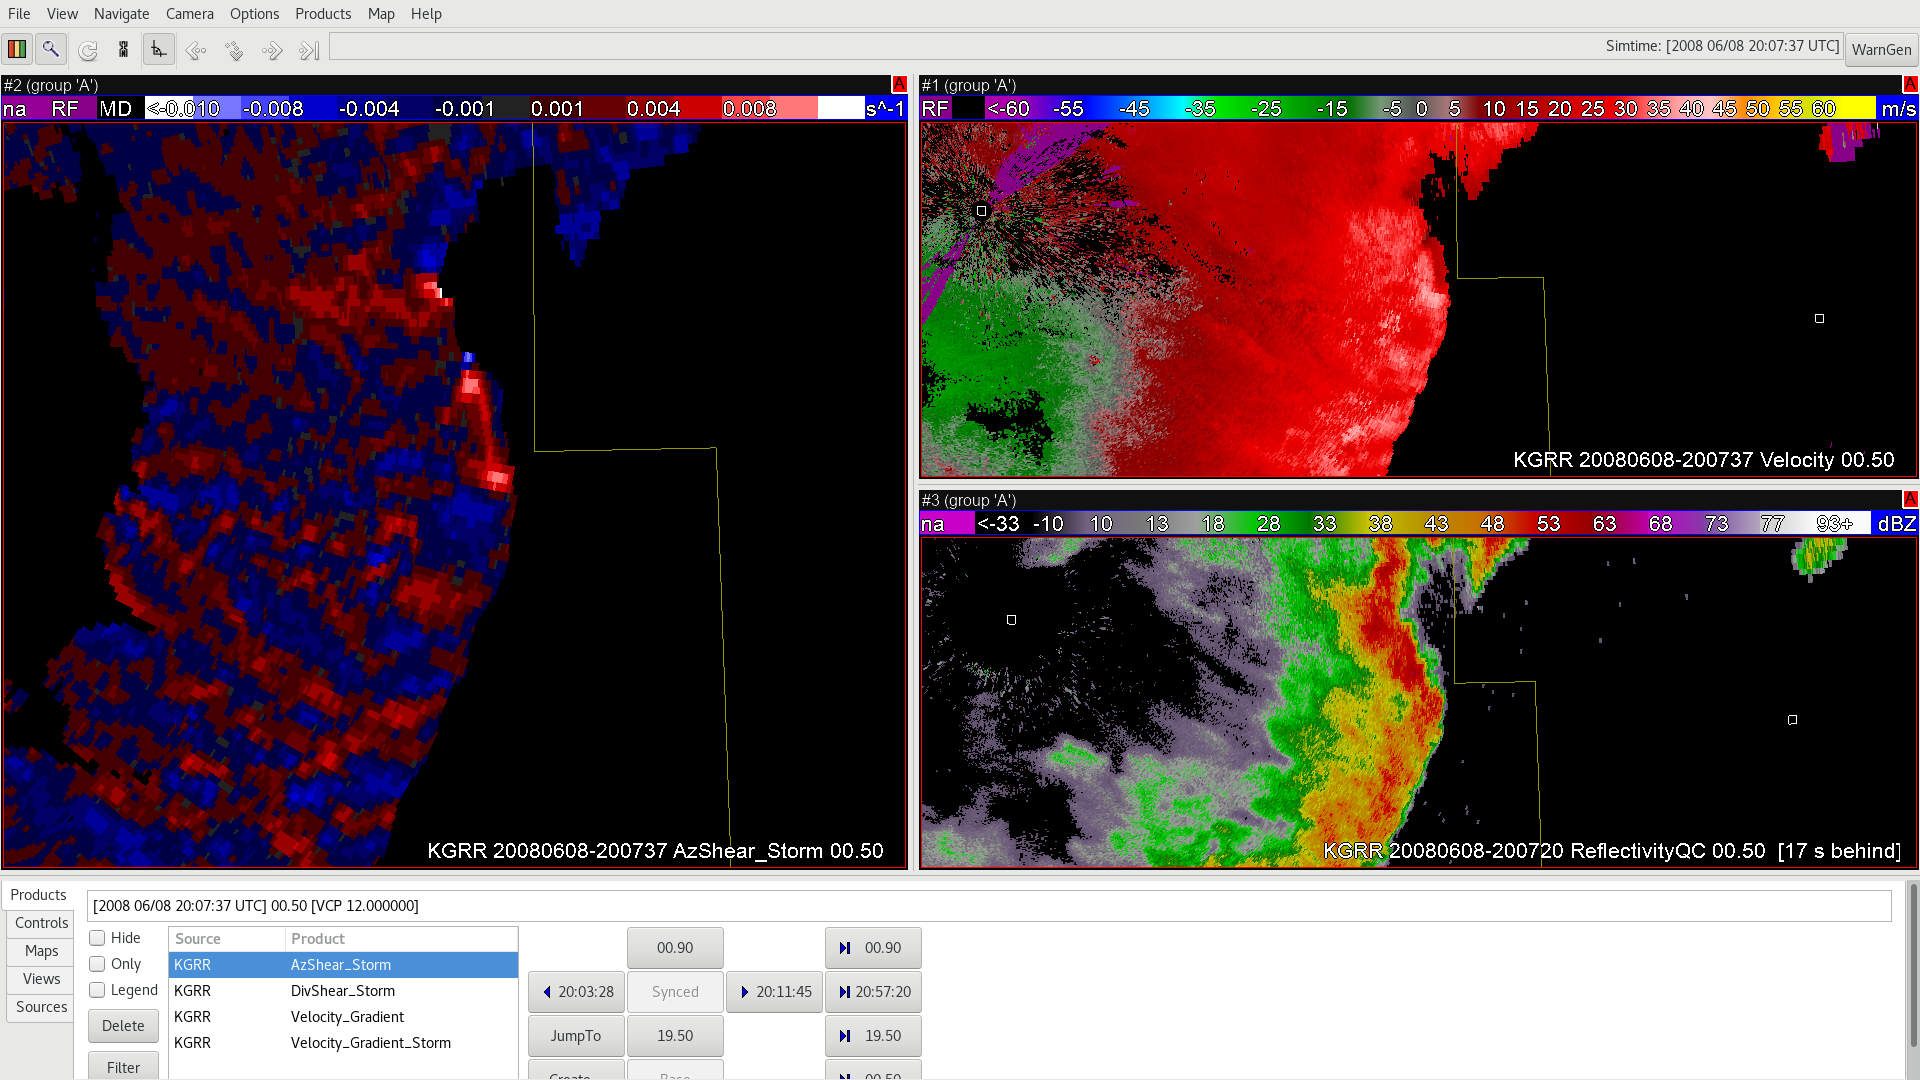
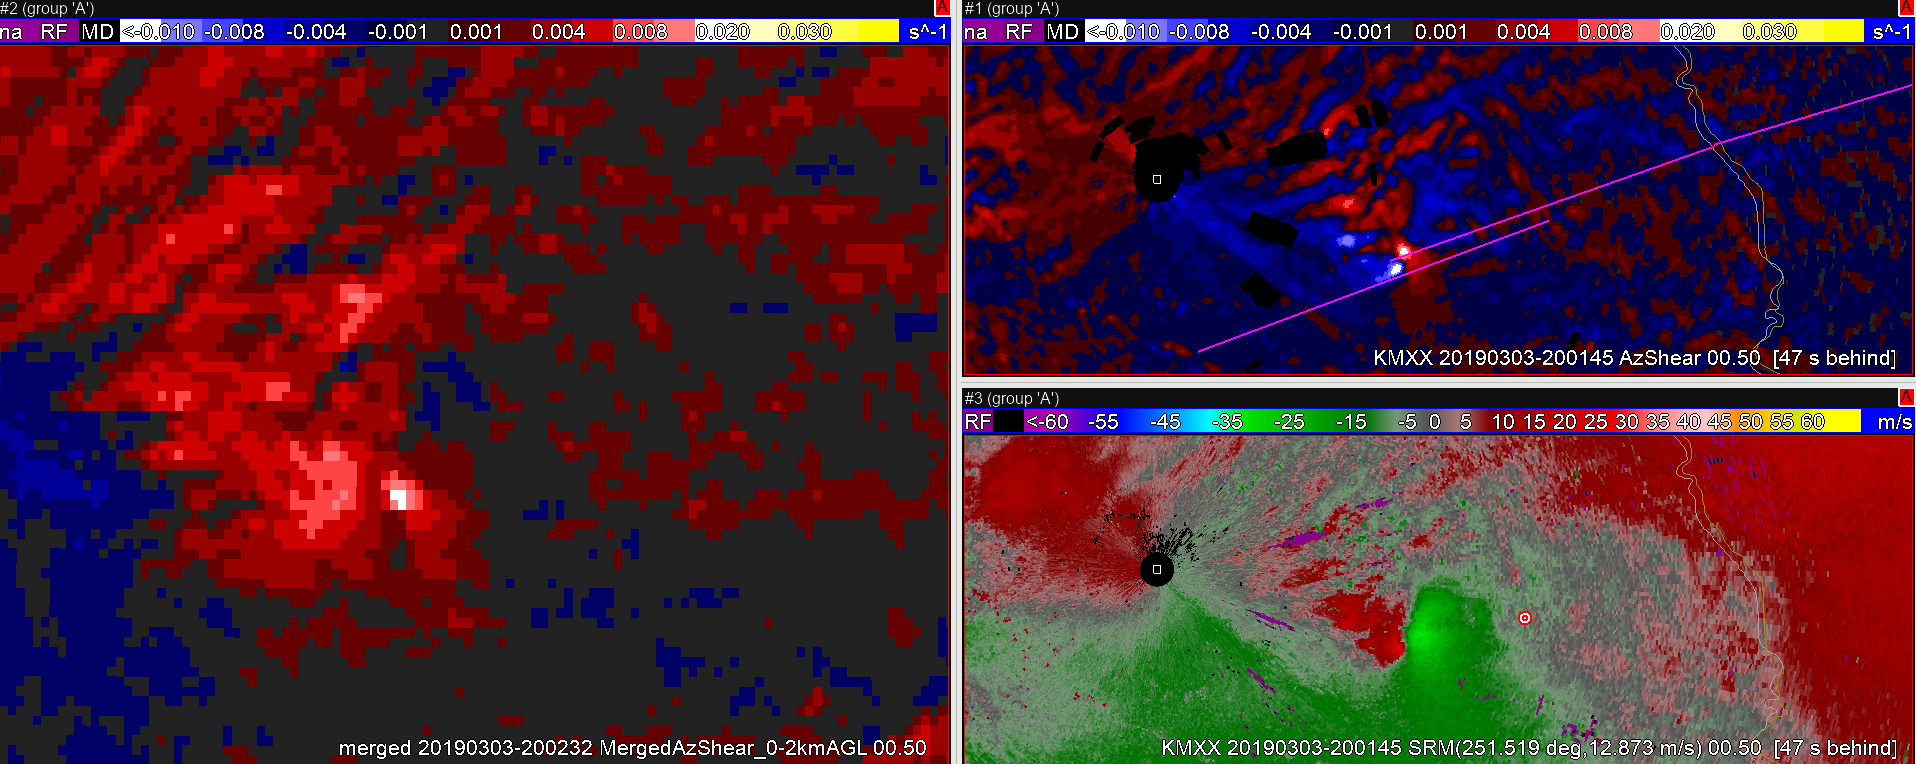
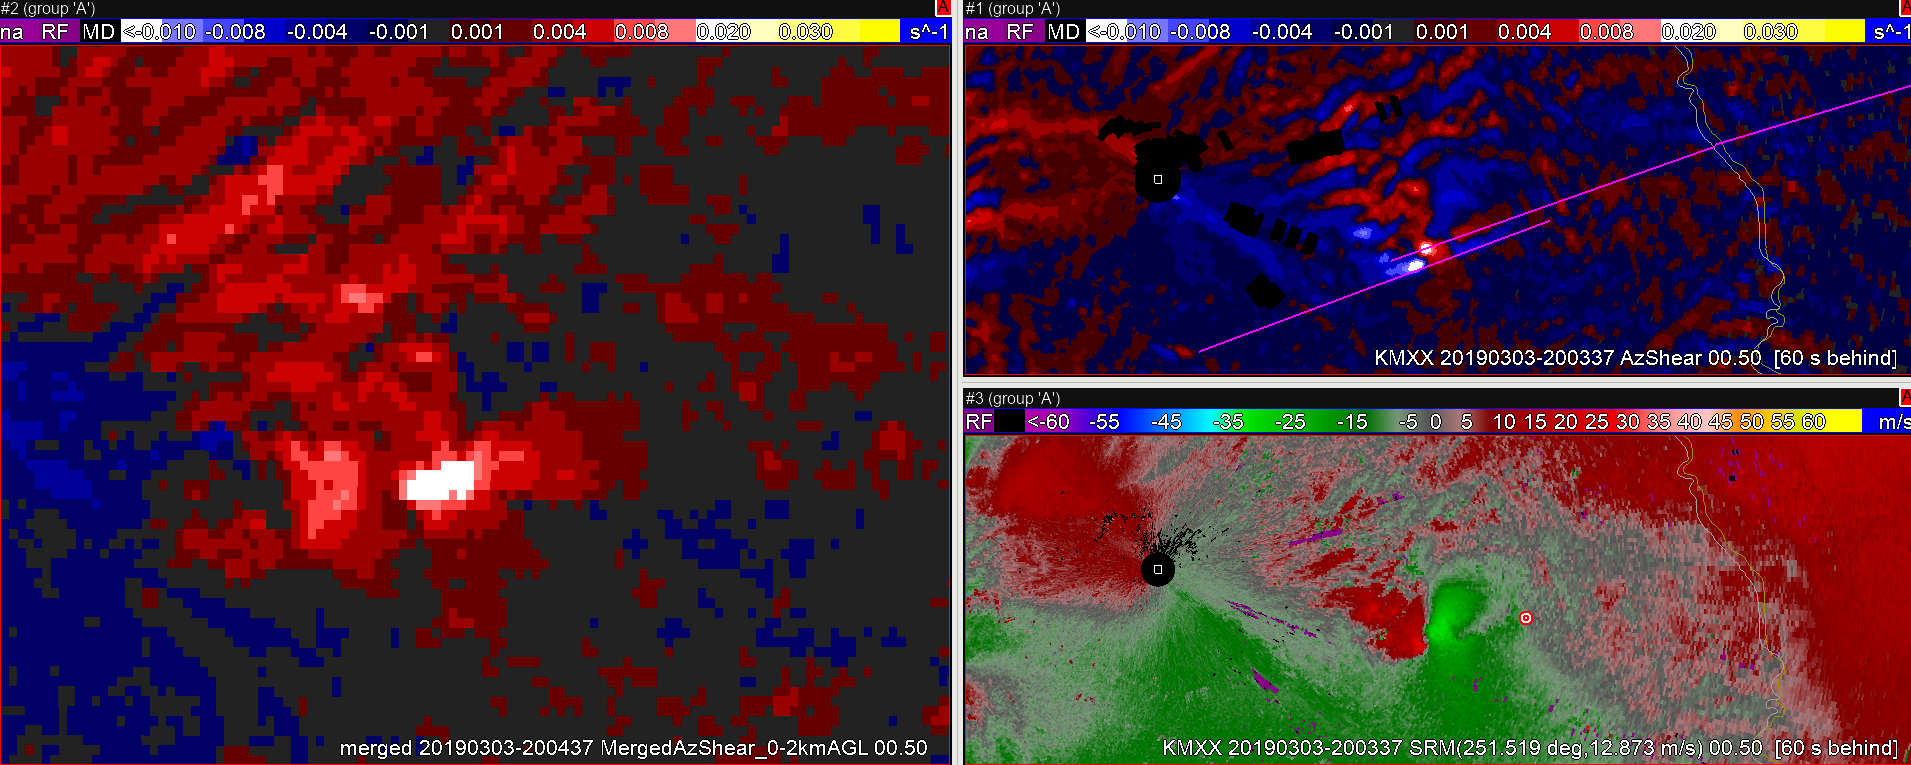
An advantage of single-radar vs. merged az shear jumped out right at the start of today’s simulation: lag time. The single radar product looks to have a 2-3 minute jump on the merged data with respect to low-level rotation, as shown in the time sequence below. The tightening/strengthening rotation couplet begins to jump off the screen in the single-radar data at the 2000 scan further intensifies through 2004. The area of strengthening low level rotation is much more muted in the merged data at 2000. It is more noticeable in the 2002 scan before becoming quite obvious by 2004. This small lag may not be significant, but it could be the difference of a  few minutes worth of lead time in warning decisions.
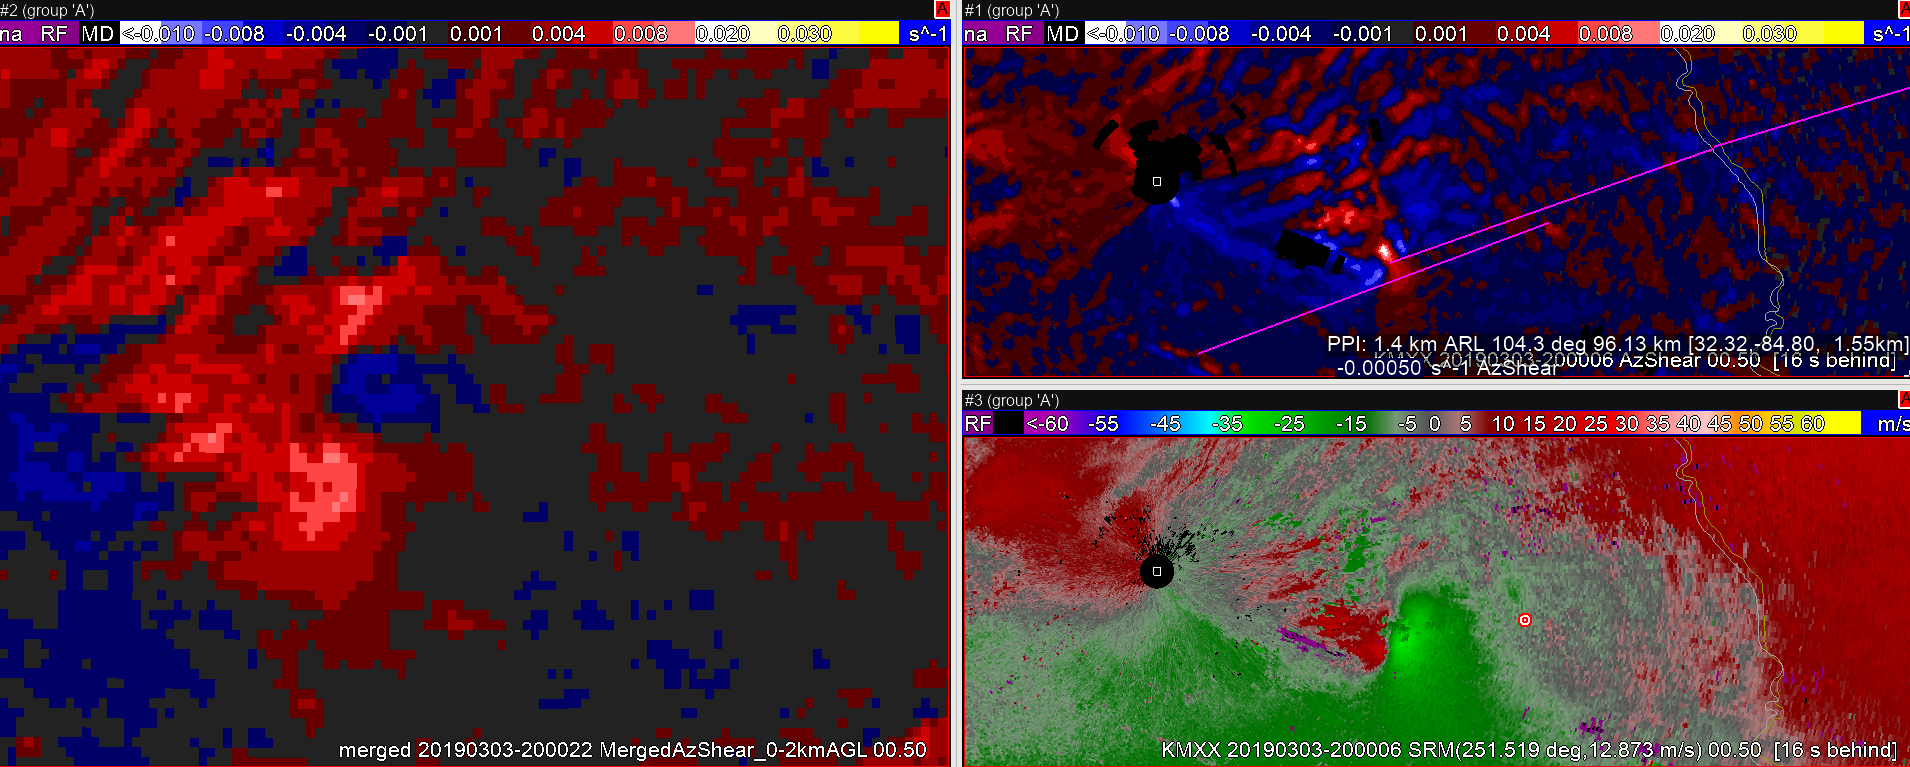
Dave Grohl

Single Radar AzShear Helpful in picking out strongest rotations

In going through the case of March 3, 2019, One if the useful items that stood out was the single radar AzShear Product. See the screenshot below.

Looking at the base velocity product in the upper right window, there are several circulations that can be seen. Similarly, the reflectivity image (lower right) shows several cells of potential interest. Fortunately, the AzShear product (left) highlights the cells you should investigate first by looking at the cells with the highest AzShear Values. This will be very helpful in decision making on the warning desk in a forecast office.

Thorcaster


ProbSevere Running Hot in SGF CWA

Looking at convection developing upstream across southern MO, I noticed prob severe had an object advertising 71% for TOR in the northern portion of the SGF  CWA (about a county and a half south of the CWA bondary. This particular cell does not show any rotation in the SGX base data, the Azimuthal shear doesn’t show much, and GLM lightning shows no electrical activity with this cell. I’m assuming the algorithm is keying more on environmental factors than anything else in coming up with this probability?

-64BoggsLites

AzShear – Great Additional Tool for Tornado Warning Issuance

The best storm of the day so far produced a tornado with a tornado debris signature. The AzShear signature was textbook with a concentrated persistent bullseye over the couplet (center of image below):

This AzShear product is a great tool to increase confidence in the presence of low-level rotation. It should be used with caution, however, owing to the risk of misleading signatures. The signal north of the Greer storm is a result of convergence and/or bad velocity data: 
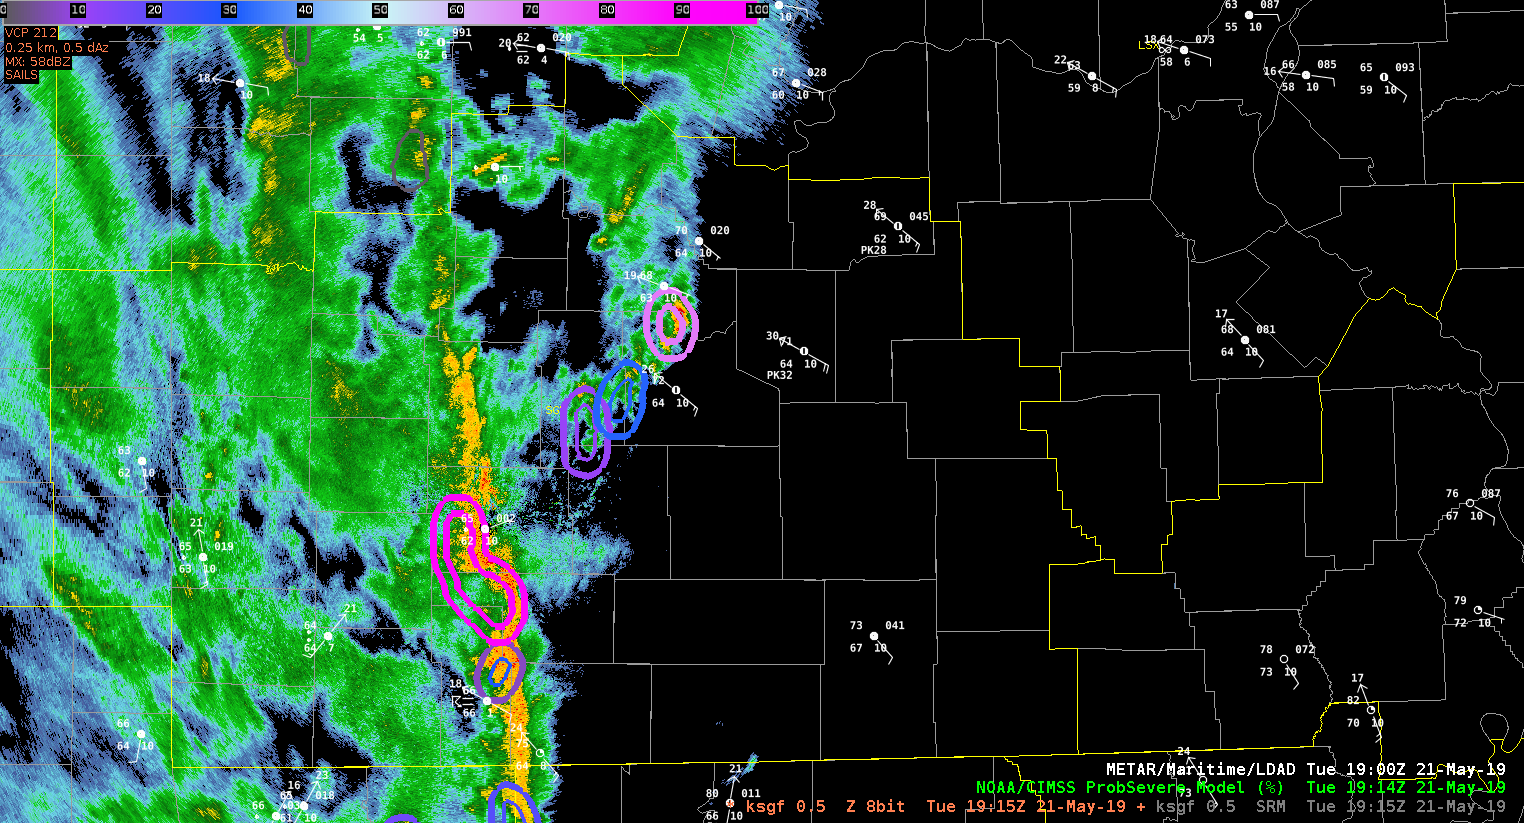
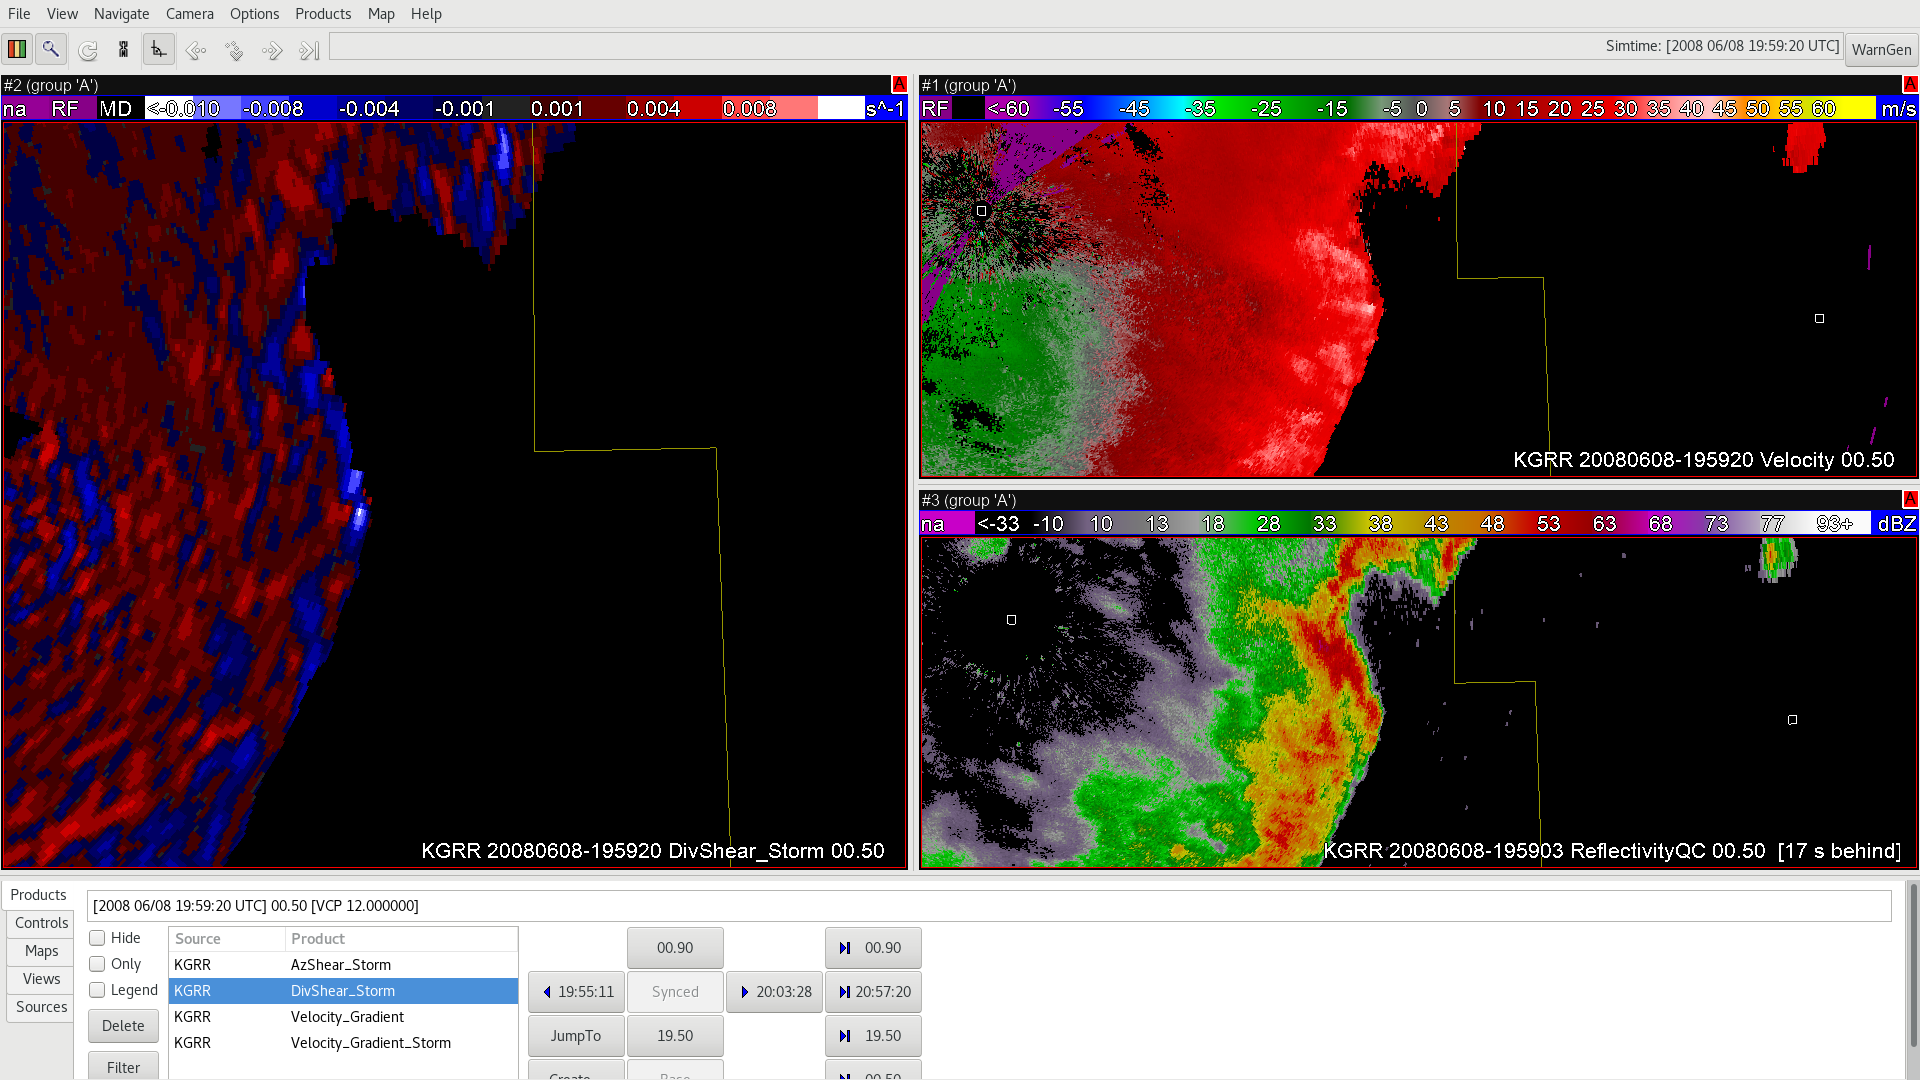
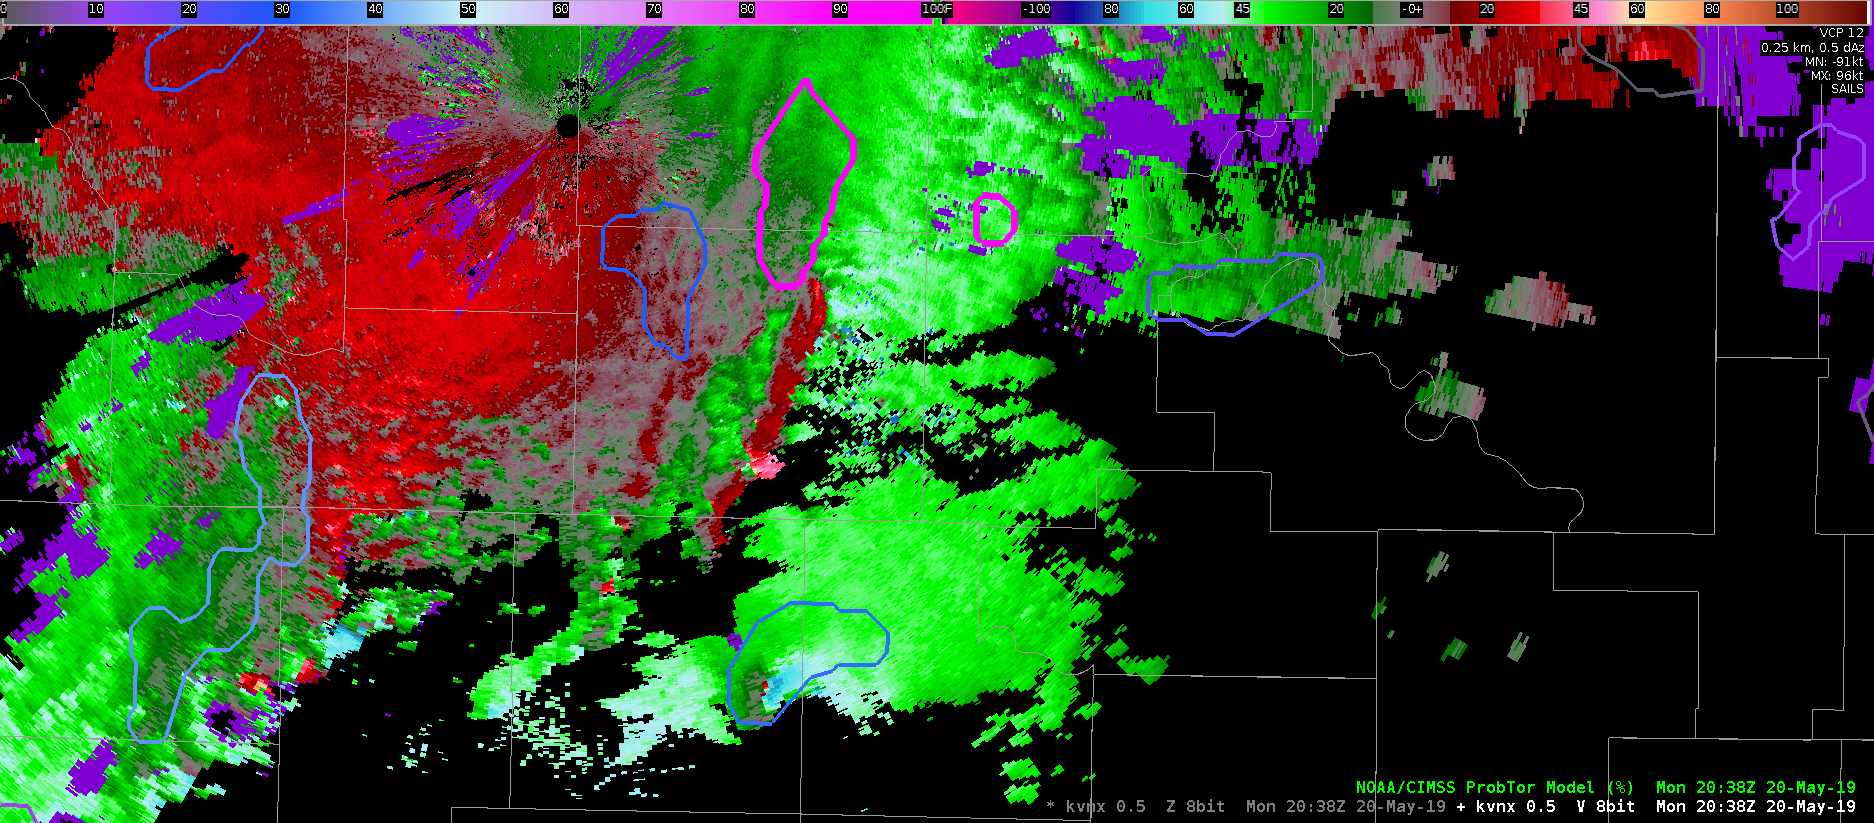
The reflectivity structure is more of a bow echo and the AzShear should be used with caution in identifying velocity couplets potentially associated with tornadoes. -Atlanta Braves

Lowest-Level Rotational Velocity Product Comparison

I’ve been trying really hard to come up with some useful observations regarding the three mesoscale detection algorithms, but struggling to come up with anything insightful. A loop all 3 algorithms (MDA top left, DMD top right, NMDA bottom left) is below. The three algorithms are overlayed on SRM and the bottom right panel is base V.

Two persistent mesoscyclones in Hall county are largely well-detected by all 3 algorithms with only minor differences is tracking. A relevant limitation for this storm is range from the radar (>65 nm) and interference from range folding. The New Mesocyclone Detection Algorithm (NMDA) is limited in its latency, making its real-time applicability limited. I rarely use the mesoscale detection algorithms operationally because I find the table difficult to read. It is easier for me to interrogate the radar data than to use the MDA or DMD. Perhaps reformatting the data display would help make the NMDA more usable.

On the contrary, the AzShear product performed remarkably well on this particular cell. It is more visually obvious and helps focus forecaster attention in a very simple way. The loop is below:

For the purpose of identifying low-level rotation, AzShear does a much better job than any of the mesocyclone detection algorithms with respect to low-level rotational velocity. The mesocyclone detection algorithms do not add much value to my warning decision process. -Atlanta Braves

Azimuthal Shear and Lightning Trends Prior to Tornado

Pair of supercells exhibited intensification as they tracked northeast through the eastern Panhandle of Texas. MRMS azimuthal shear ramps up to slightly over 0.010 S-1 near time of a reported tornado from the more eastern of the two supercells. The GLM event density data also increases prior to or near the time of  the tornado between 1950z – 2000z (upper right panel). Comparing to the ENTLN lighting flash frequency (1min data), an jump was noted peaking 1947Z before it dropped off and remained lower through 2000Z (36 count to 15 count). To summarize this data, there was a jump 10-15 min before the tornado, then a drop off, and then another jump 10-15 min after the tornado.

0.5 storm-relative velocity couplet was strongest with the eastern of the two primary mesocyclones. Spectrum width (low right panel) displays a consistently strong signal of wind speed variance with the eastern tornado producing mesocyclone.

The tornado component of Probsevere jumped significantly before the tornado touchdown. At 1944Z the probability was at 7%, then quickly increased to 46% by 1948Z and peaked at 54% at 1952Z.

-Roy

The good and bad of Prob Tor/AzShear/Meso Detection Algorithms

The image below looks at 2 cells in central Oklahoma. The northern cell has a prob tor of 77%, but is falsely lightning up a shear zone with little chance of a tornado. The southern cell shows all the characteristics of a tornadic supercell, but has a prob tor of 37%. However, the southern cell is closer to producing a tornado (via live media).

Here’s another image using KVNX instead of KTLX, and shows only the prob tor.

The two cells to the north have 90 and 91 percent, respectively, while the southern supercell has only 33 percent.

Not to pick on the prob severe product, the meso detection algorithms a similarly struggling. Below is a 4-panel showing the legacy mesocyclone alogrithm (upper left), the digital mesocylone algorithm (upper right), the low level AzShear (lower left), and the experimental meso algorithm (lower right).

All three detection algorithms are flagging the circulations as equally important, but an examination of the base data shows otherwise.

Thorcaster

Bad Velocity Data Trips Alogrithms

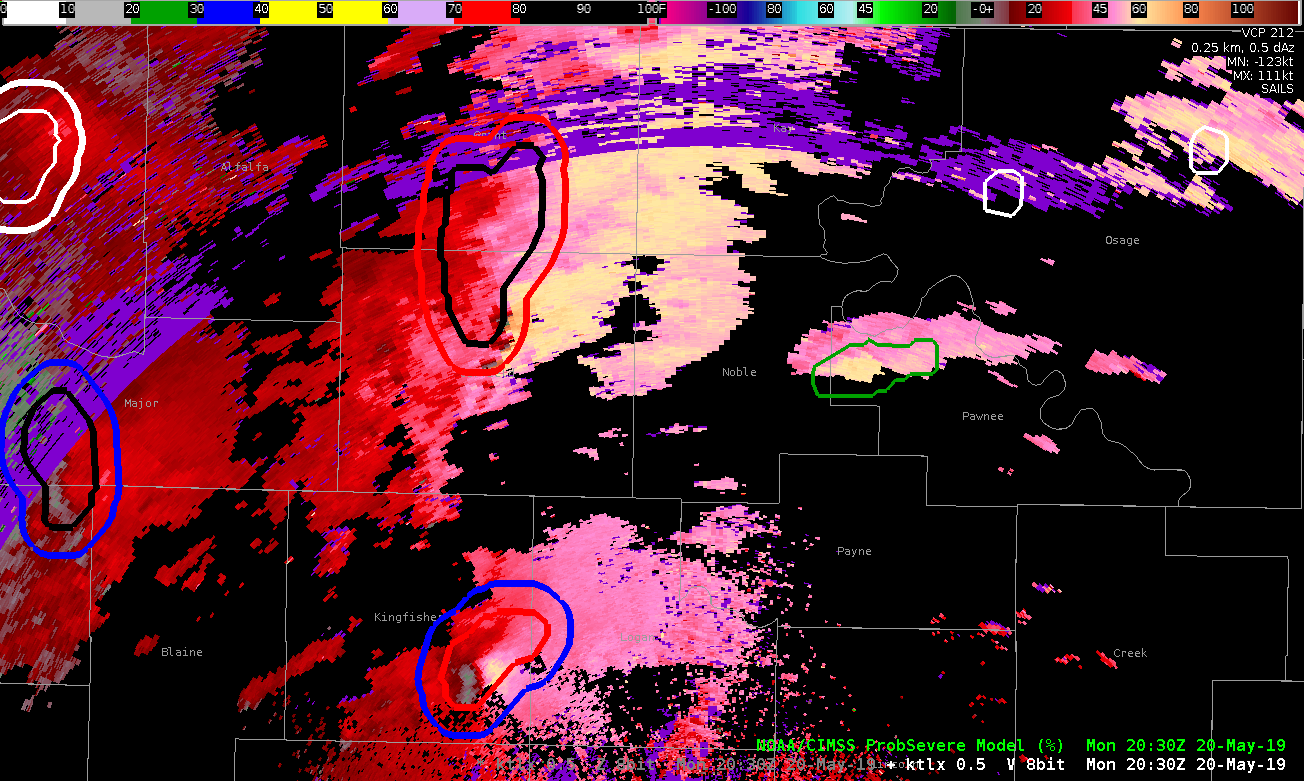
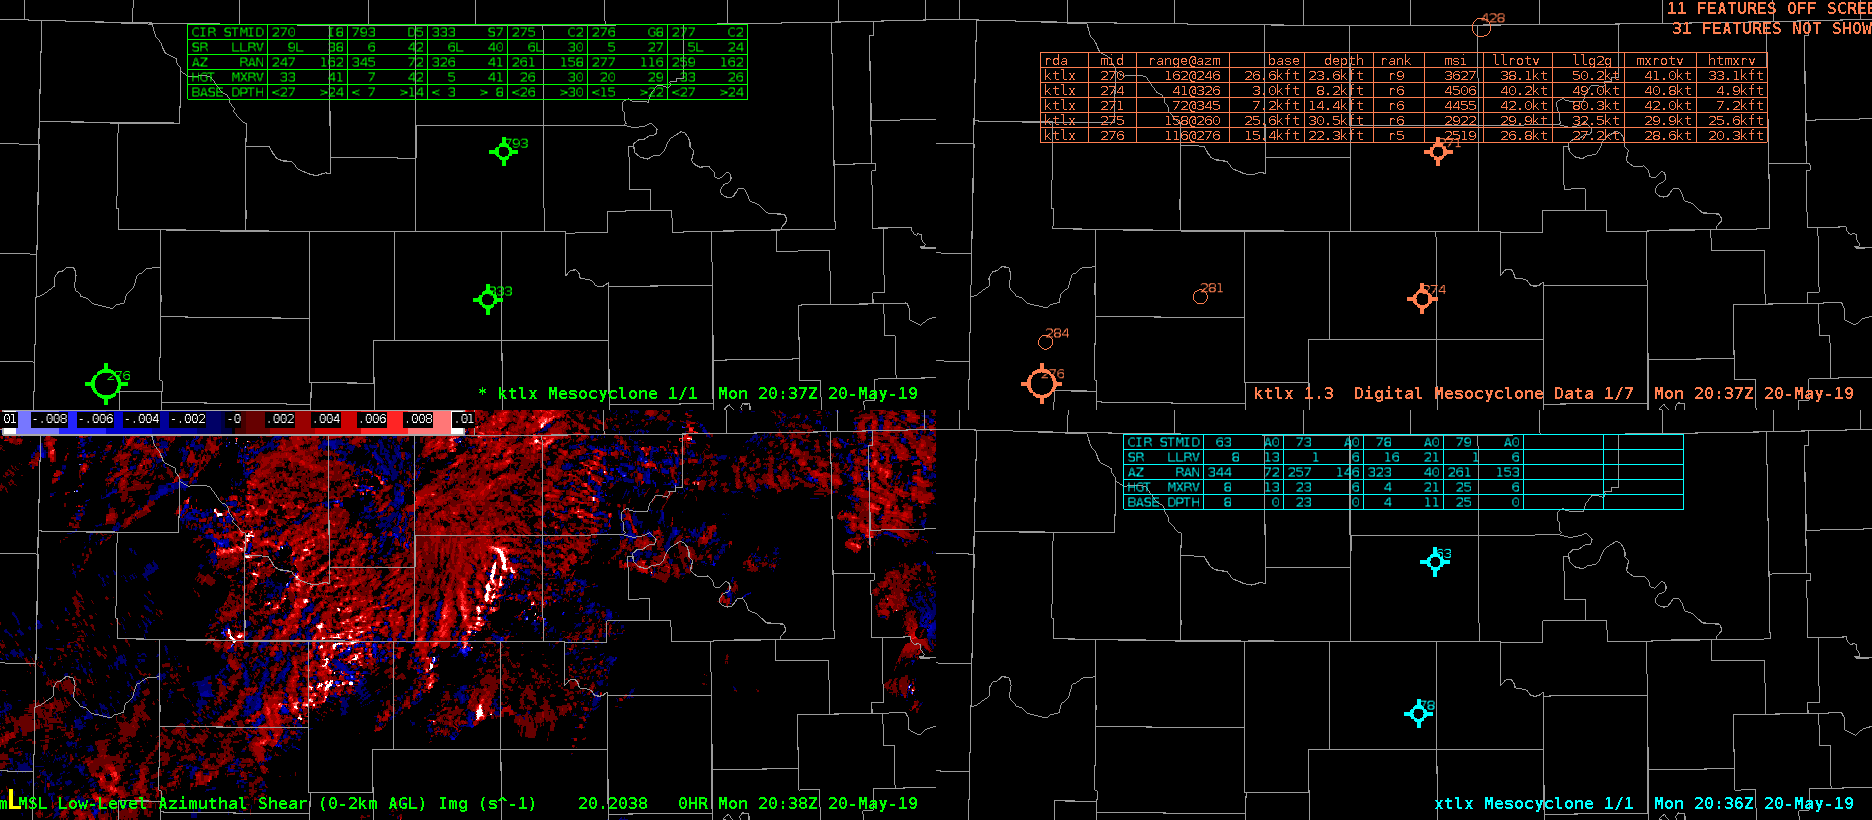
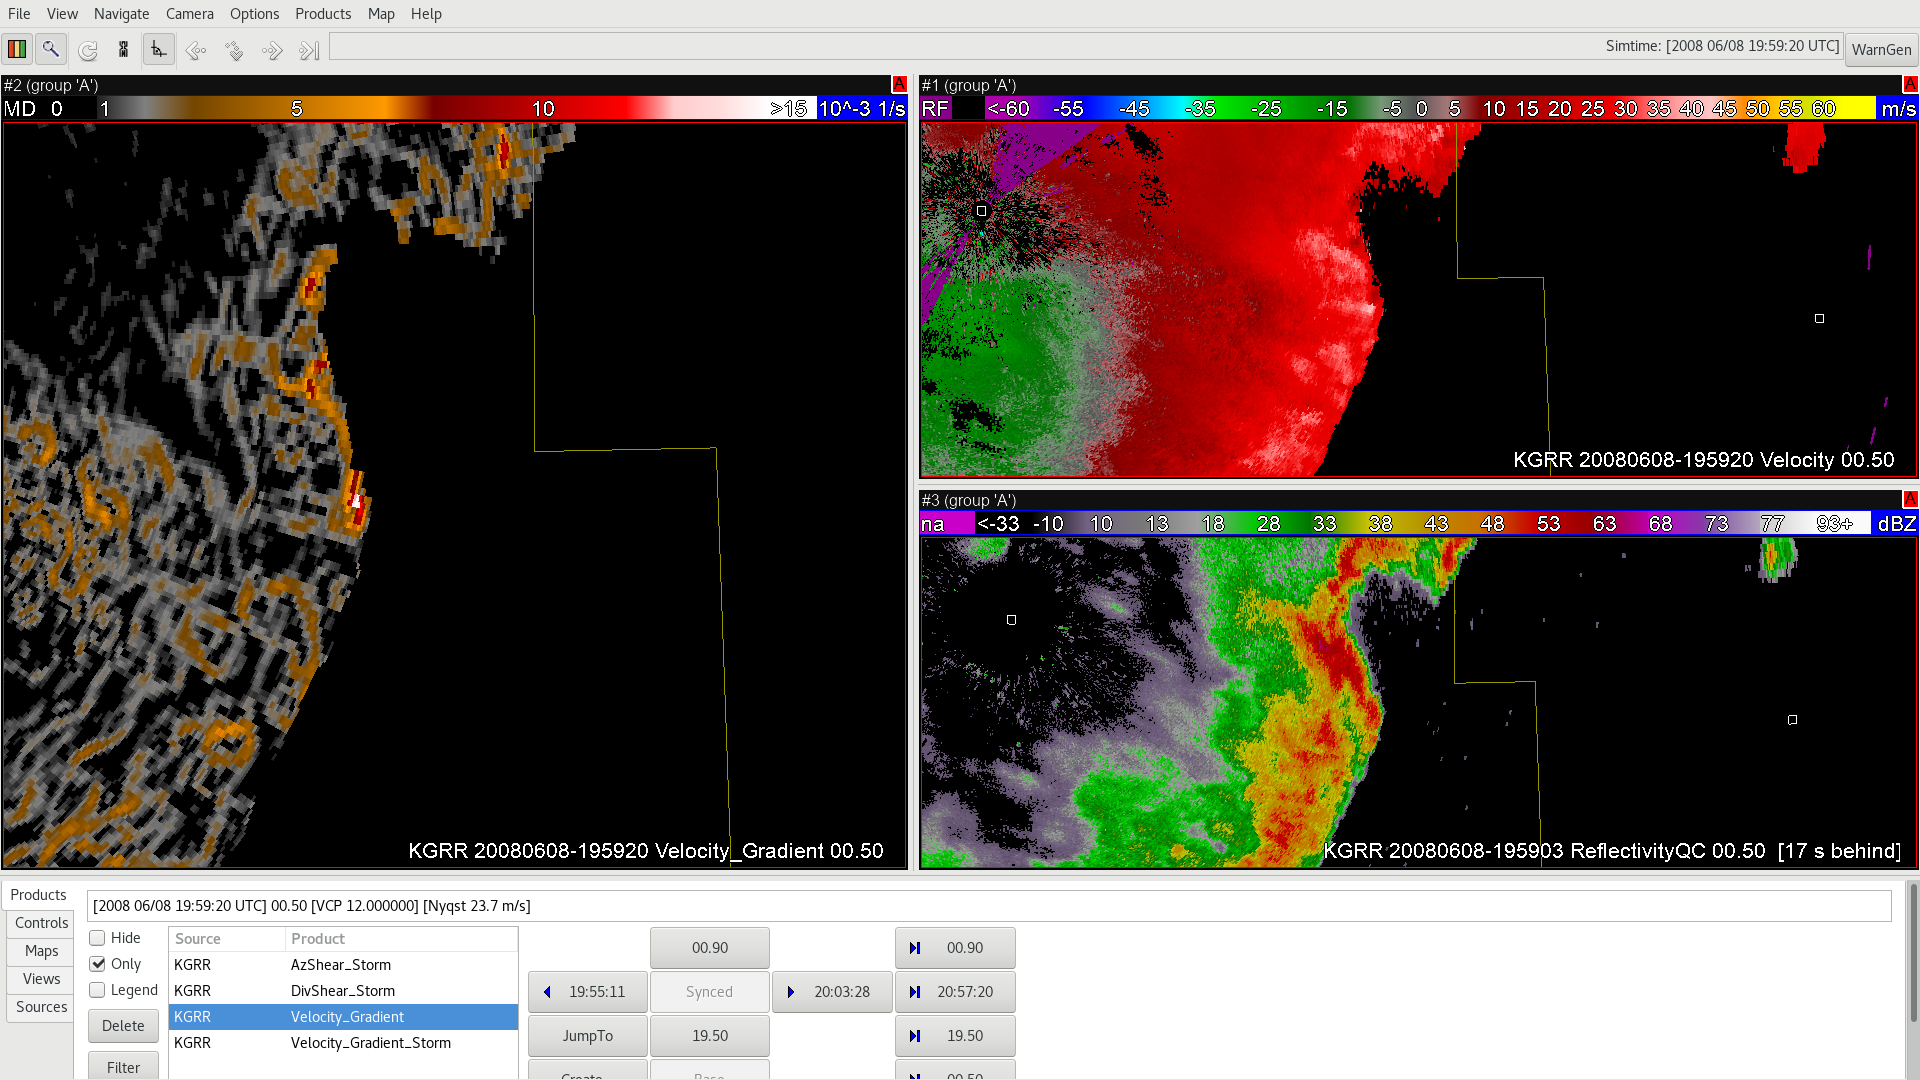
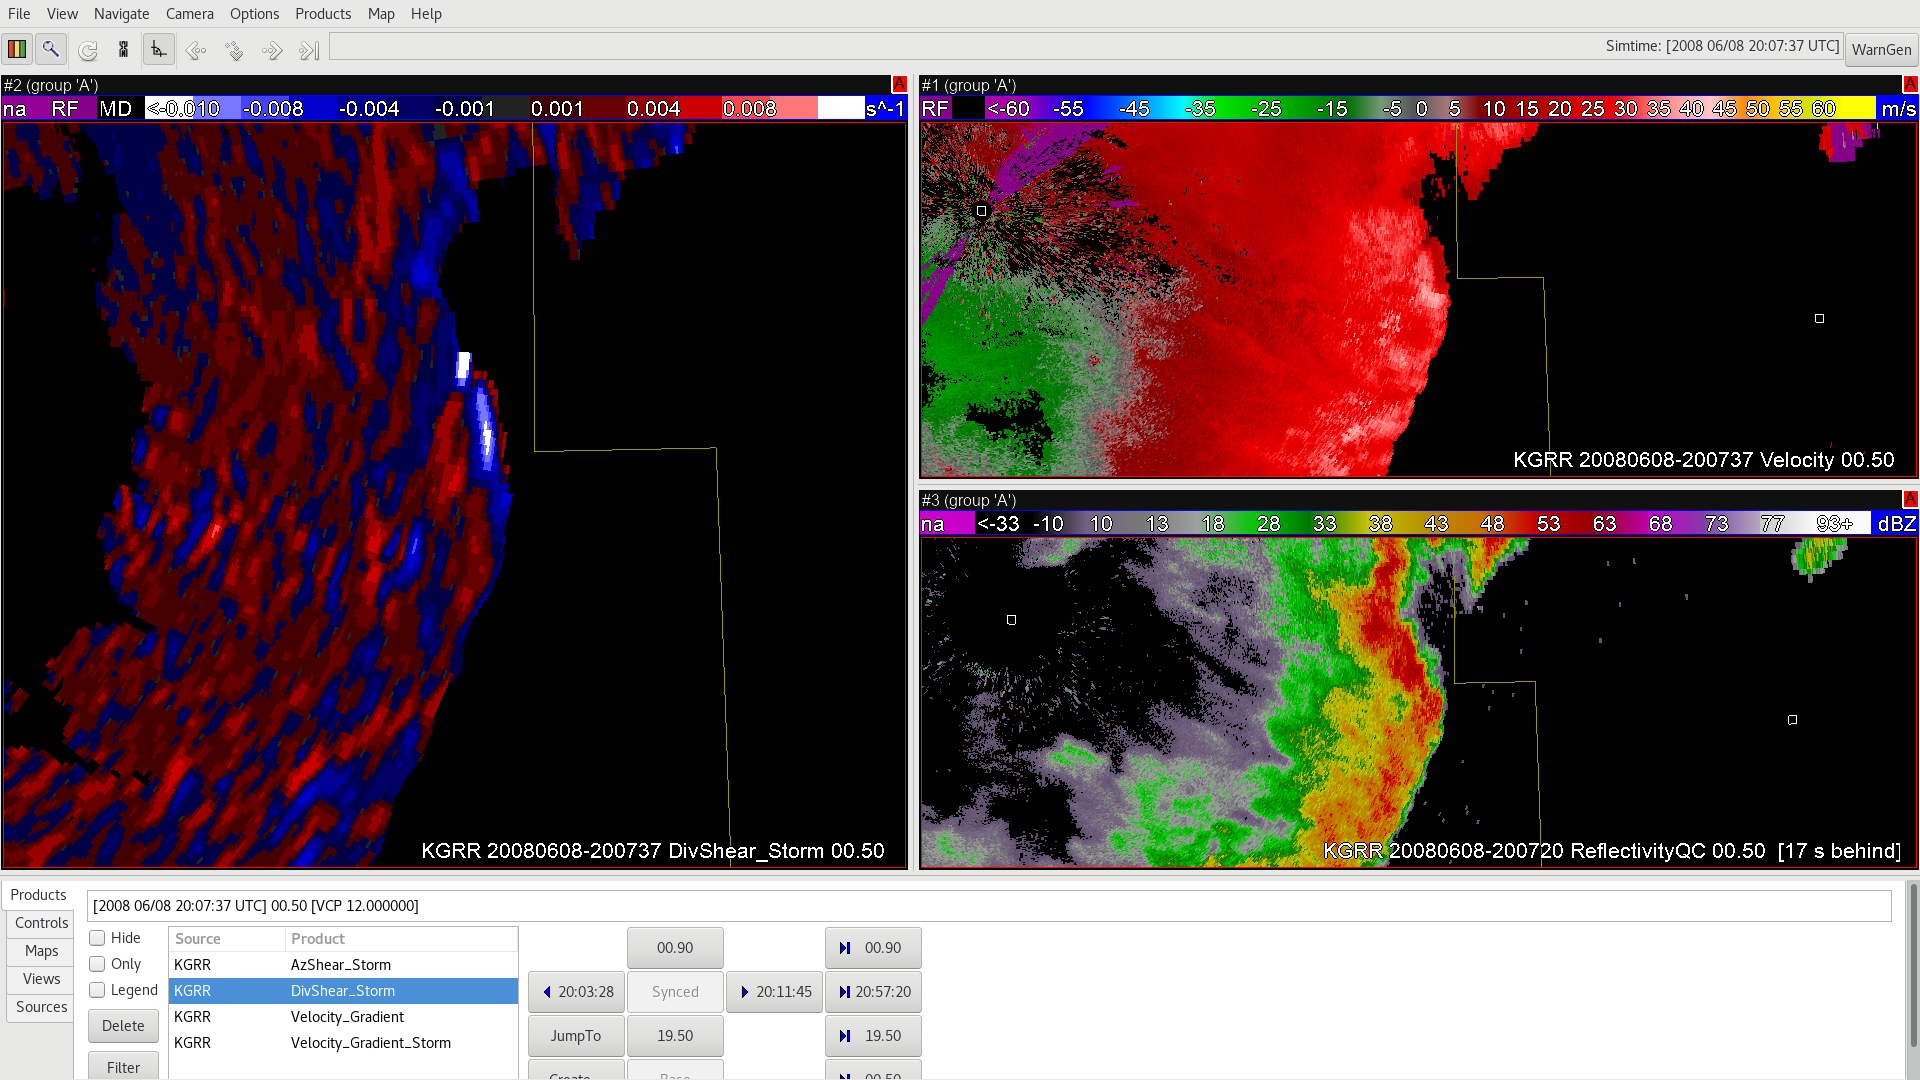
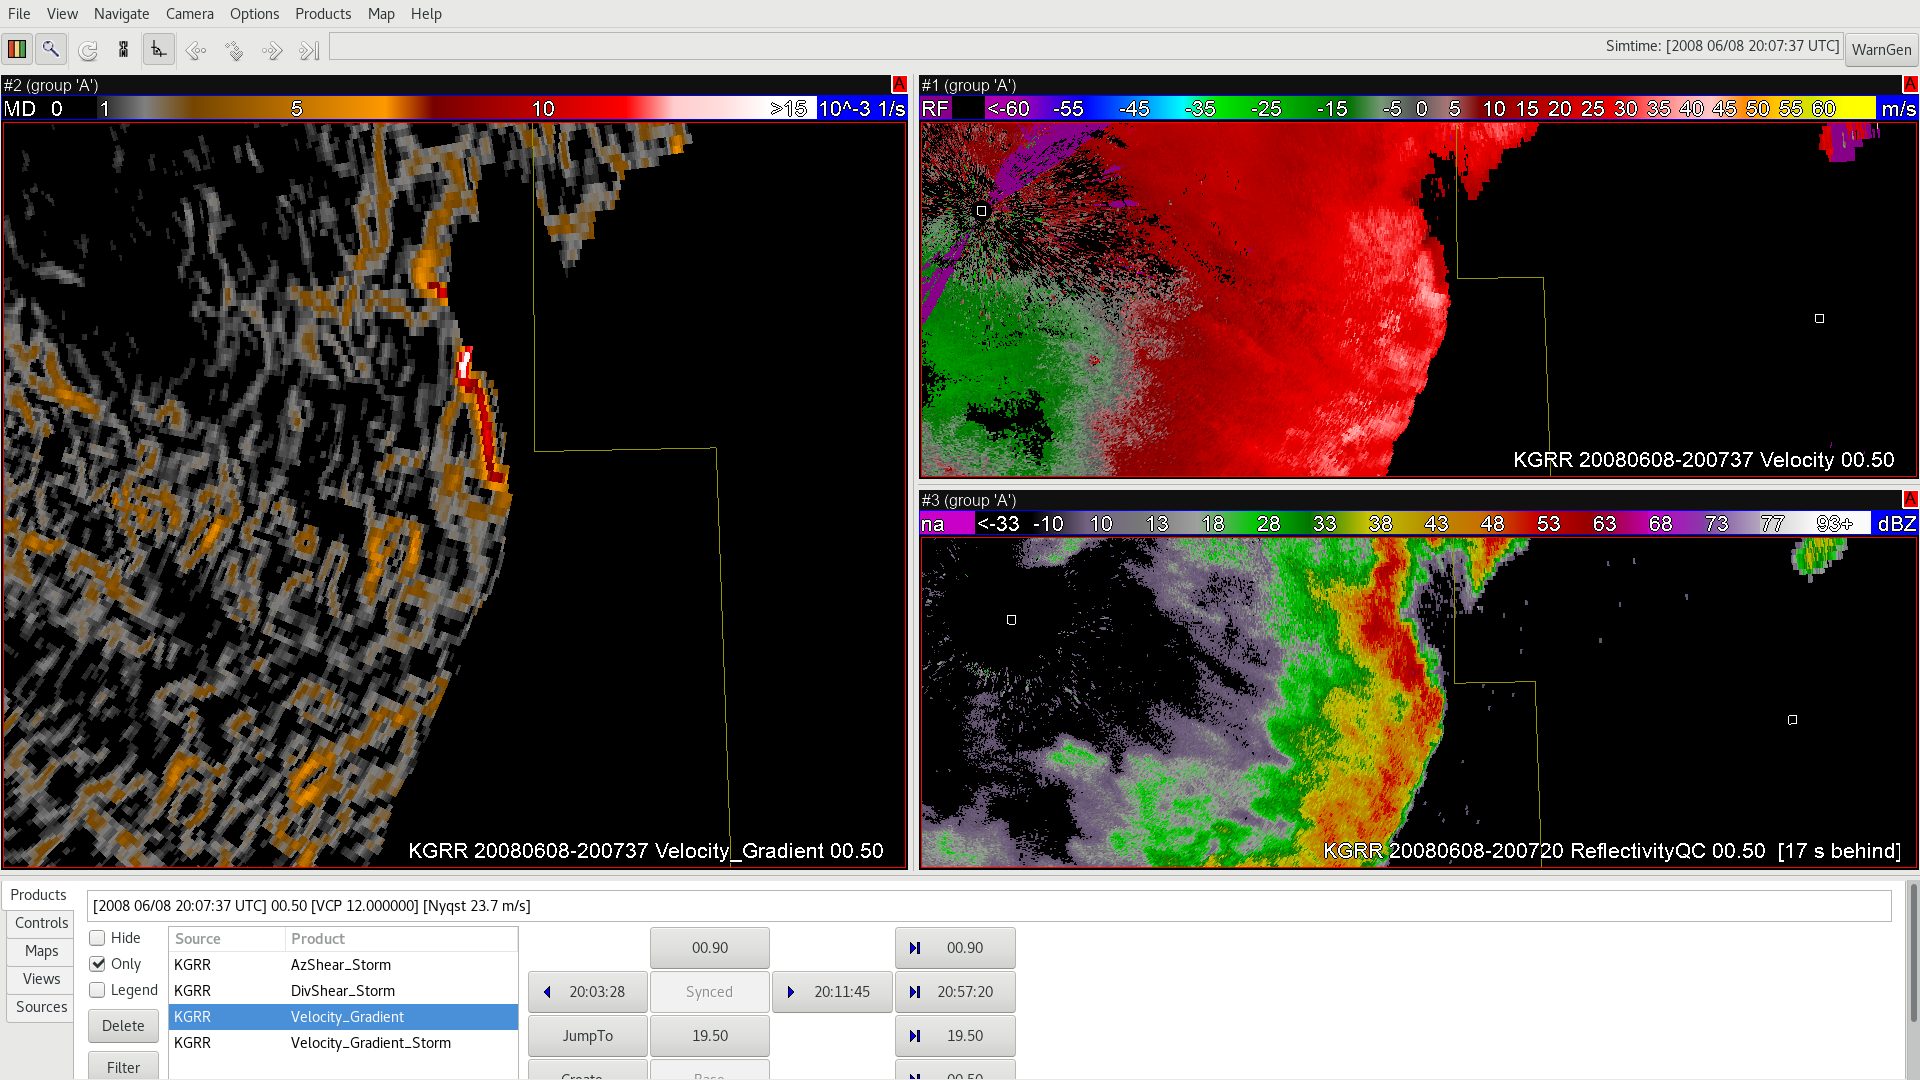
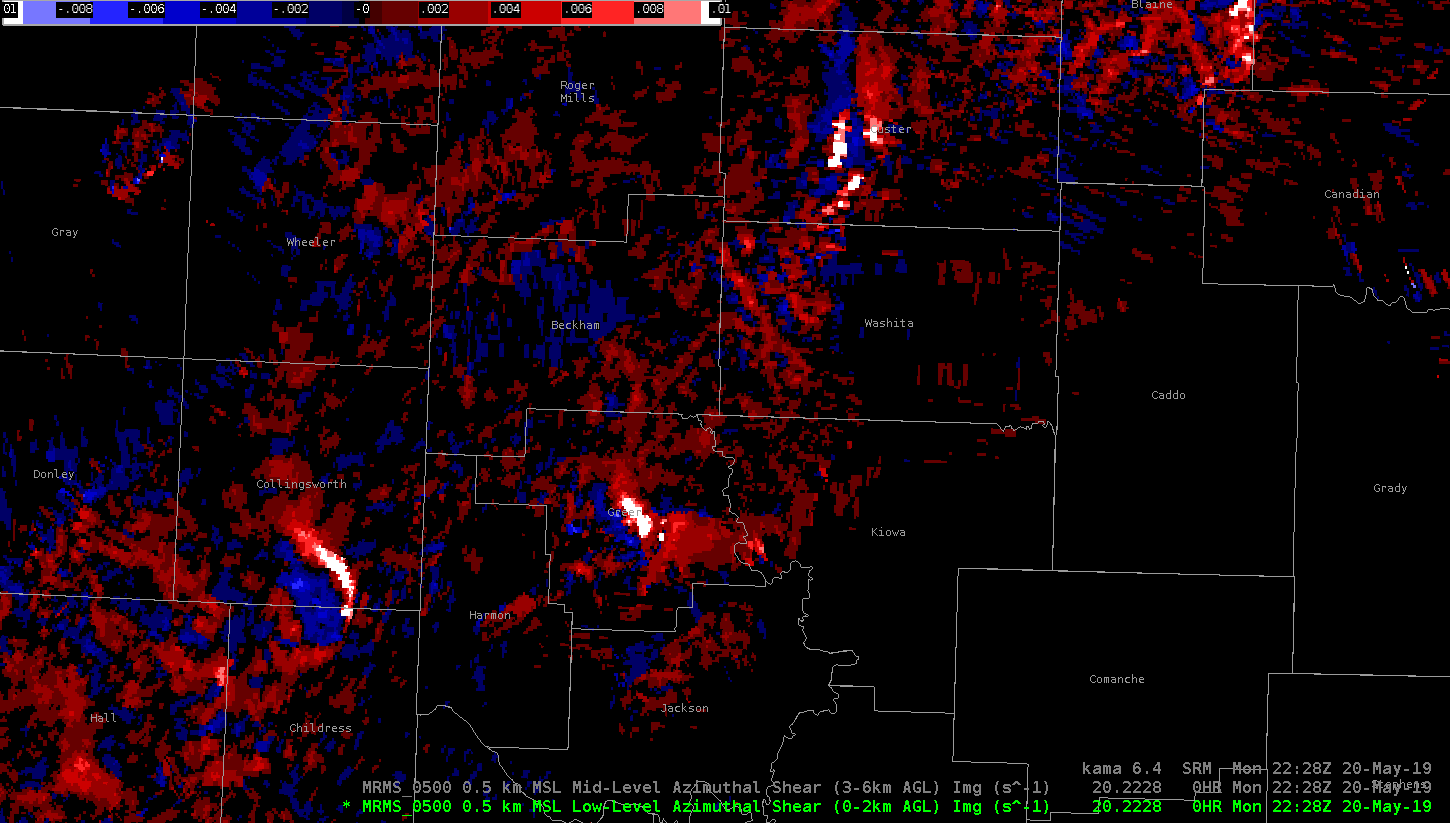
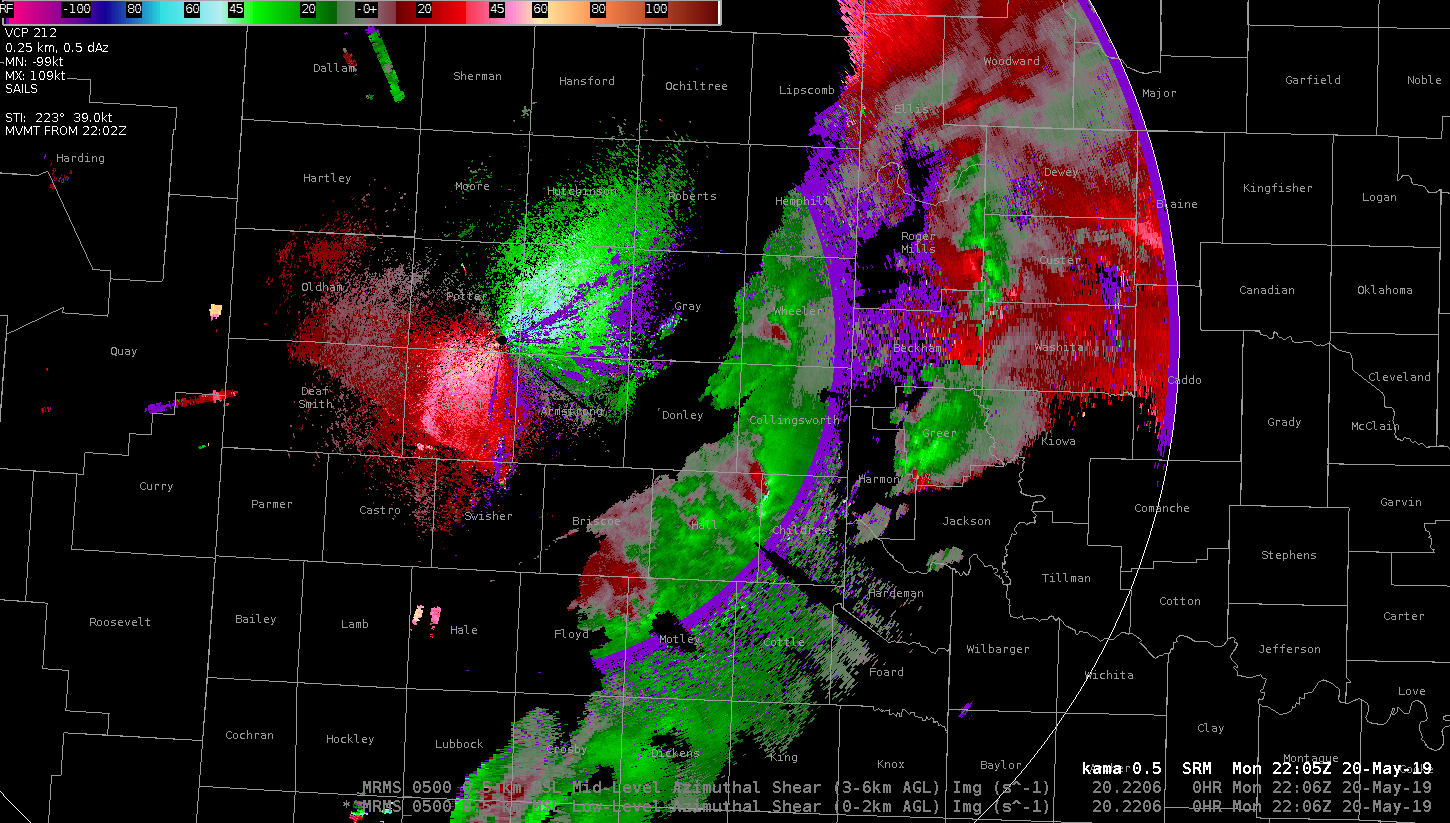
Just after 20z on the eastern fringe of the LUB CWA, the KFDR radar indicated an area of very high inbound velocity. However, this data is in question as the elevated velocity occurred in an area of low Z and high SW, and likely not representative of the actual storm. This may have been caused by a side lobe. This had cascading affects with algorithms being tested which could not filter out the bad data. Low level az shear spiked to over 0.01 in a group of stationary pixels. This caused algorithms that ingest the az shear product to spike including ProbTor which increased to over 90%, as well as CPTI which showed lower end probabilities of a violent tornado in progress.

Dave Grohl

Div Shear and Velocity Gradient associated with a damaging QLCS mesovortex

All righty, now let’s take a look at a maturing QLCS mesovortex, starting with AzShear…

At the apex of the bow we see a bit of an AzShear couplet (maximum at the apex with a weaker “blue” minimum just to the south). Comparing this to DivShear…

Hmm, certainly some blue negative divergence (i.e., convergence) there too. Now putting them together into Velocity Gradient…

…things really really start to pop. At this point, it appears that the azimuthal shear is a bit more of a contributor than DivShear. Now looking later when the mesovortex is shifting away from the apex, starting with AzShear, we see a much less focused area…

However, DivShear has really taken up the slack here with a strong convergence signature…

Finally, again putting it all together, we see a very clear signal in the Velocity Gradient showing the best superposition of cyclonic shear and convergence (white area). This is absolutely huge for diagnosing mesovortex evolution since we often see a shifting balance between convergence and azimuthal shear and we can use something like Velocity Potential to get it all at once.

I really appreciate the efforts of Thea and others here who made this dataset available on such short notice. They also showed some examples of these products with tornadic supercells that blew my mind.

#MarfaFront