Velocity Gradient – A product that is even cooler than it sounds

What’s even better than AzShear?

AzShear + DivShear = Velocity Gradient

Below is a look at AzShear down low with an approaching QLCS. Fairly noisy right?

Here is another view using DivShear – in other words, divergence along a radial similar to how shear is computed across radials. The convergence (i.e., negative divergence) shows up nicely, eh?

Now combining those fields together with Velocity Gradient, things really start to jump.

Look how well DivShear works with MARCs , too:

Certainly better than AzShear when it comes to mid-level convergence…

And then putting them together for Velocity Gradient…


Now, closer to the QLCS “summit”, we see fairly coherent DivShear…

And this is how Velocity Gradient shows it.

Hoping to show some extremely cool results with these fields involving a QLCS mesovortex later in this case if time permits…

#MarfaFront

Vertical Data Smearing – the bane of AzShear’s existence

All right, maybe that’s a bit over-dramatic, but at least I got you still reading. I’ve discussed elsewhere the sensitivity we’ve seen with low level AzShear and Rotation Tracks when it comes to surface features such as outflow boundaries or artifacts such ground clutter. Here we see sensitivity to what’s going on above – i.e., velocity data with a high reflectivity mesocyclone aloft being smeared downward with sidelobe contamination. To illustrate…

KIND 3.1 degree Z
KIND 3.1 degree V
KIND 0.5 degree Z
KIND 0.5 degree V

So, it’s fairly evident that velocity is being contaminated down low. Unfortunately, this also affects the AzShear calculations…

Just something else to be aware of…

#MarfaFront

AzShear: The Good and the Bad

Low Level AzShear (0-2km) correctly identified an area of rotation associated with the western supercell, however, AzShear was also saturated above 0.01 along the leading edge of the bow echo in the MCS as well. While it’s good to drawn attention to the latter area, as it was producing severe wind (61kts), it was not tornadic.  Additionally, there is some noise in the merged LL AzShear that wouldn’t exist in the single radar AzShear. I believe single radar AzShear would perform better in this situation.

Clockwise from Top Left: KIND 0.5 Ref, 0.5 SRM, 0.5 Vel, Low Level Az Shear (0-2km)

-Tempest Sooner

My AzShear Manifesto

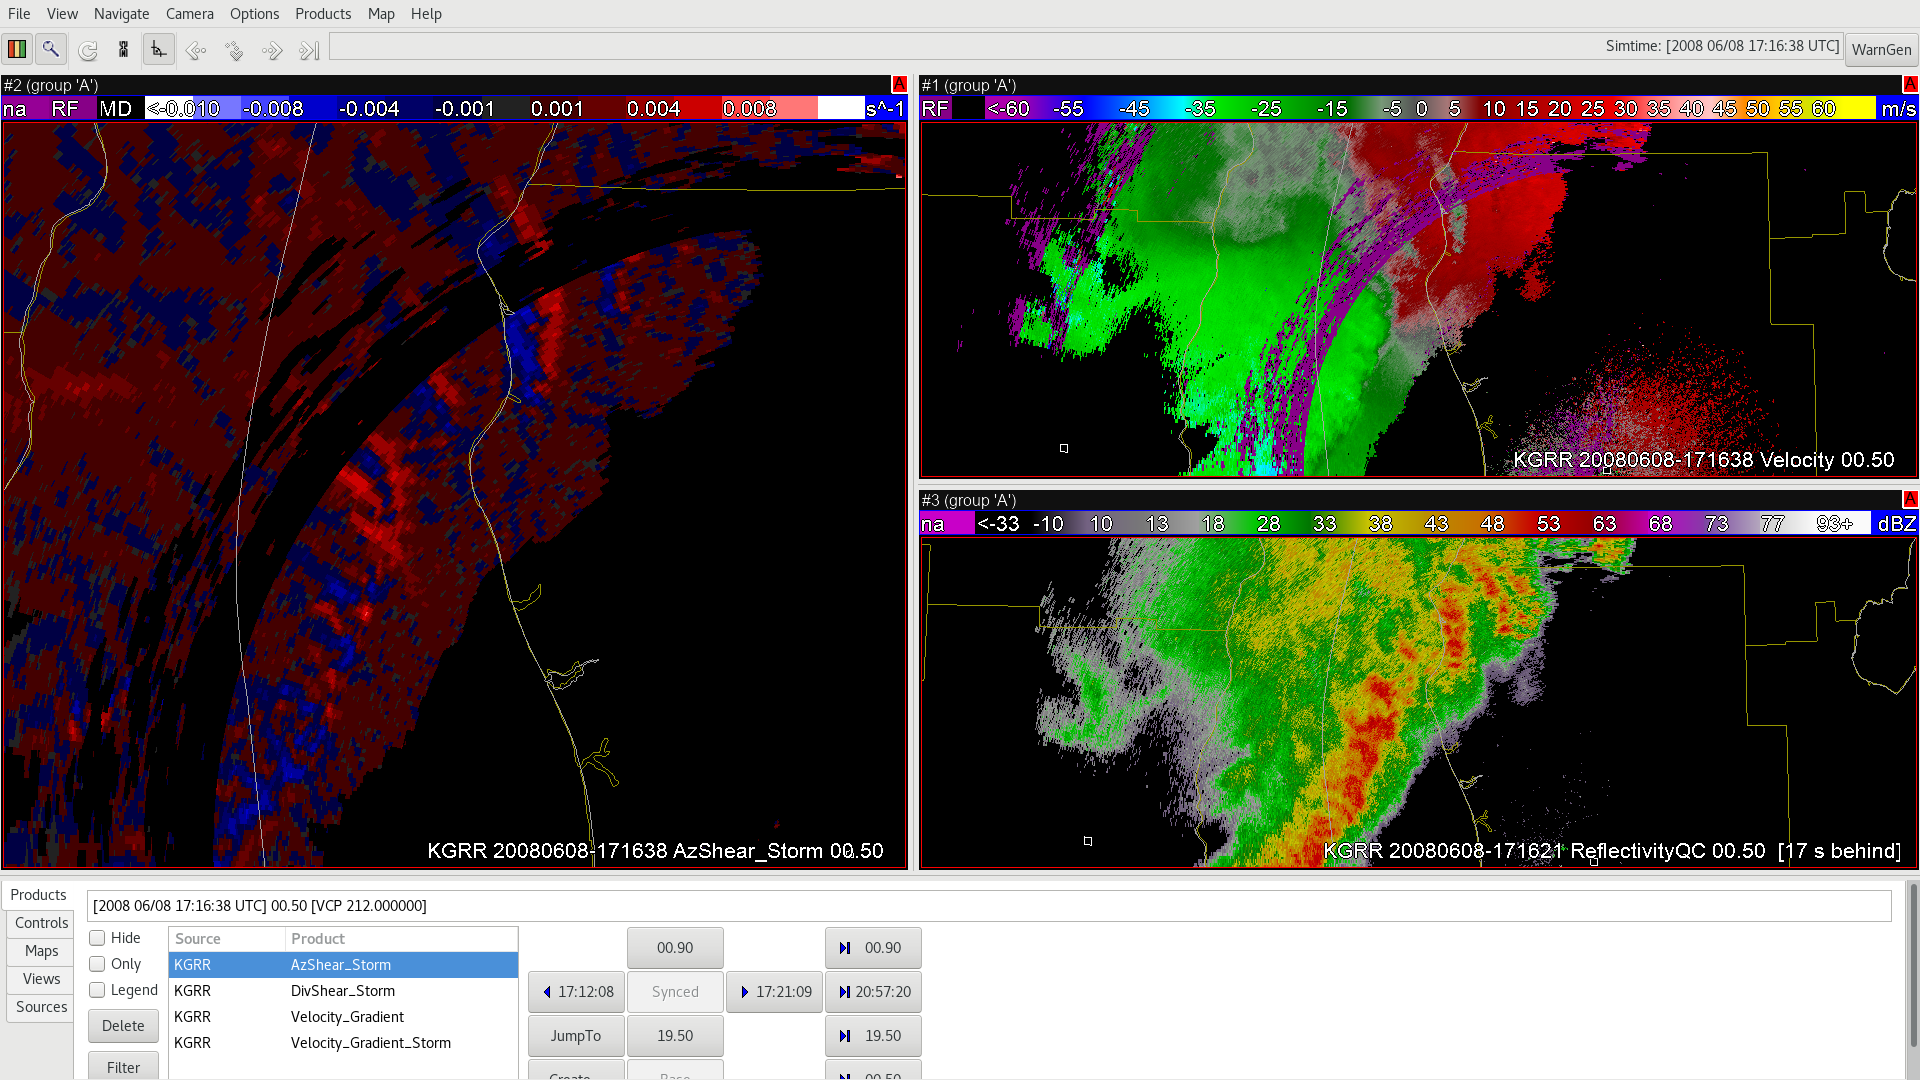
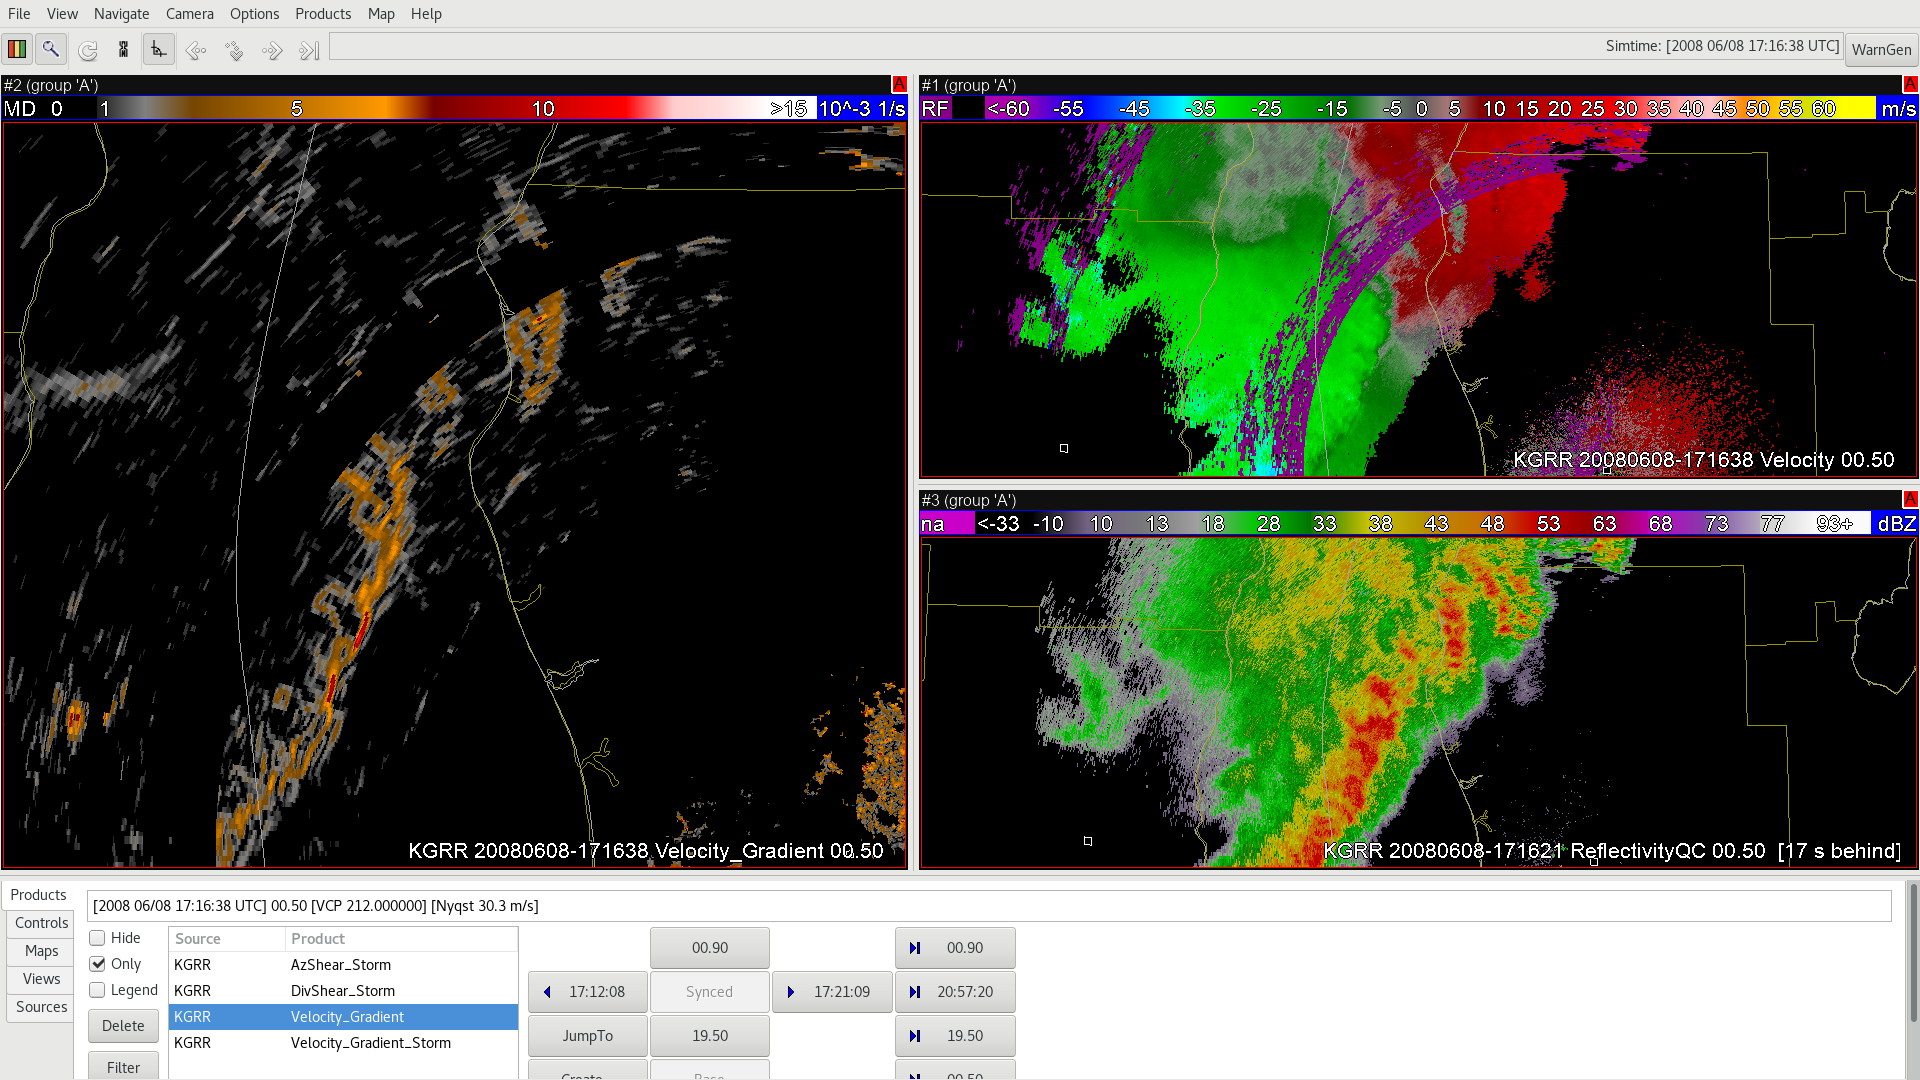
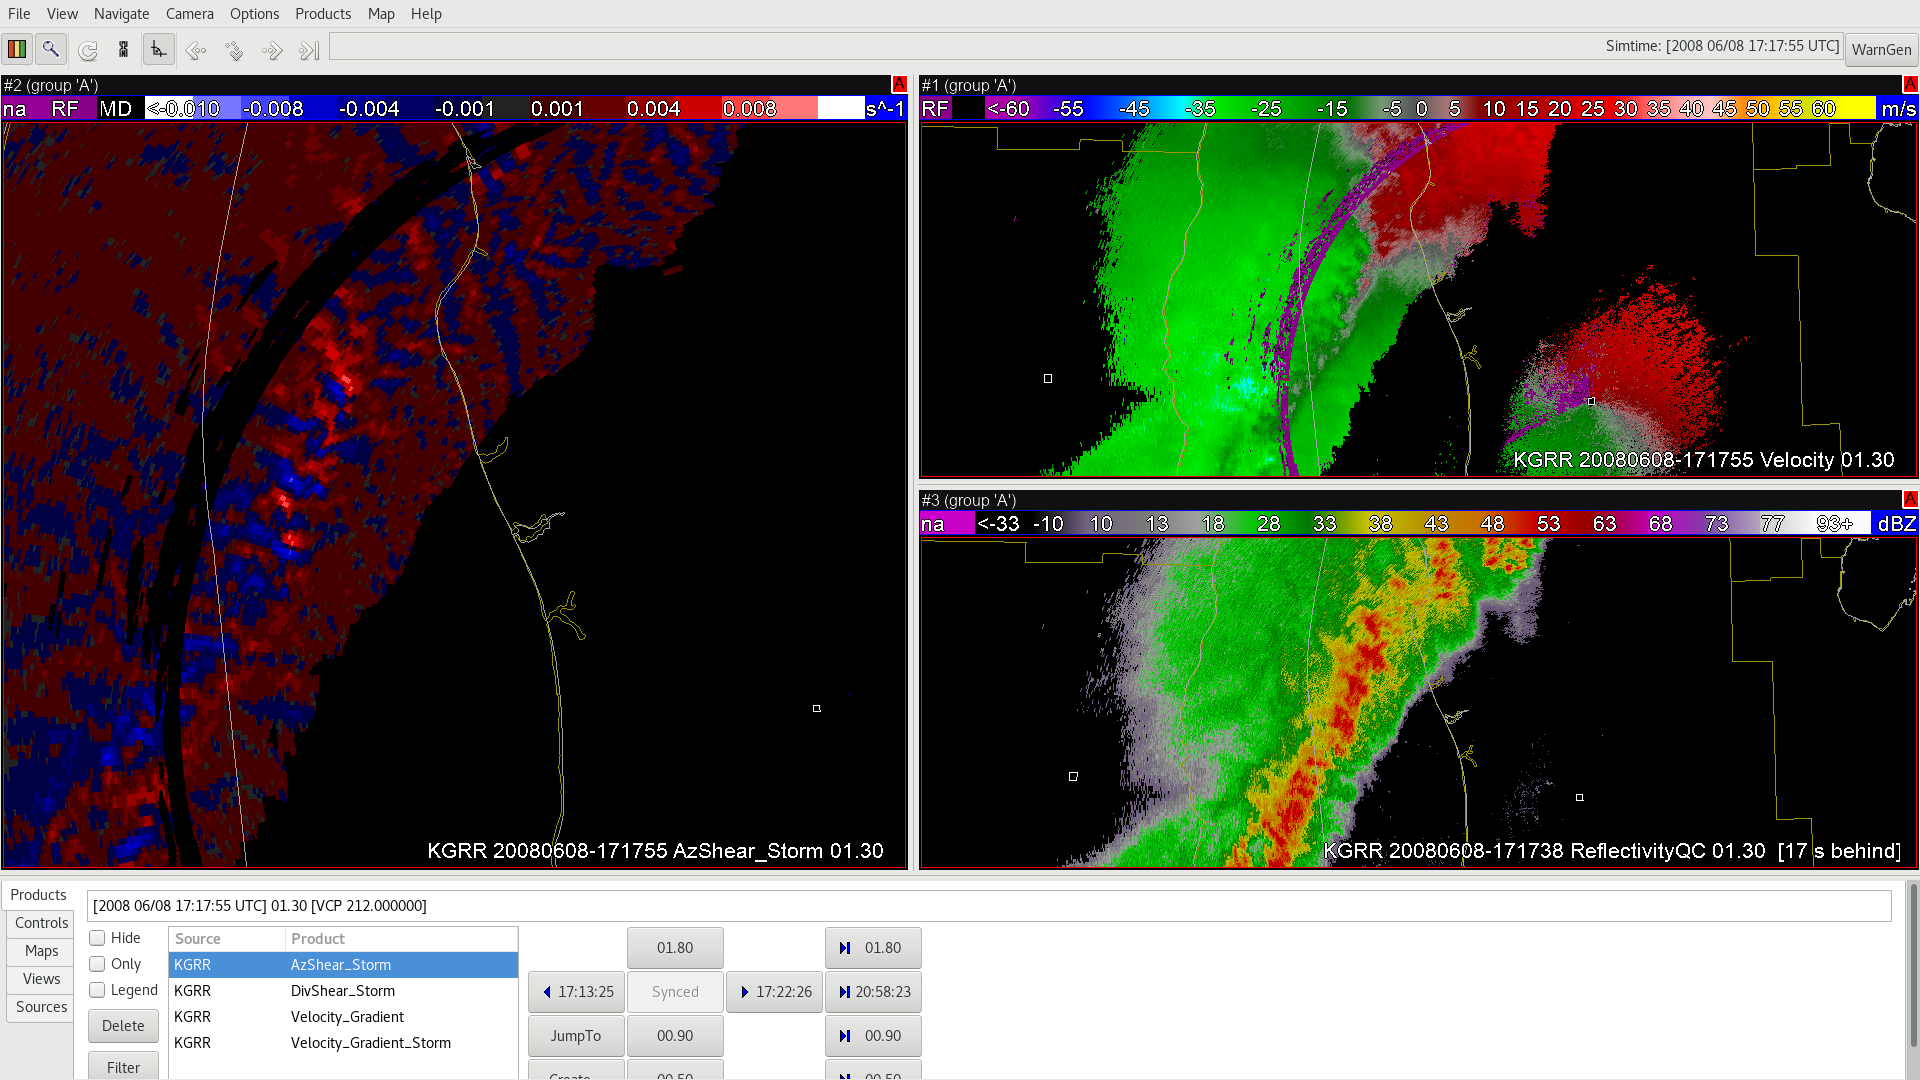
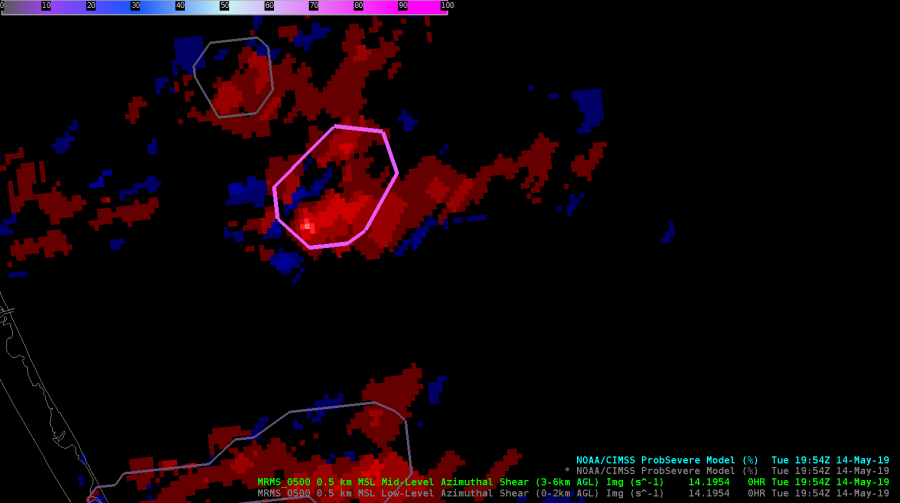
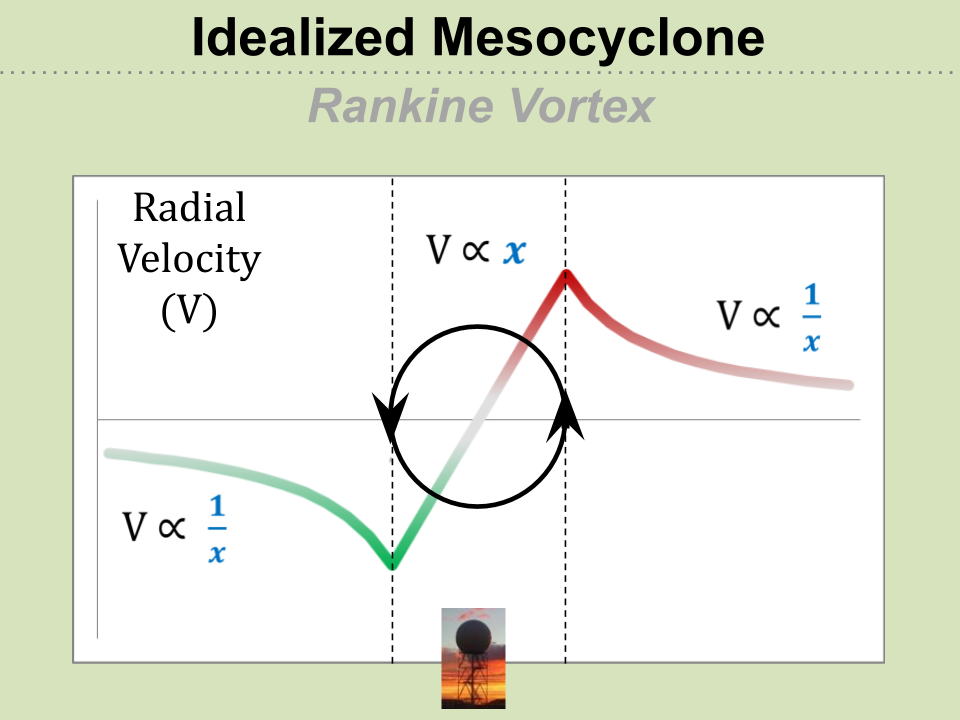
Those of us who use GR2Analyst already have access to AzShear via its NROT product. I stated elsewhere that the negative values are important, and here I’ll attempt to explain why.  Below is a schematic of a Rankine vortex, which is akin to a rotating cylinder. Radial velocities are maximized at the edge of the cylinder and then drop off as an inverse  function  of range.

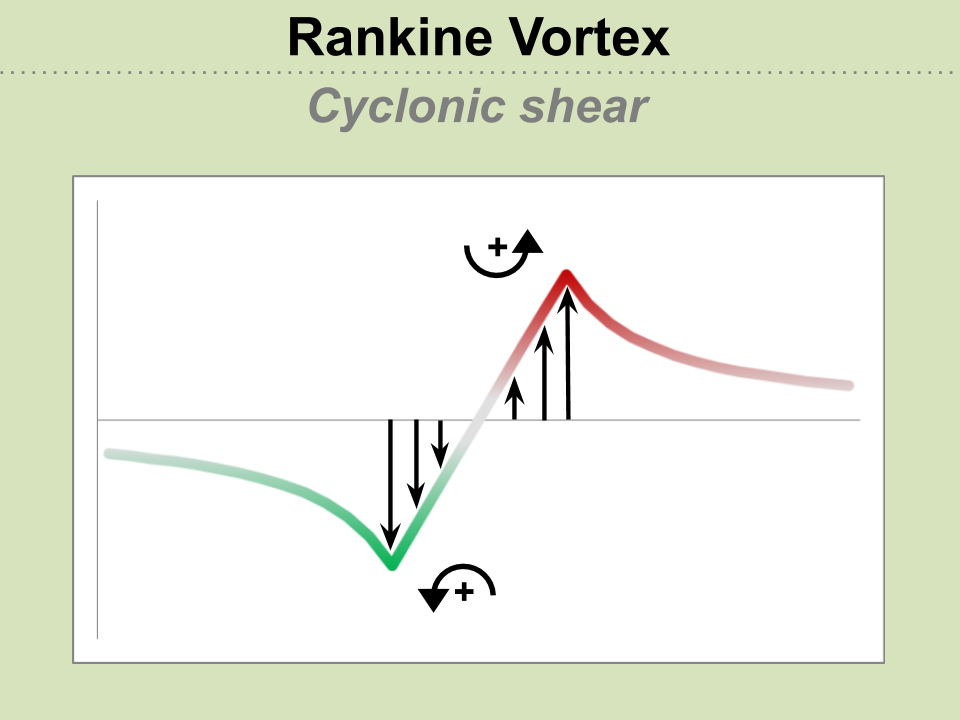
We know azimuthal shear is positive across the entire “cylinder”….

What about just outside the cylinder? If you look closely, you’ll see that there are *negative* AzShear regions on the radials that are just outside of the max/min radial velocities positions…

Putting it all together and thinking of azimuthal shear as a running average of shear as we move across the radials, we get a plot of AzShear that looks something like the black trace below.

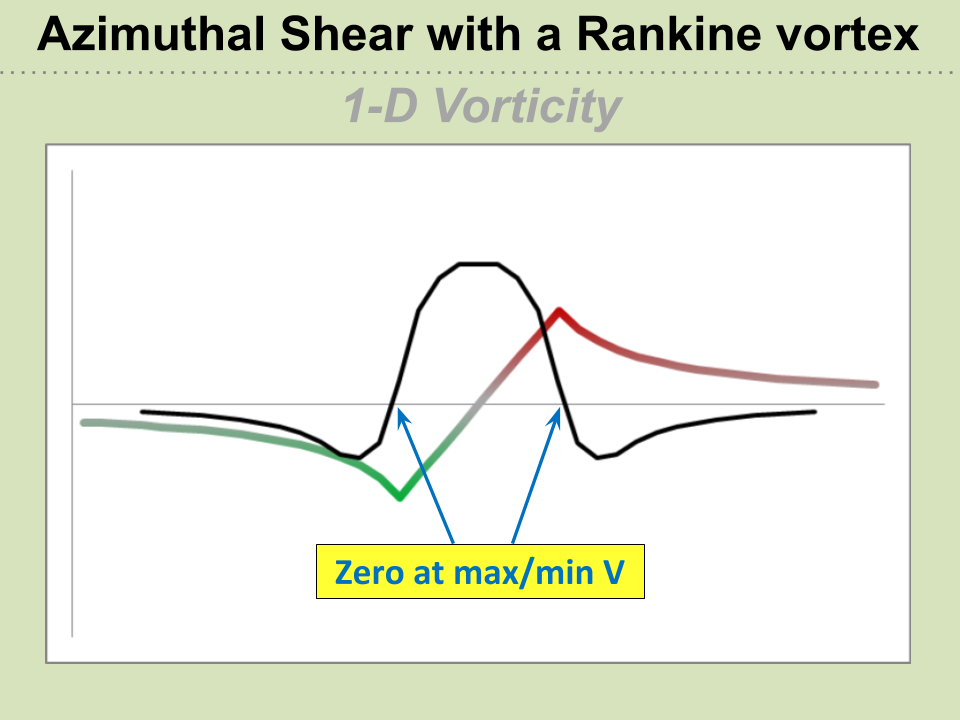
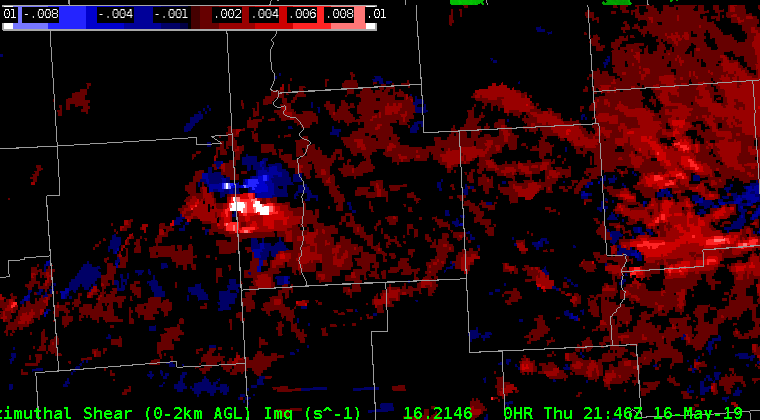
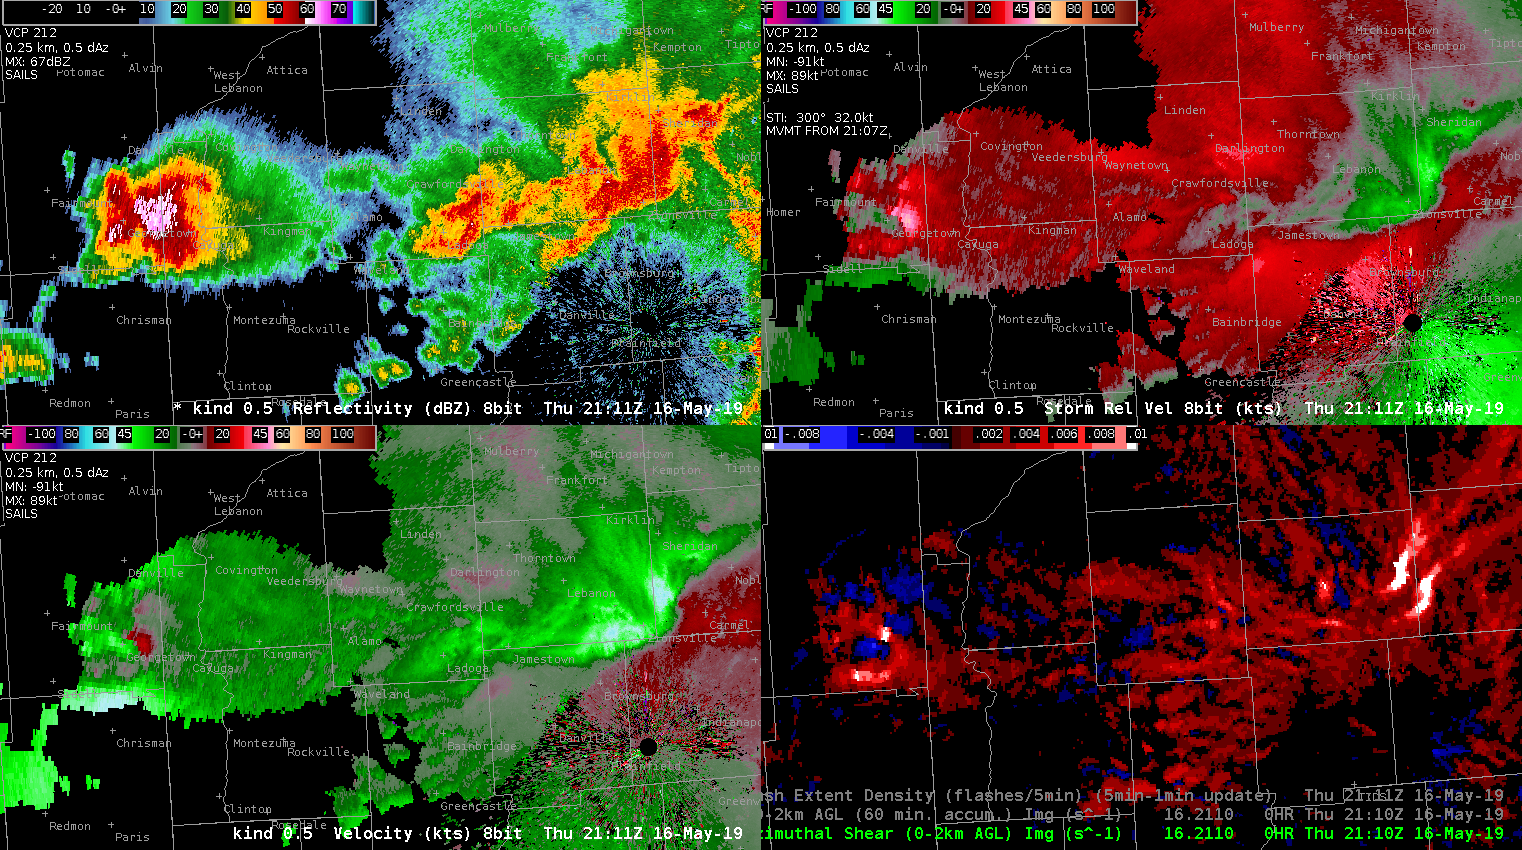
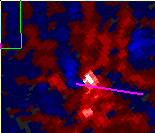
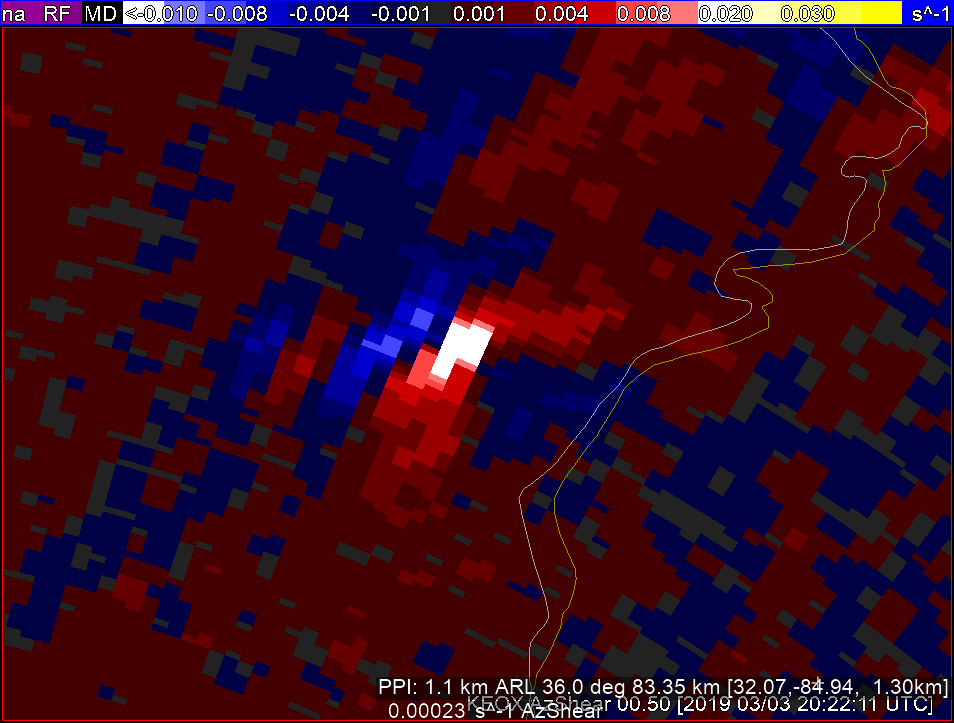
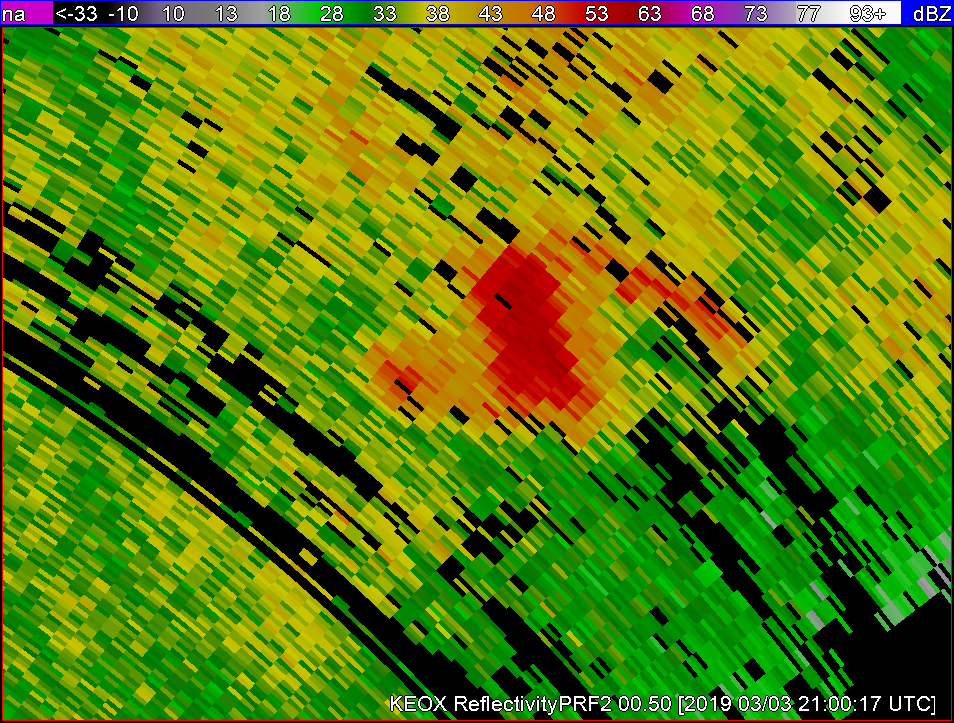
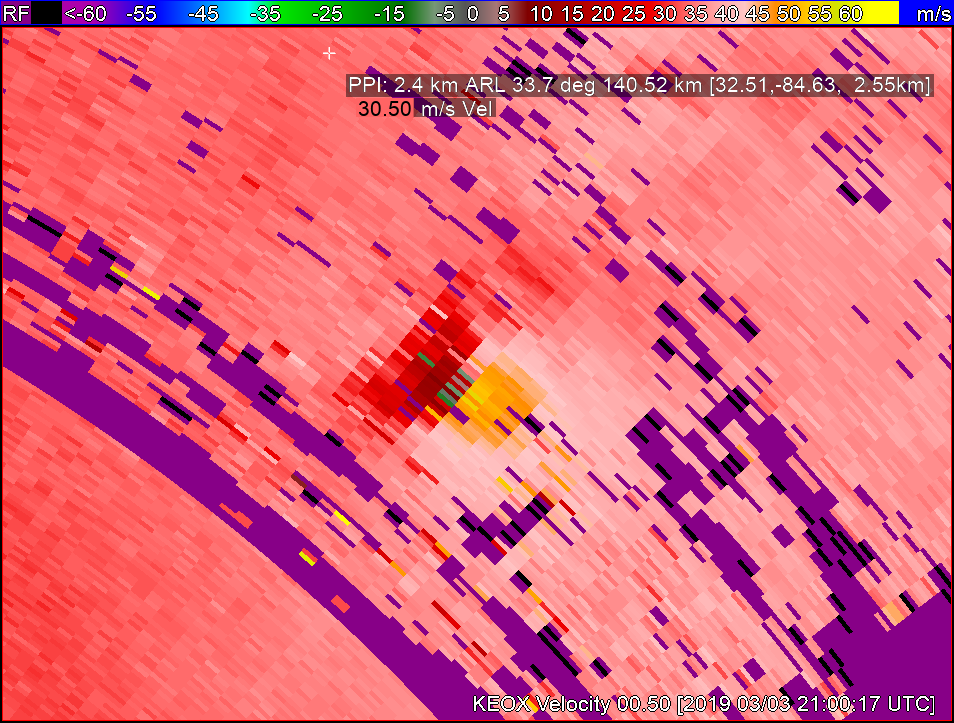
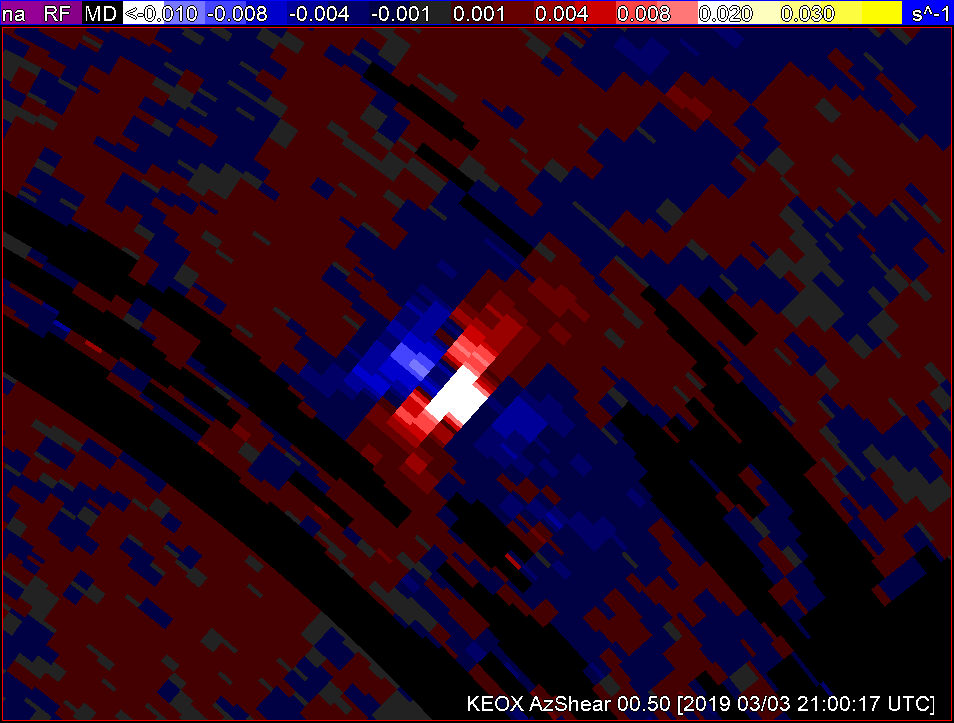
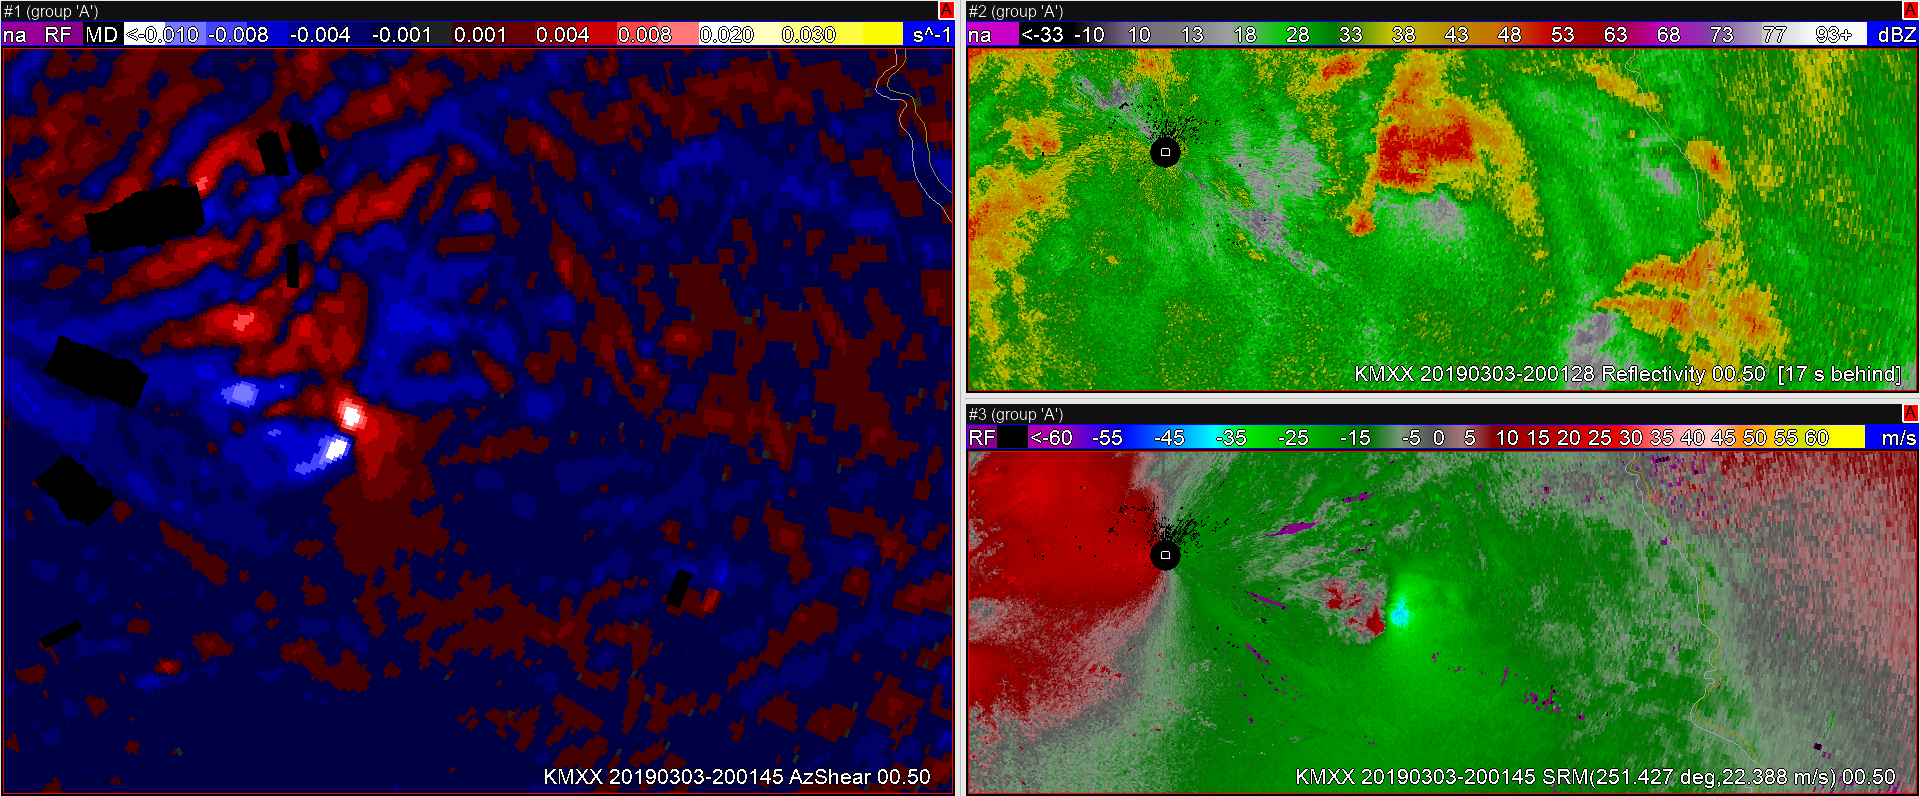
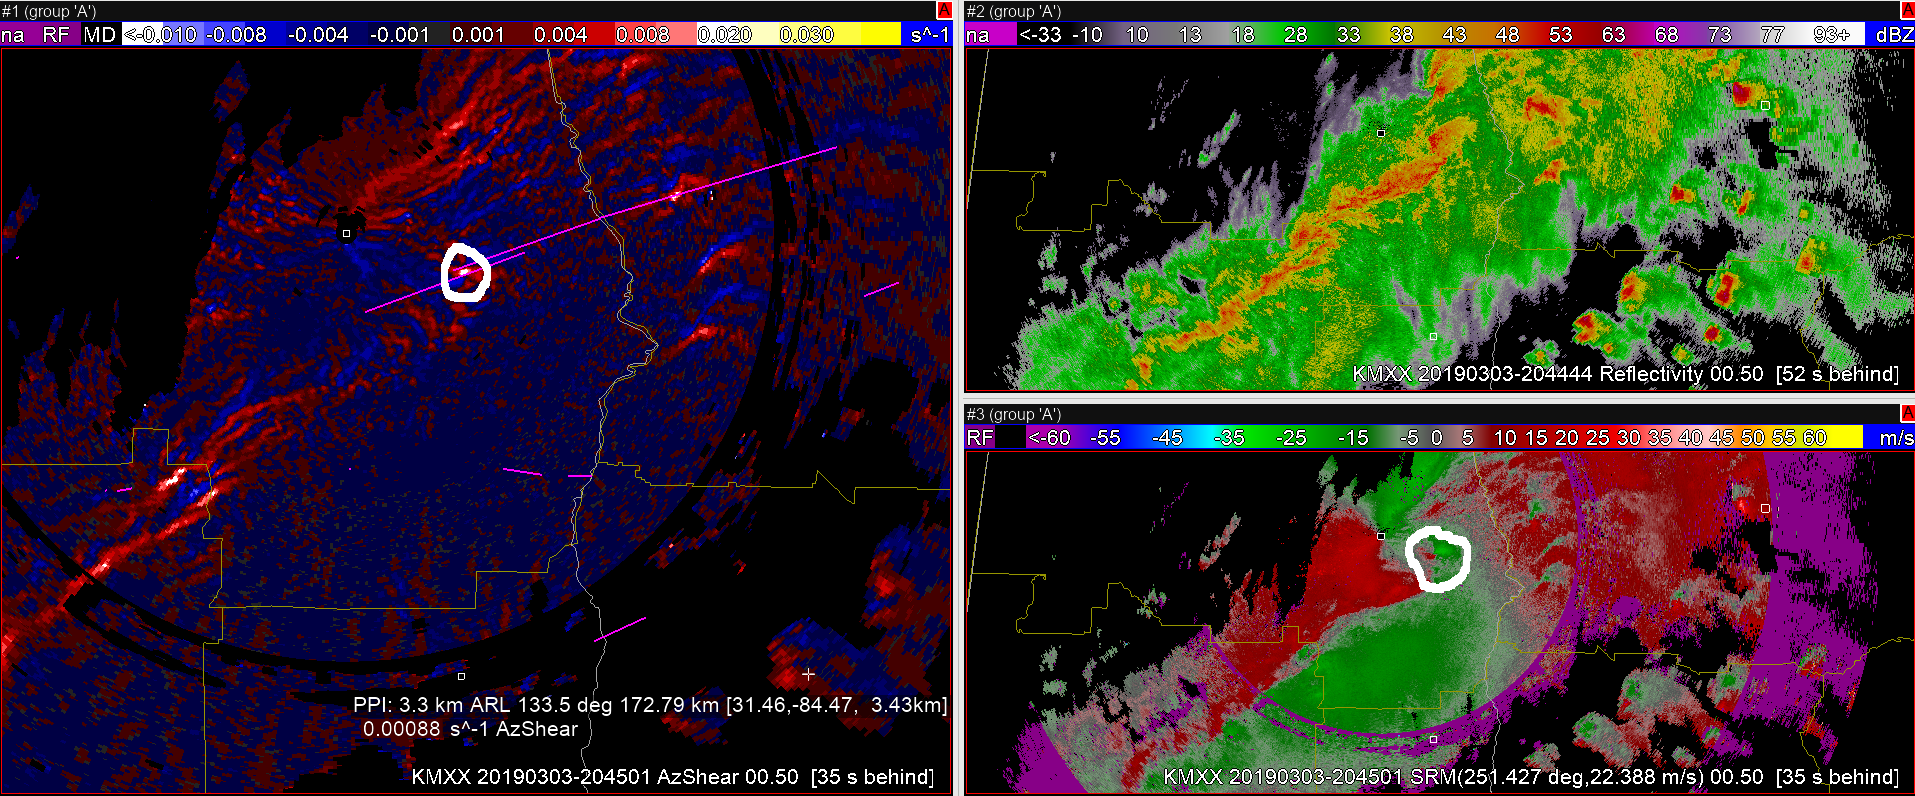
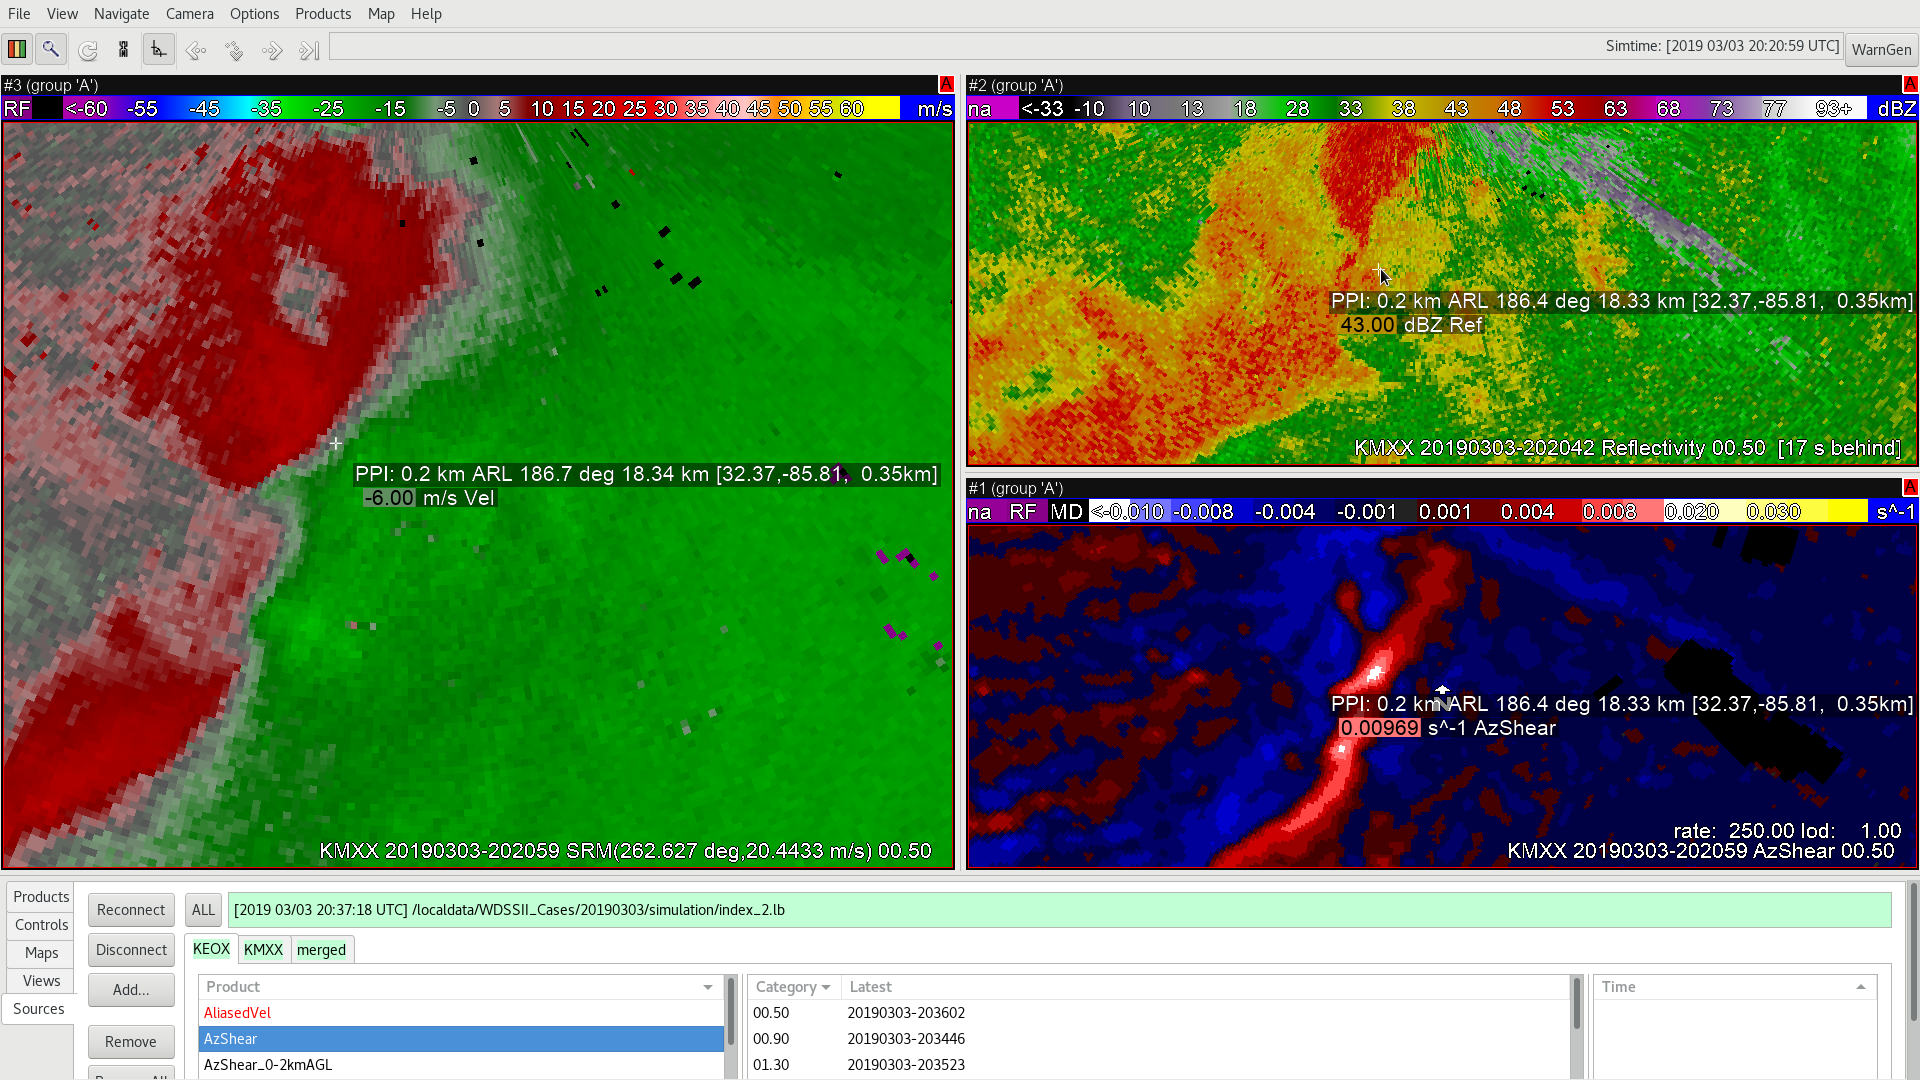
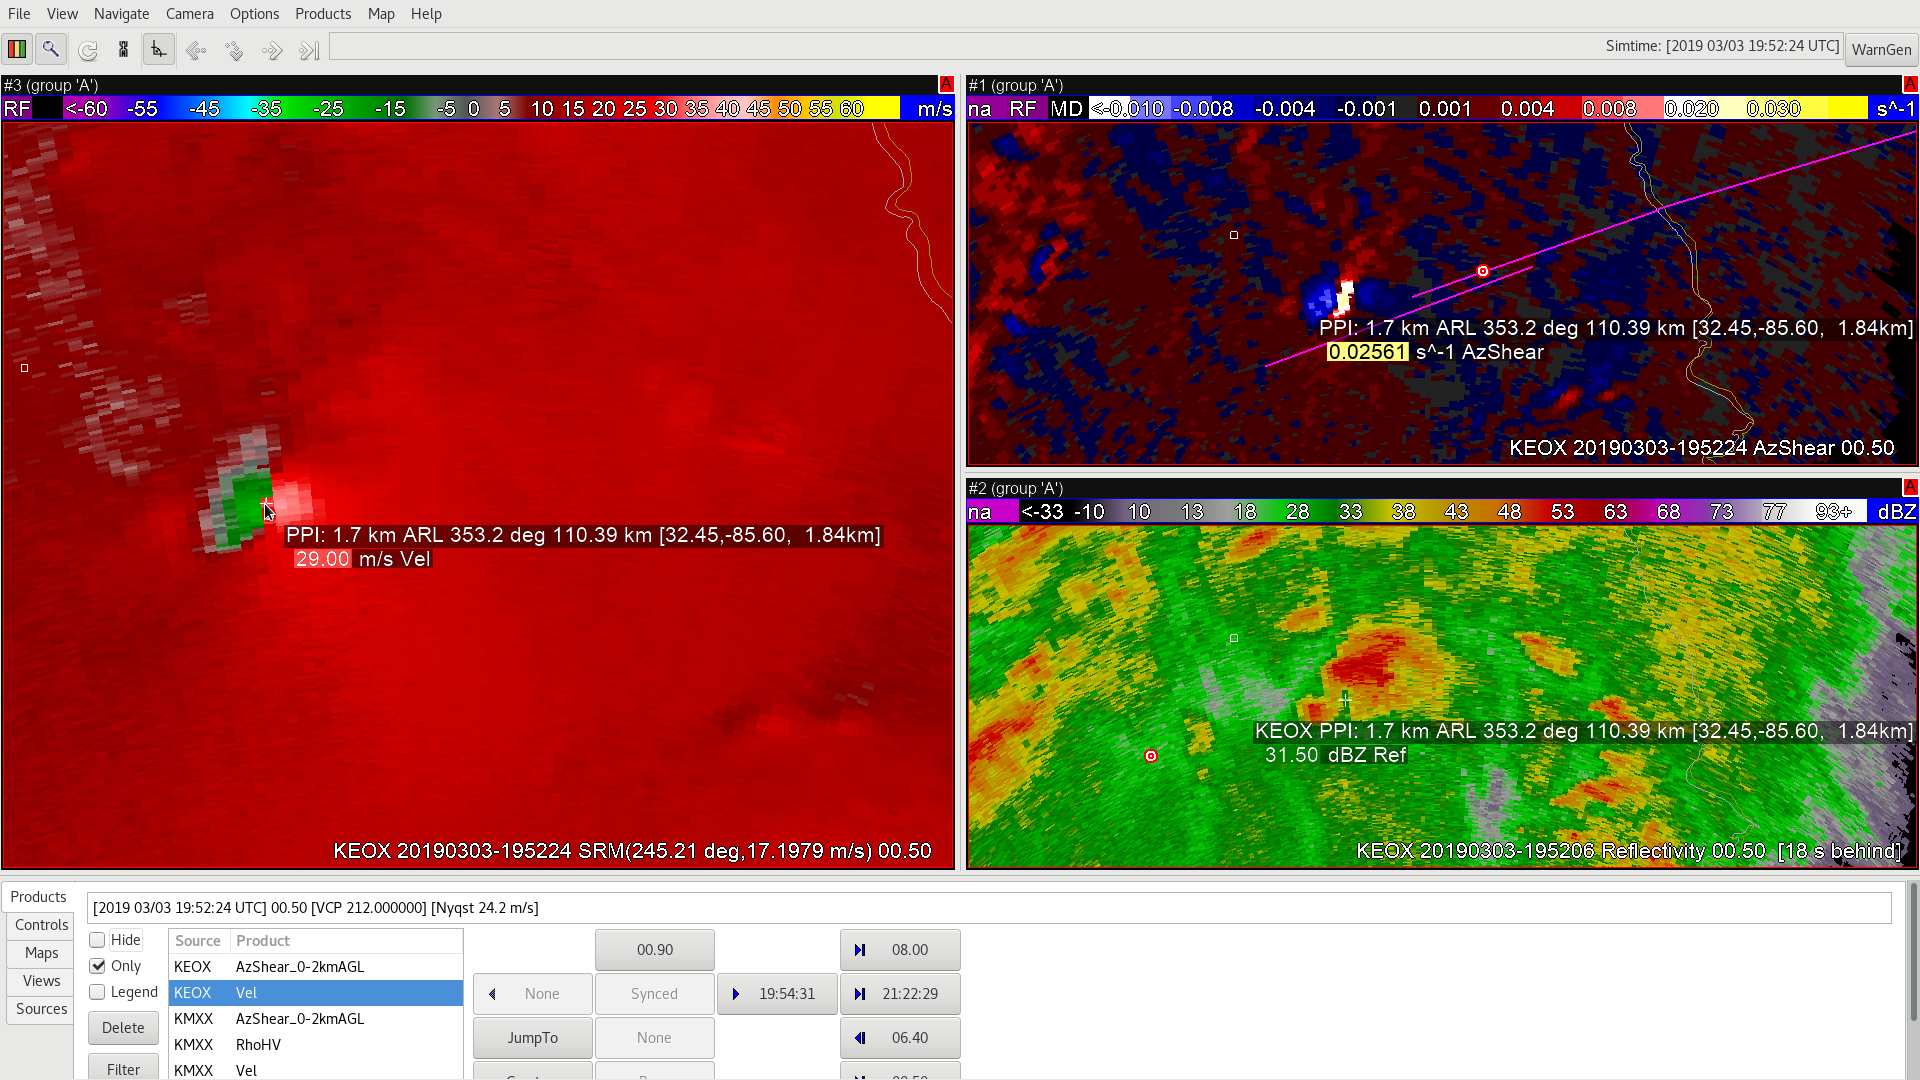
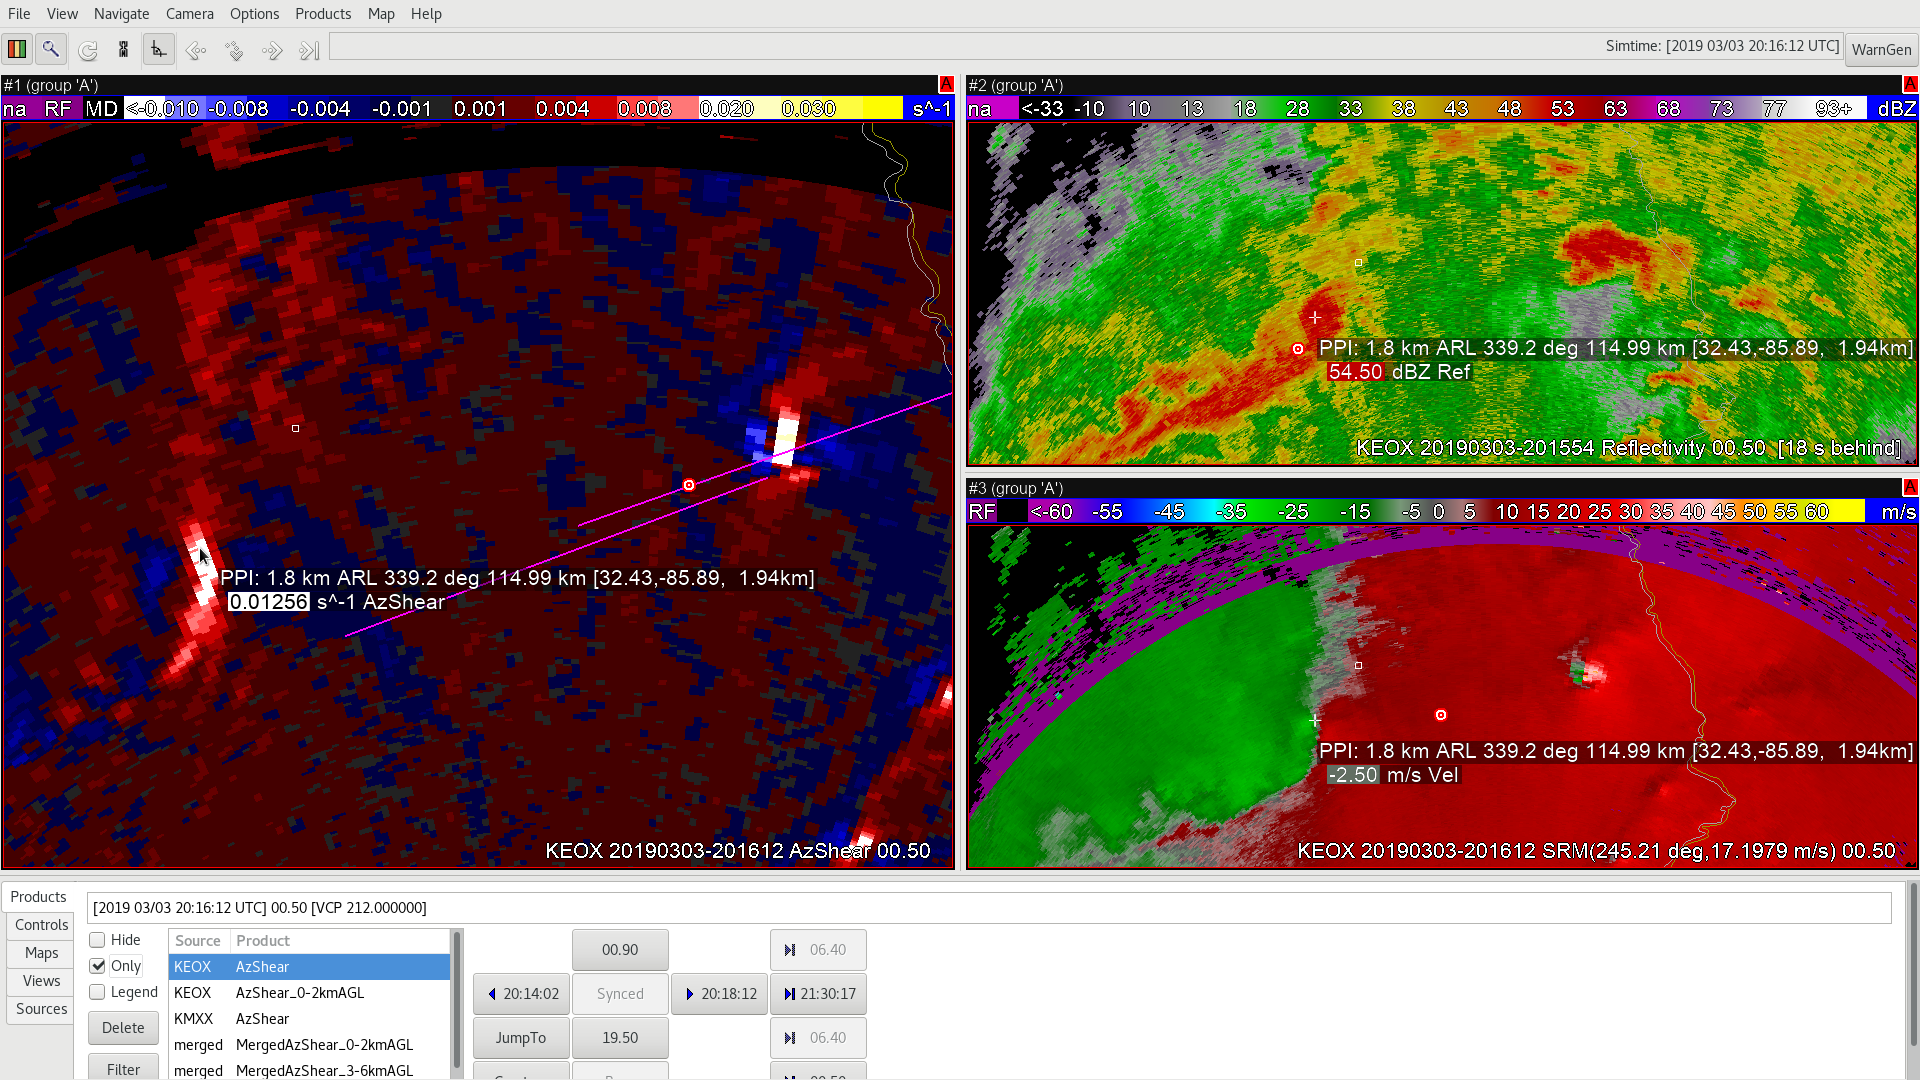
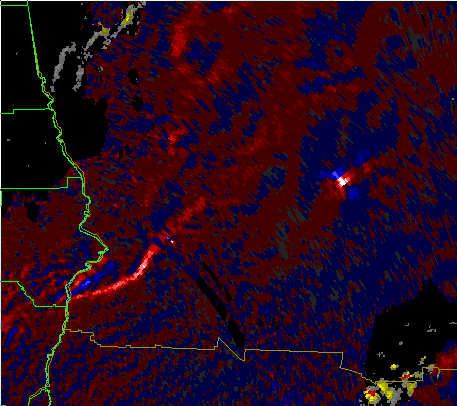
We see slightly negative AzShear regions flanking the AzShear maximum, which would be observable for a well-sampled mesocyclone, such as seen on the right hand side of the image below…

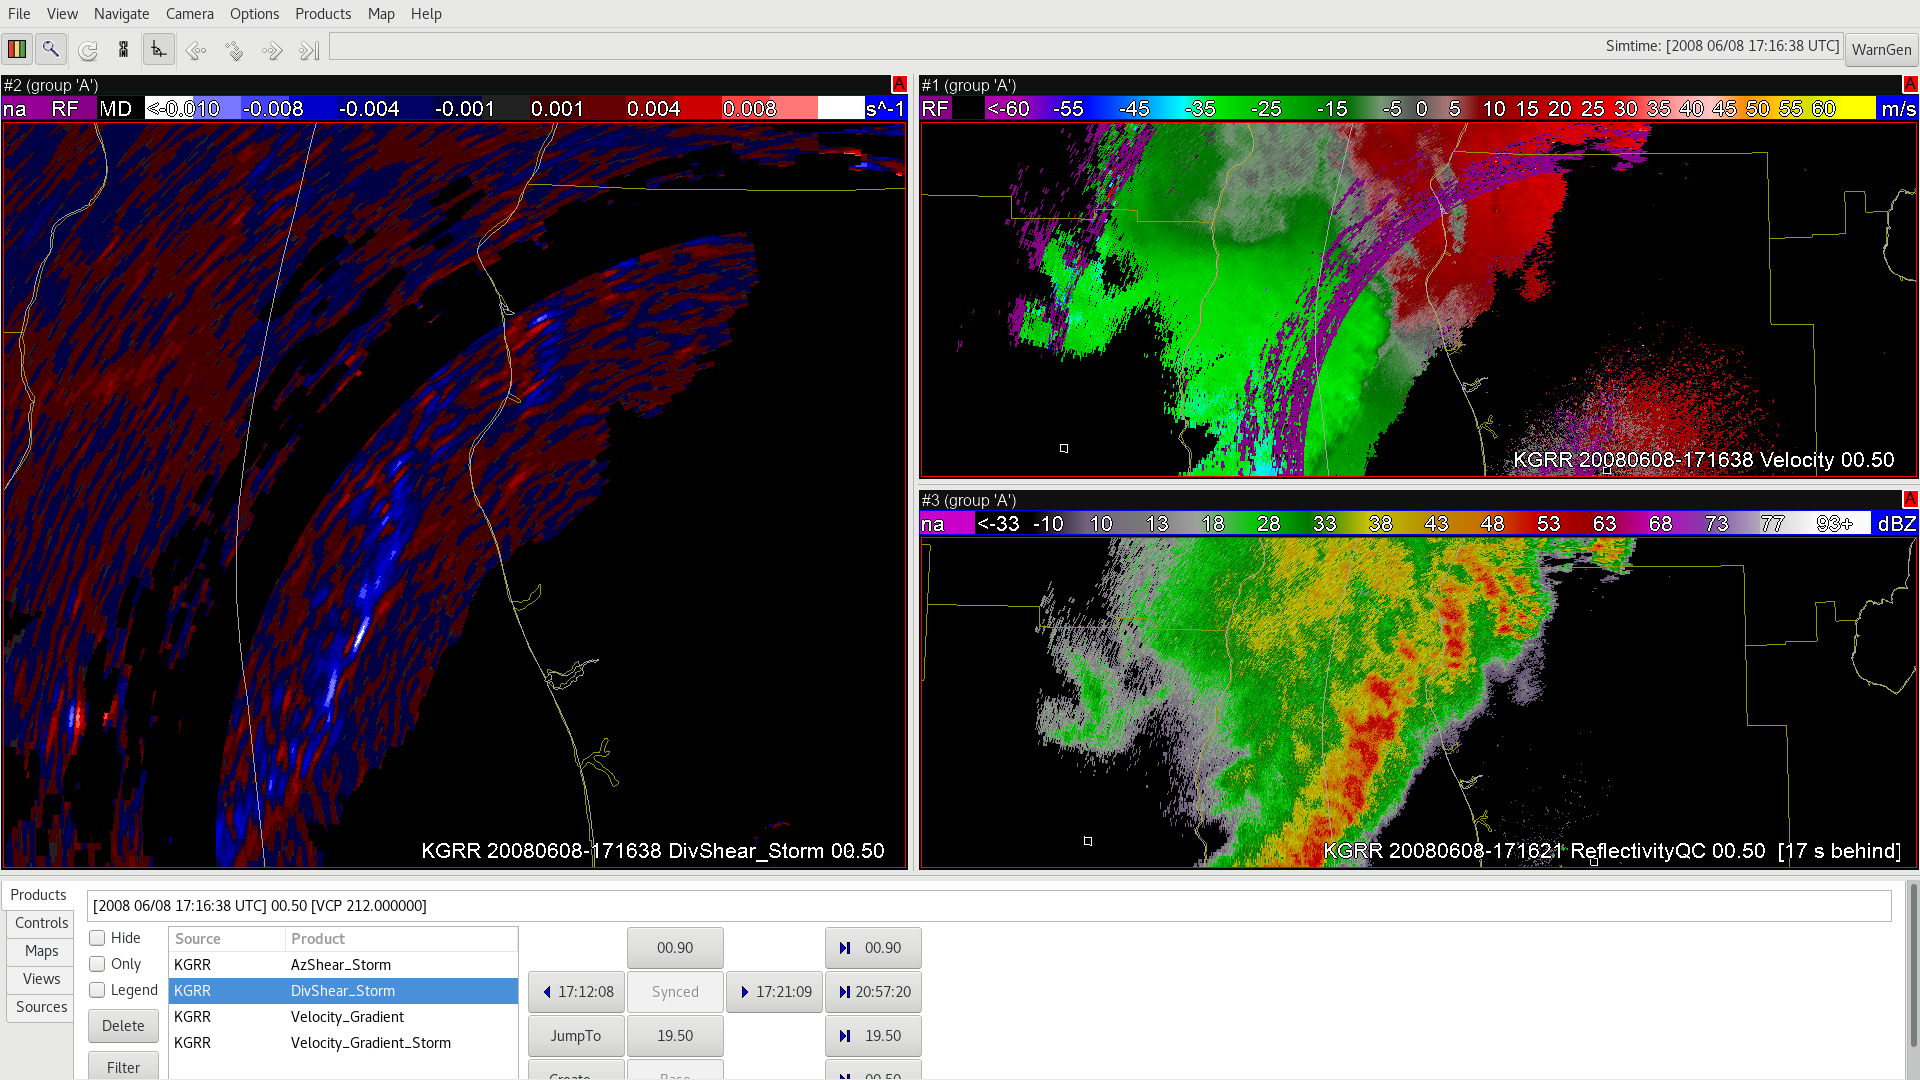
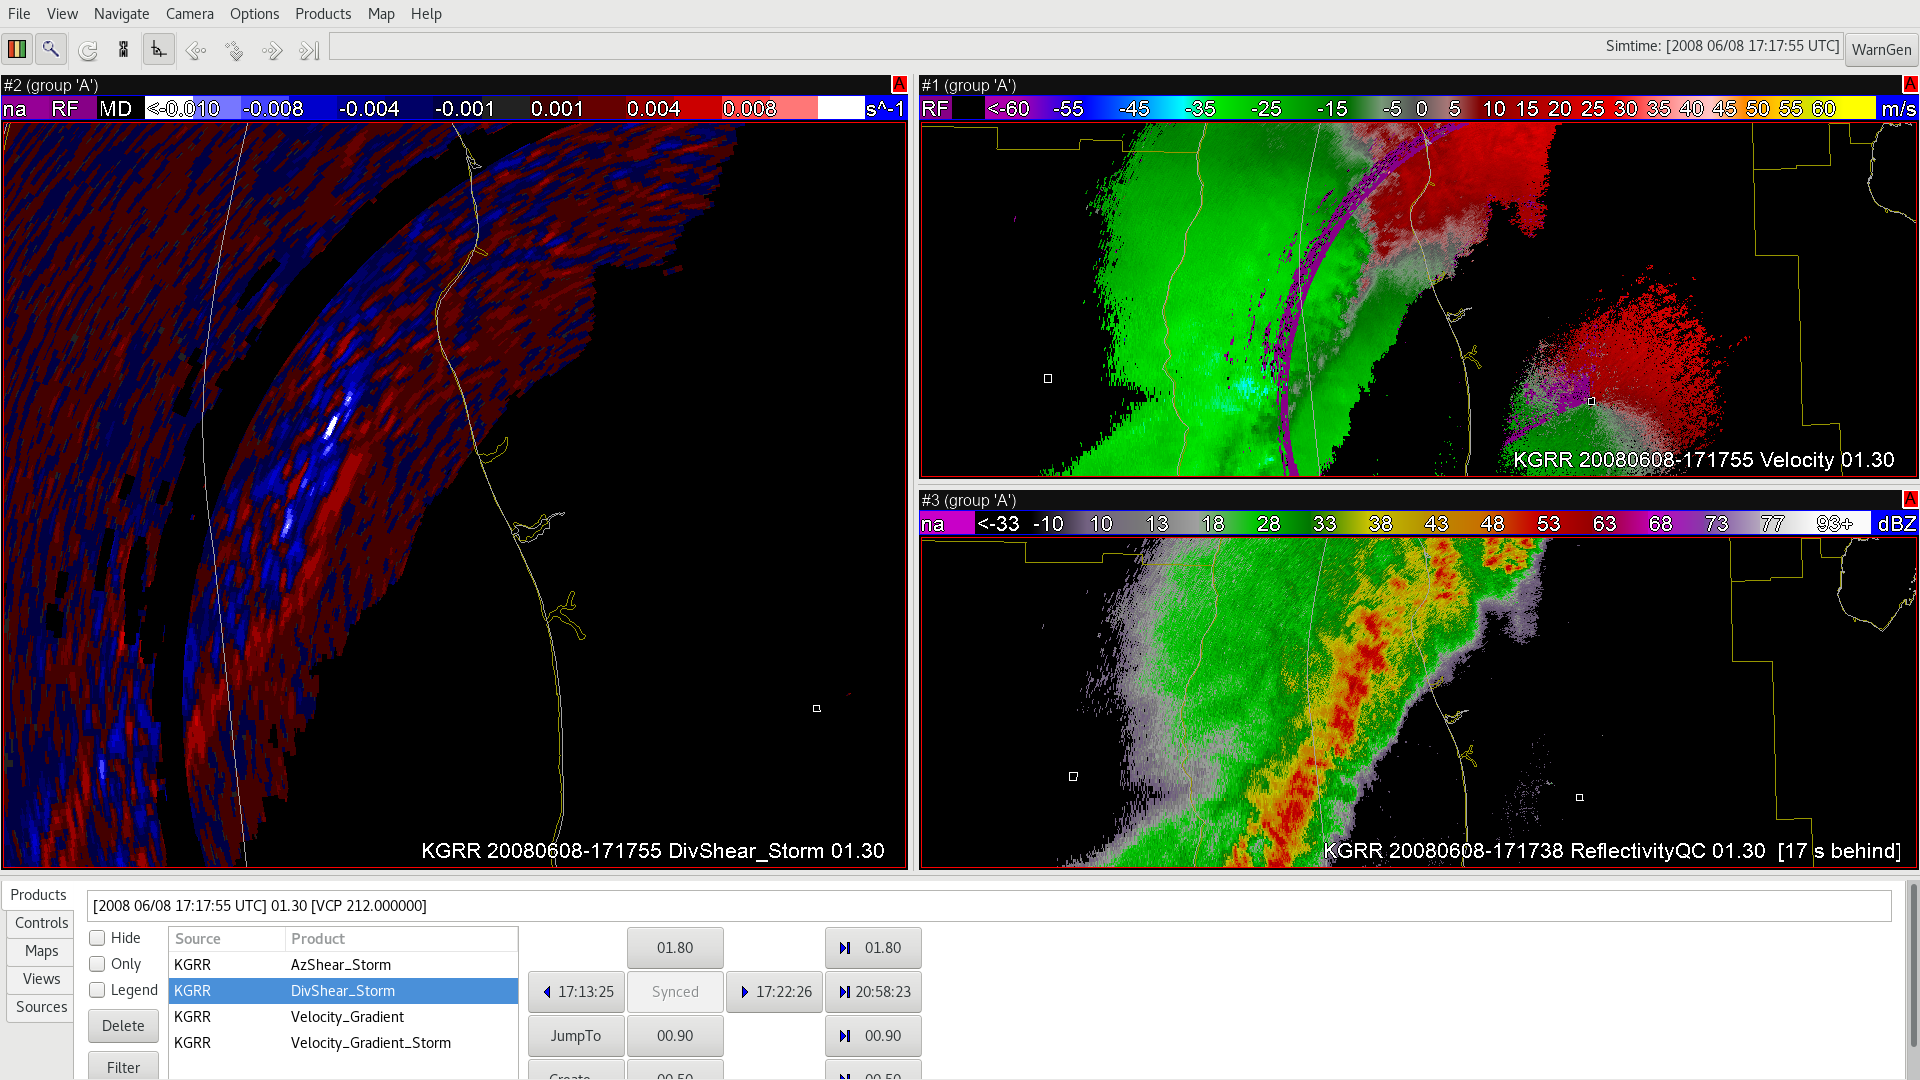
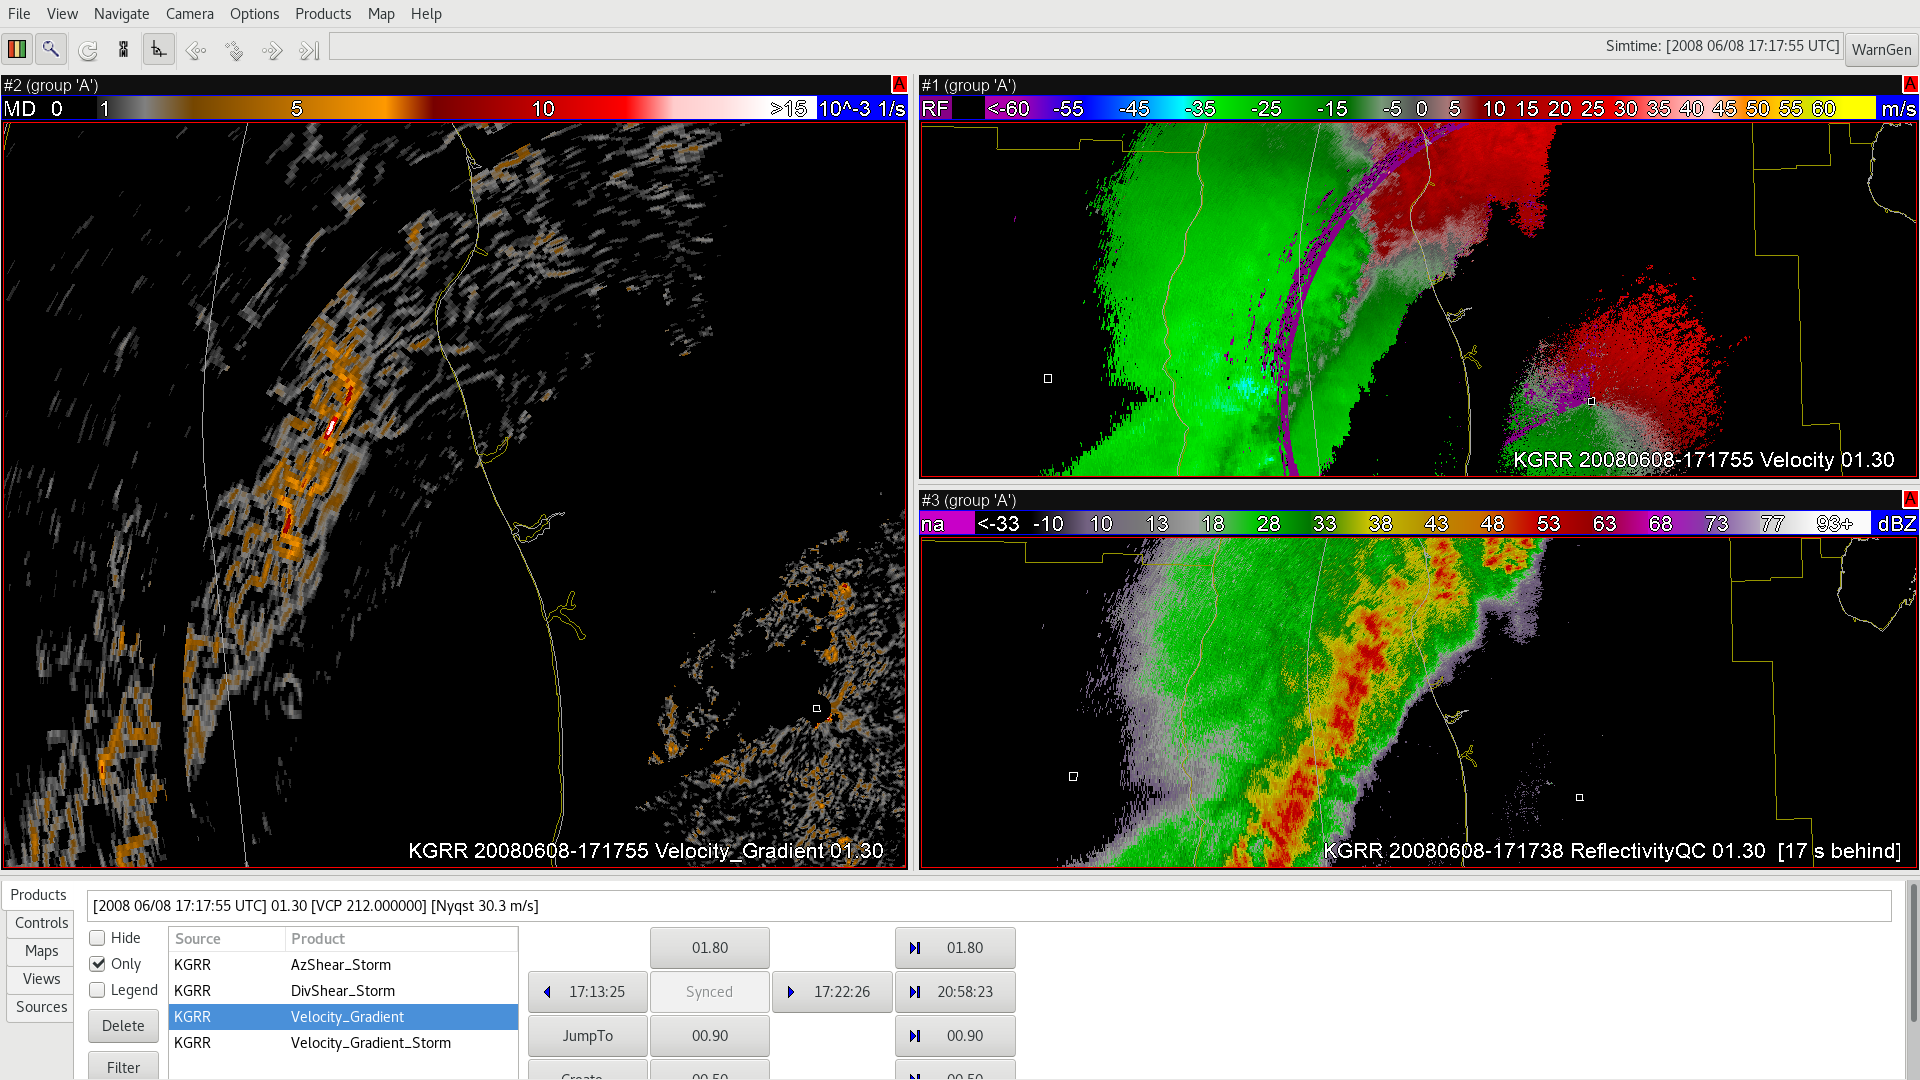
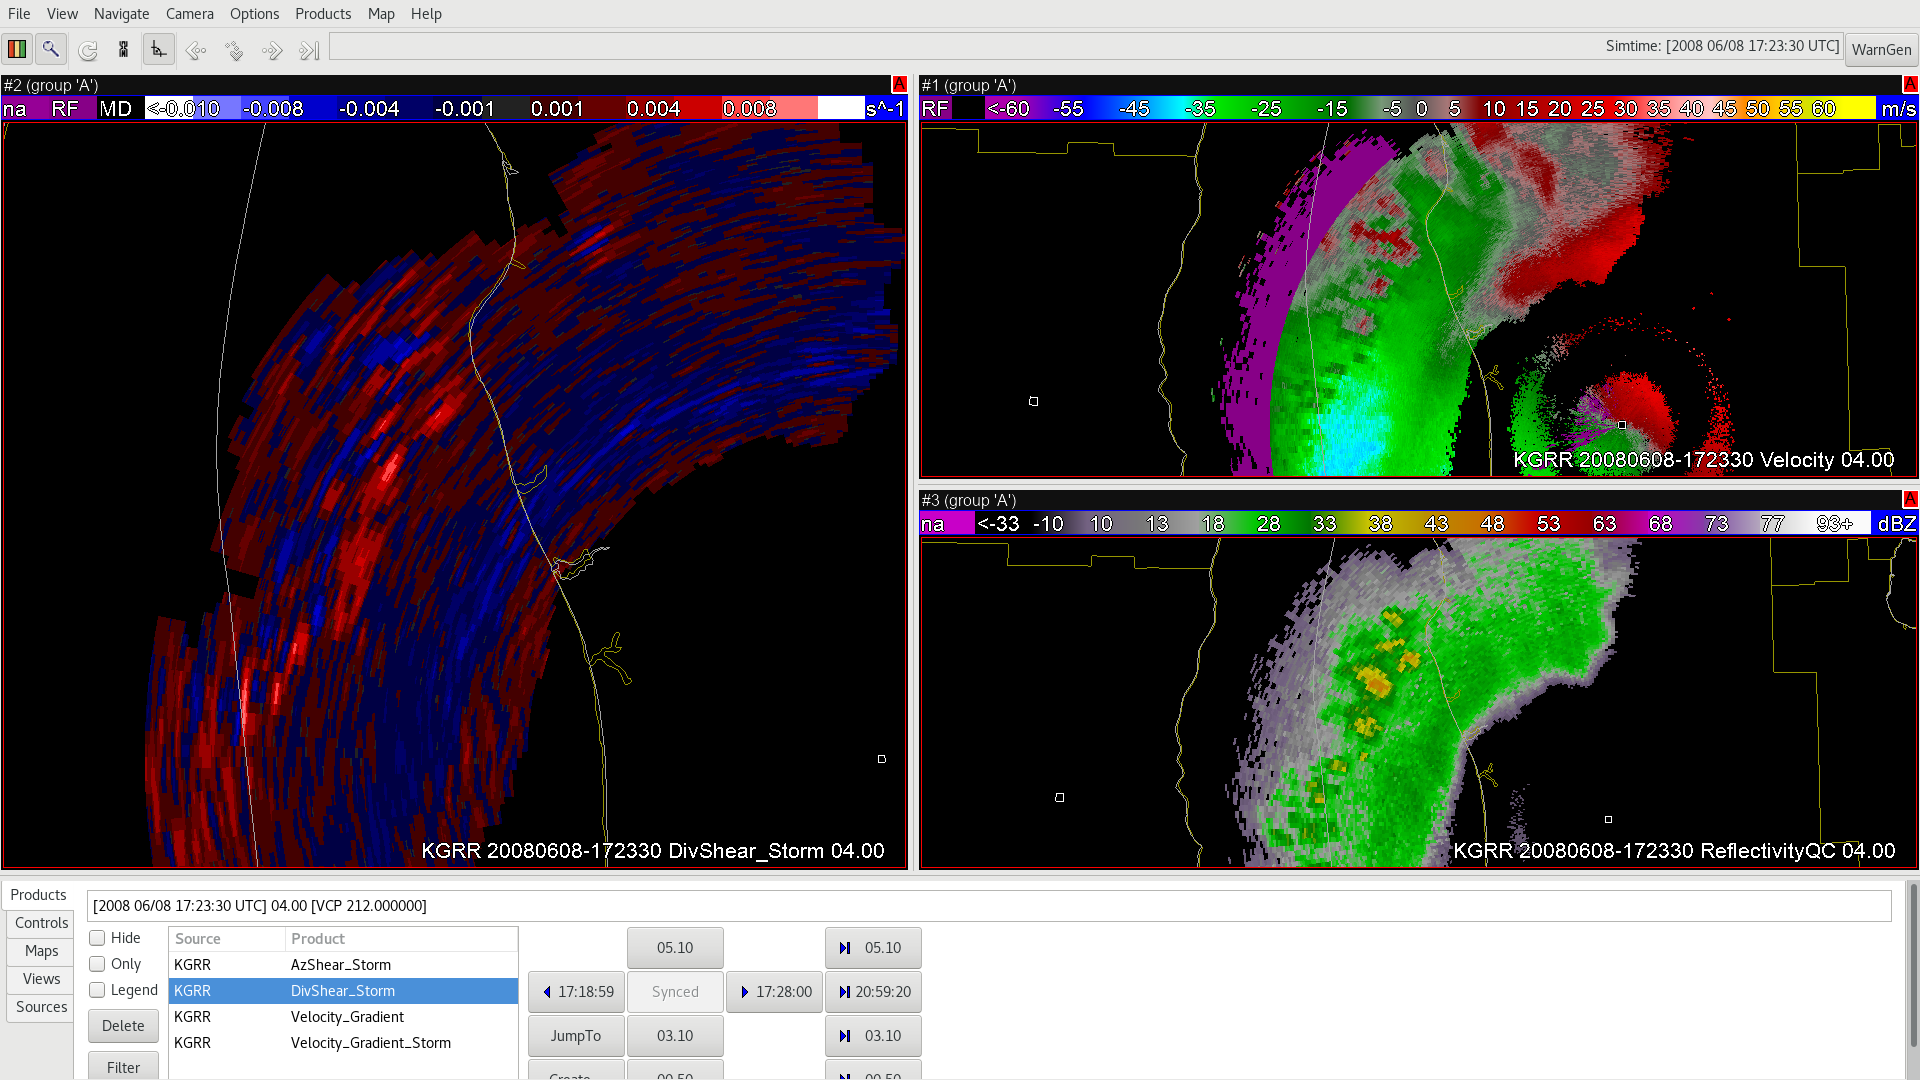
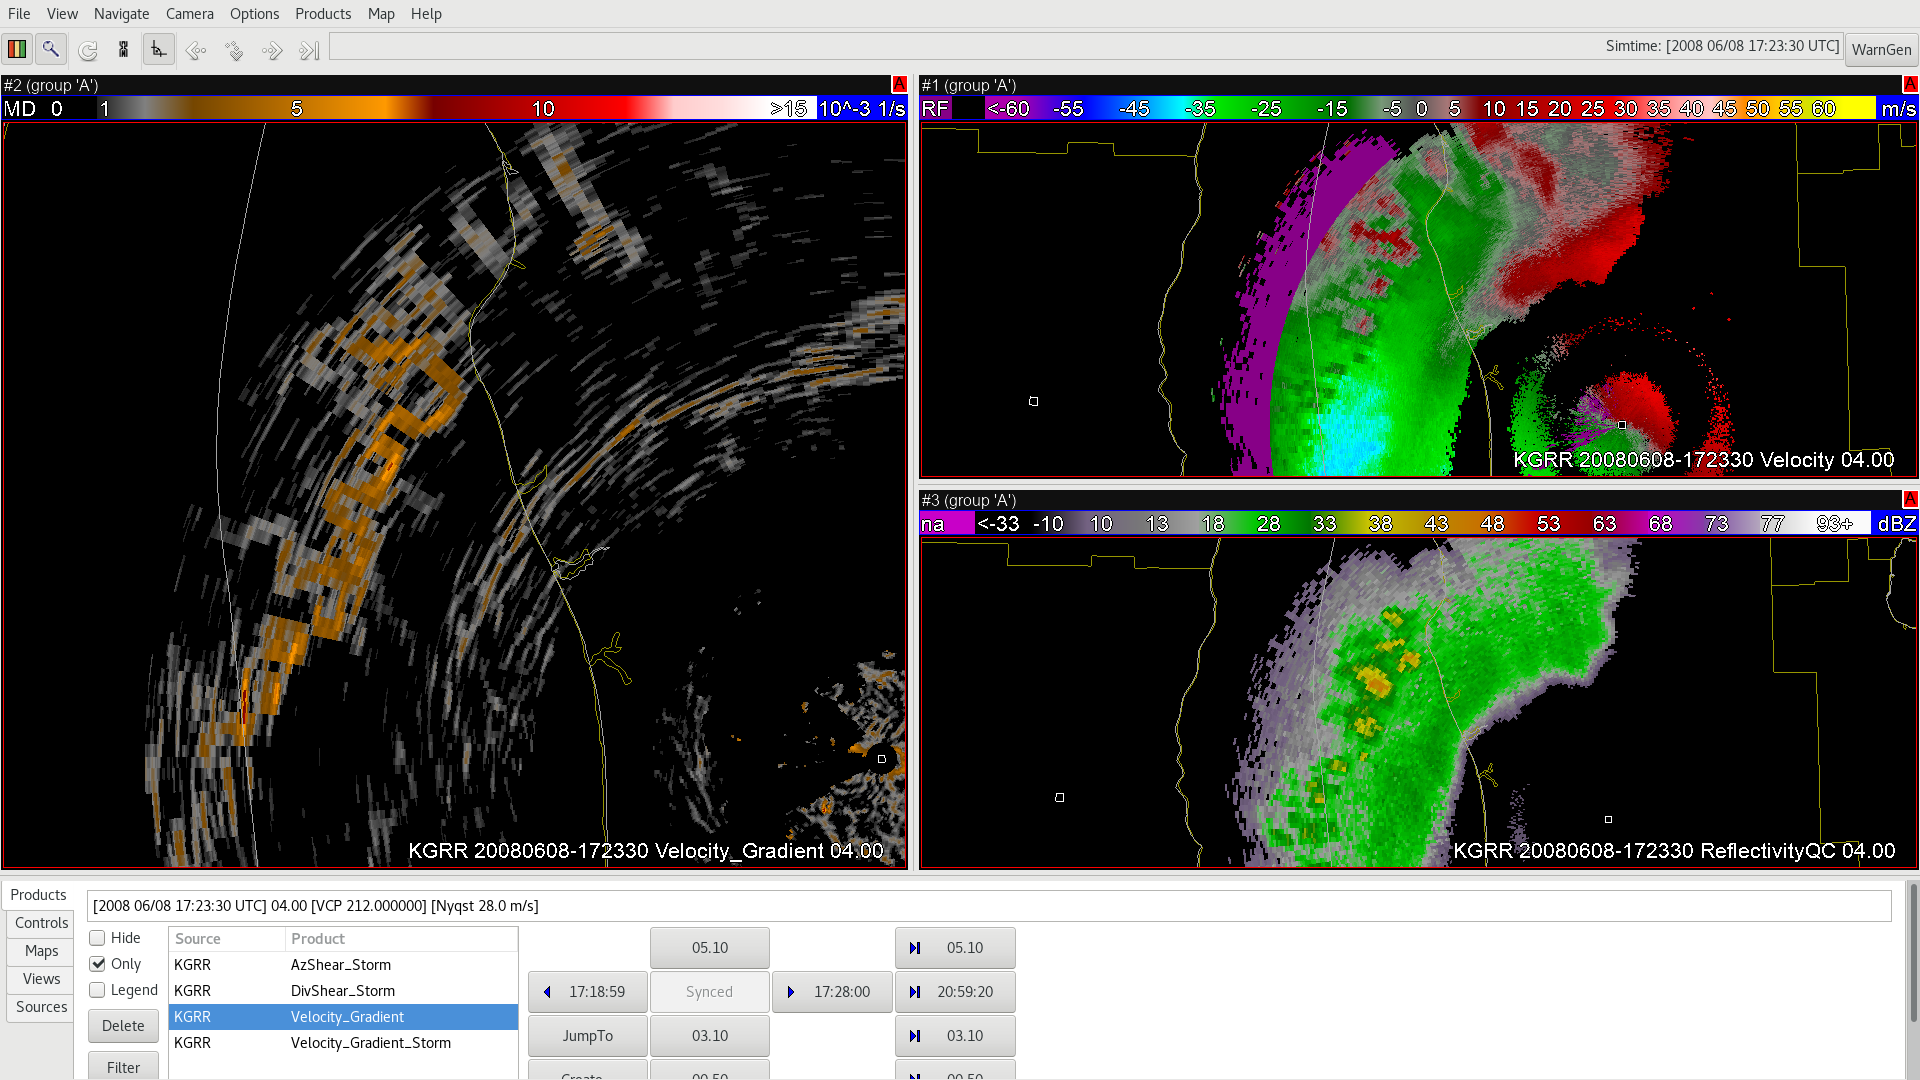
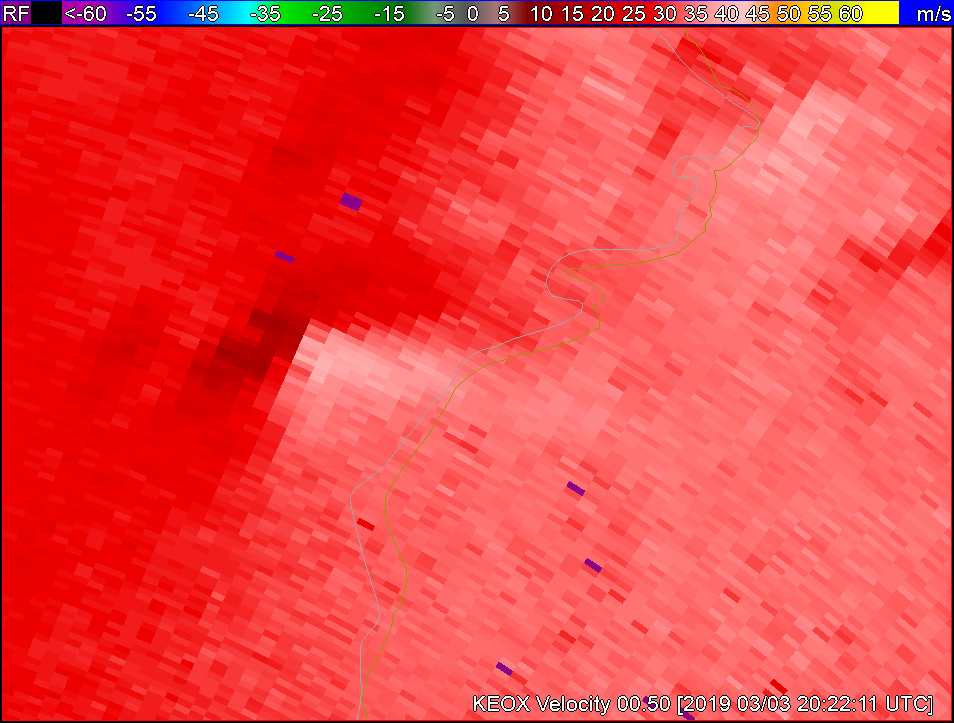
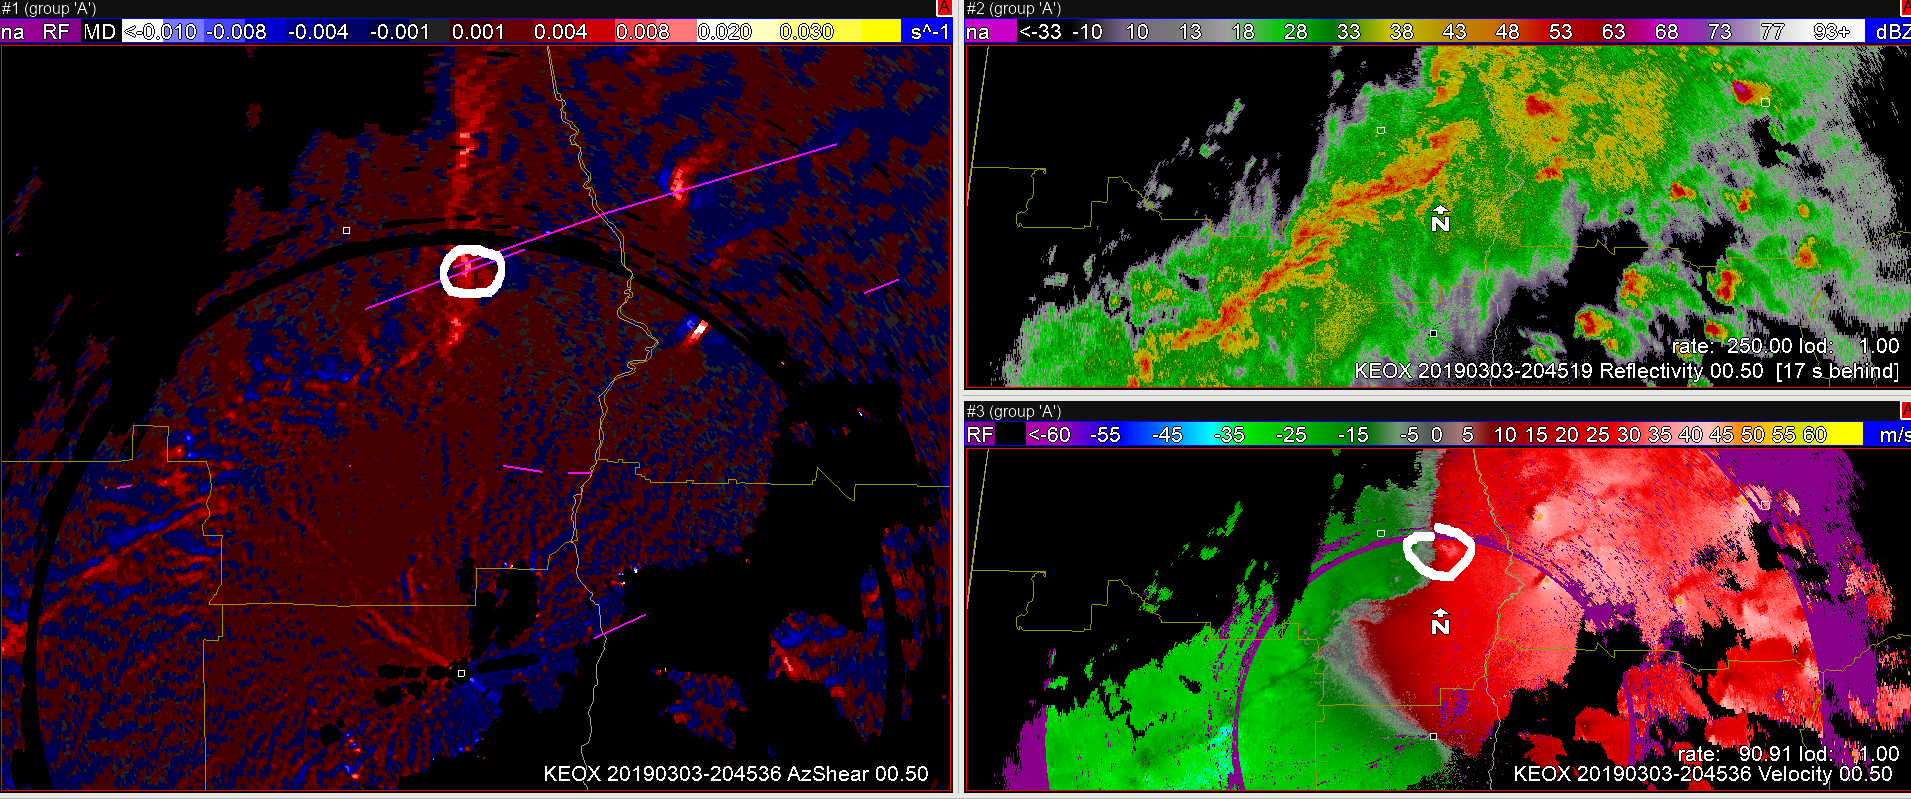
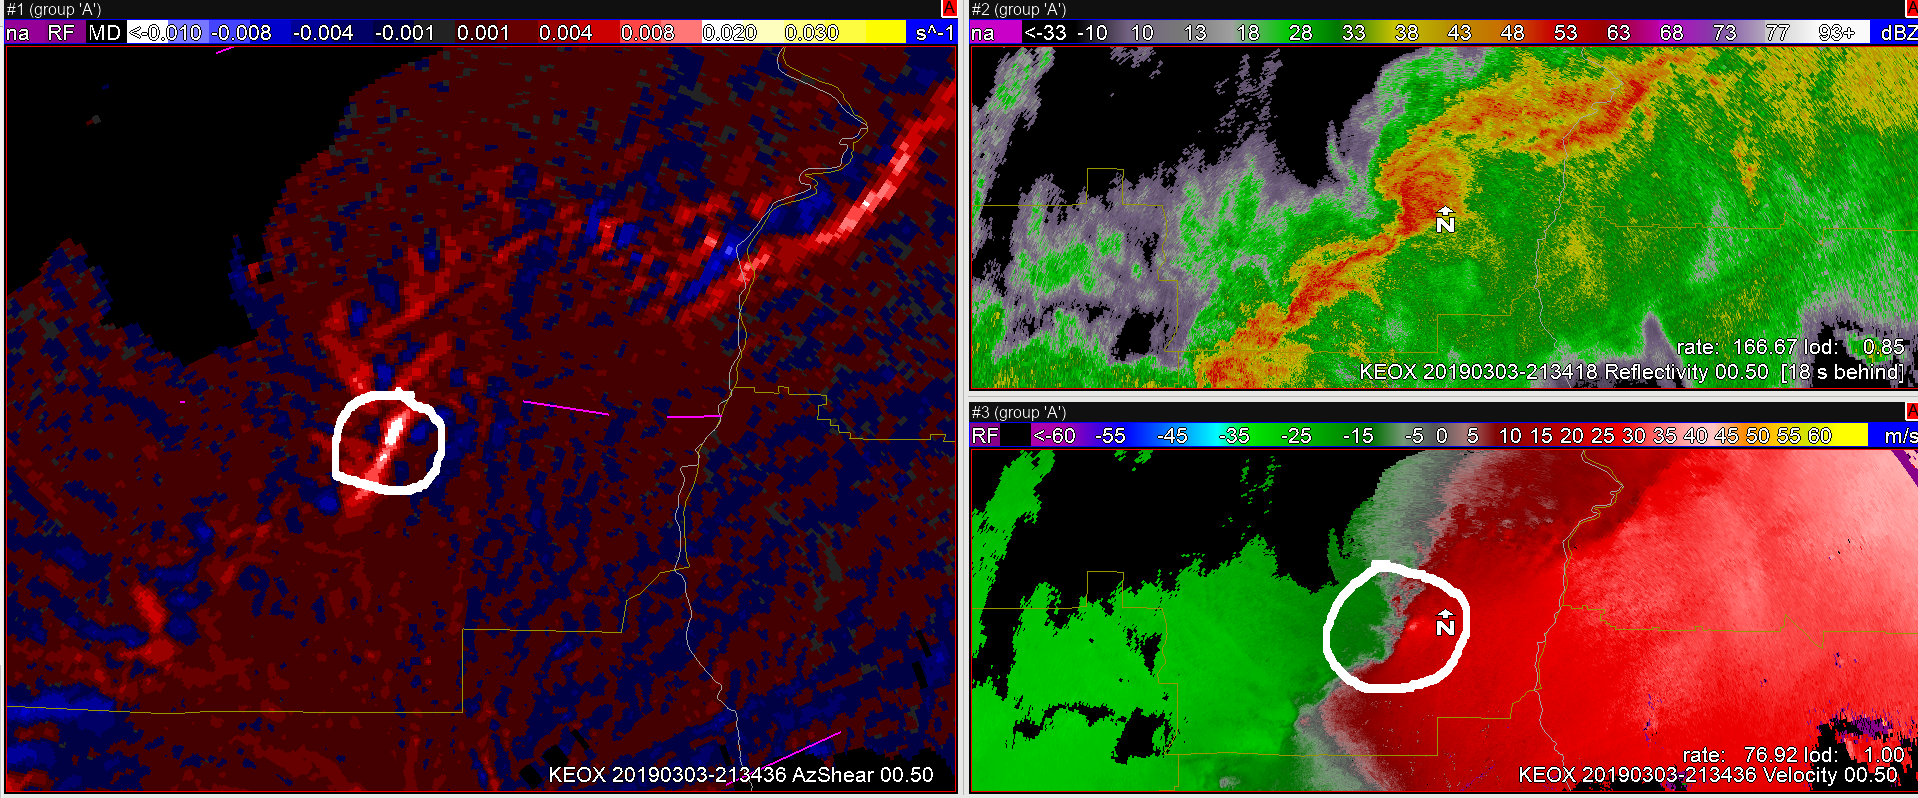
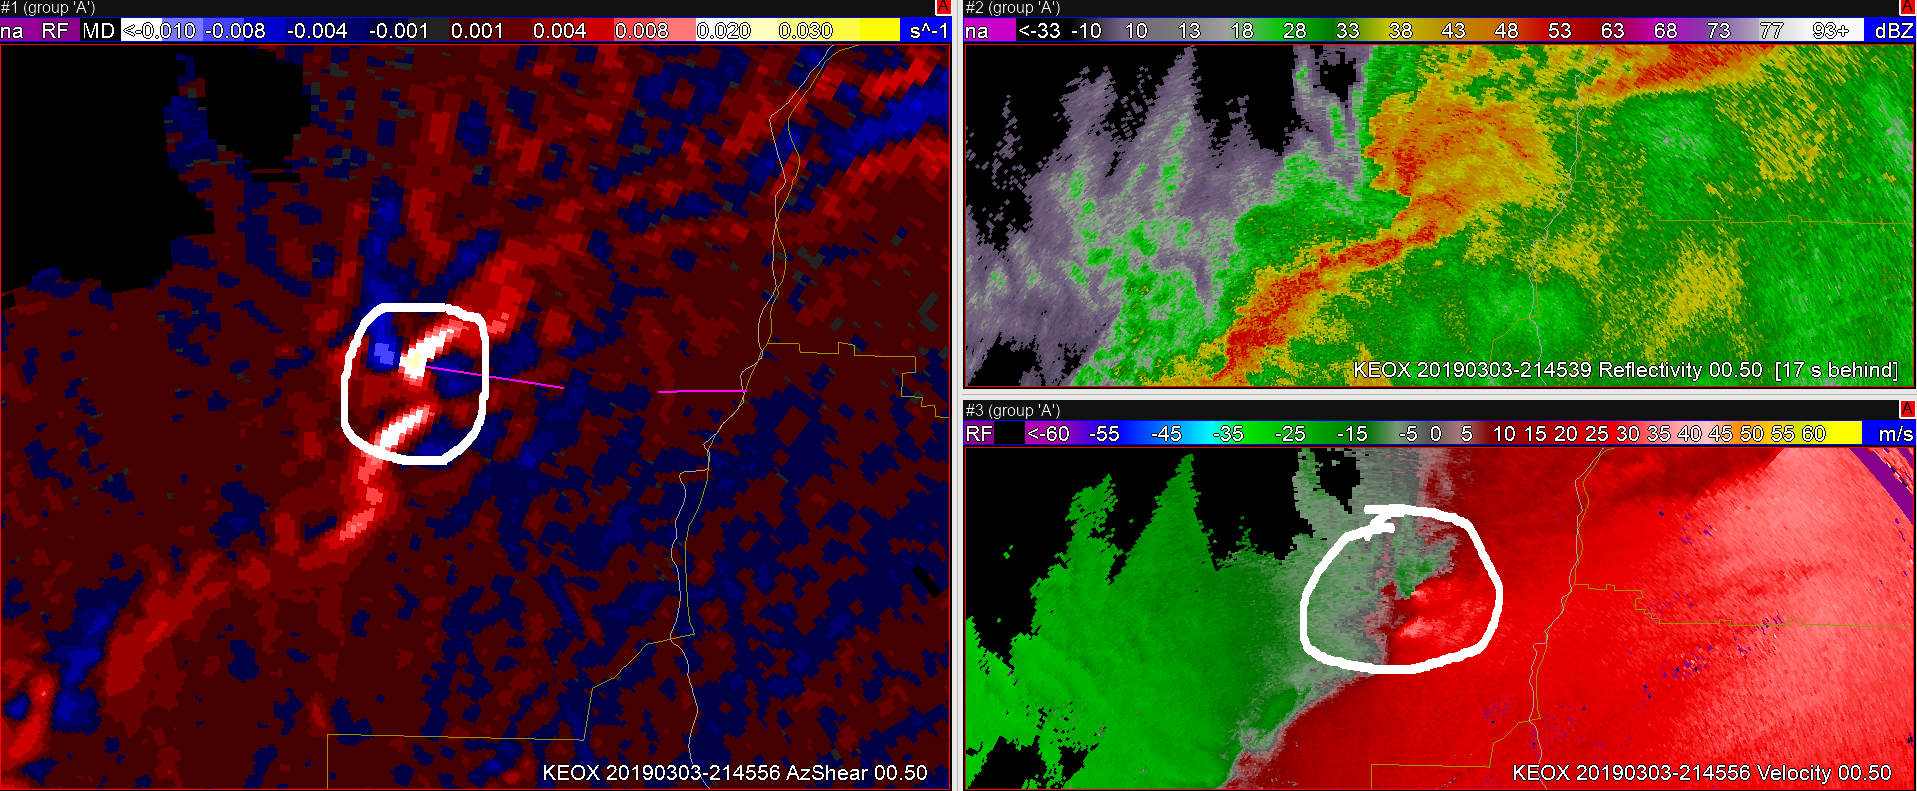
Also notice in the figure above that the maximum inbound/outbound velocities line up with where AzShear crosses zero.  Now, let’s pretend we have a rear flank downdraft or RIJ surge by boosting the “inbound” side of the circulation…


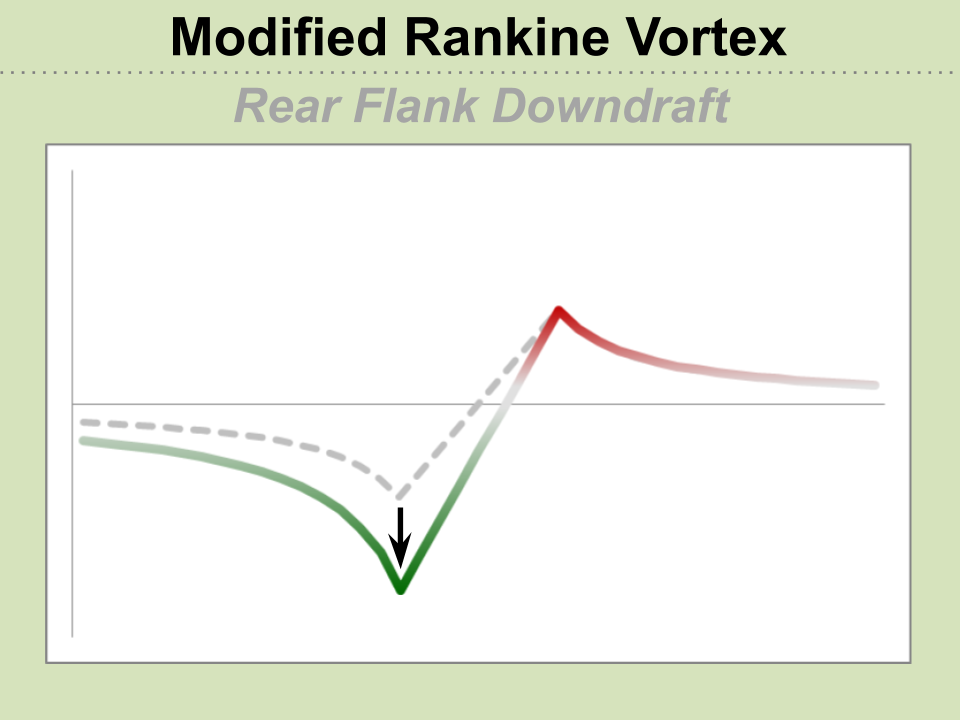
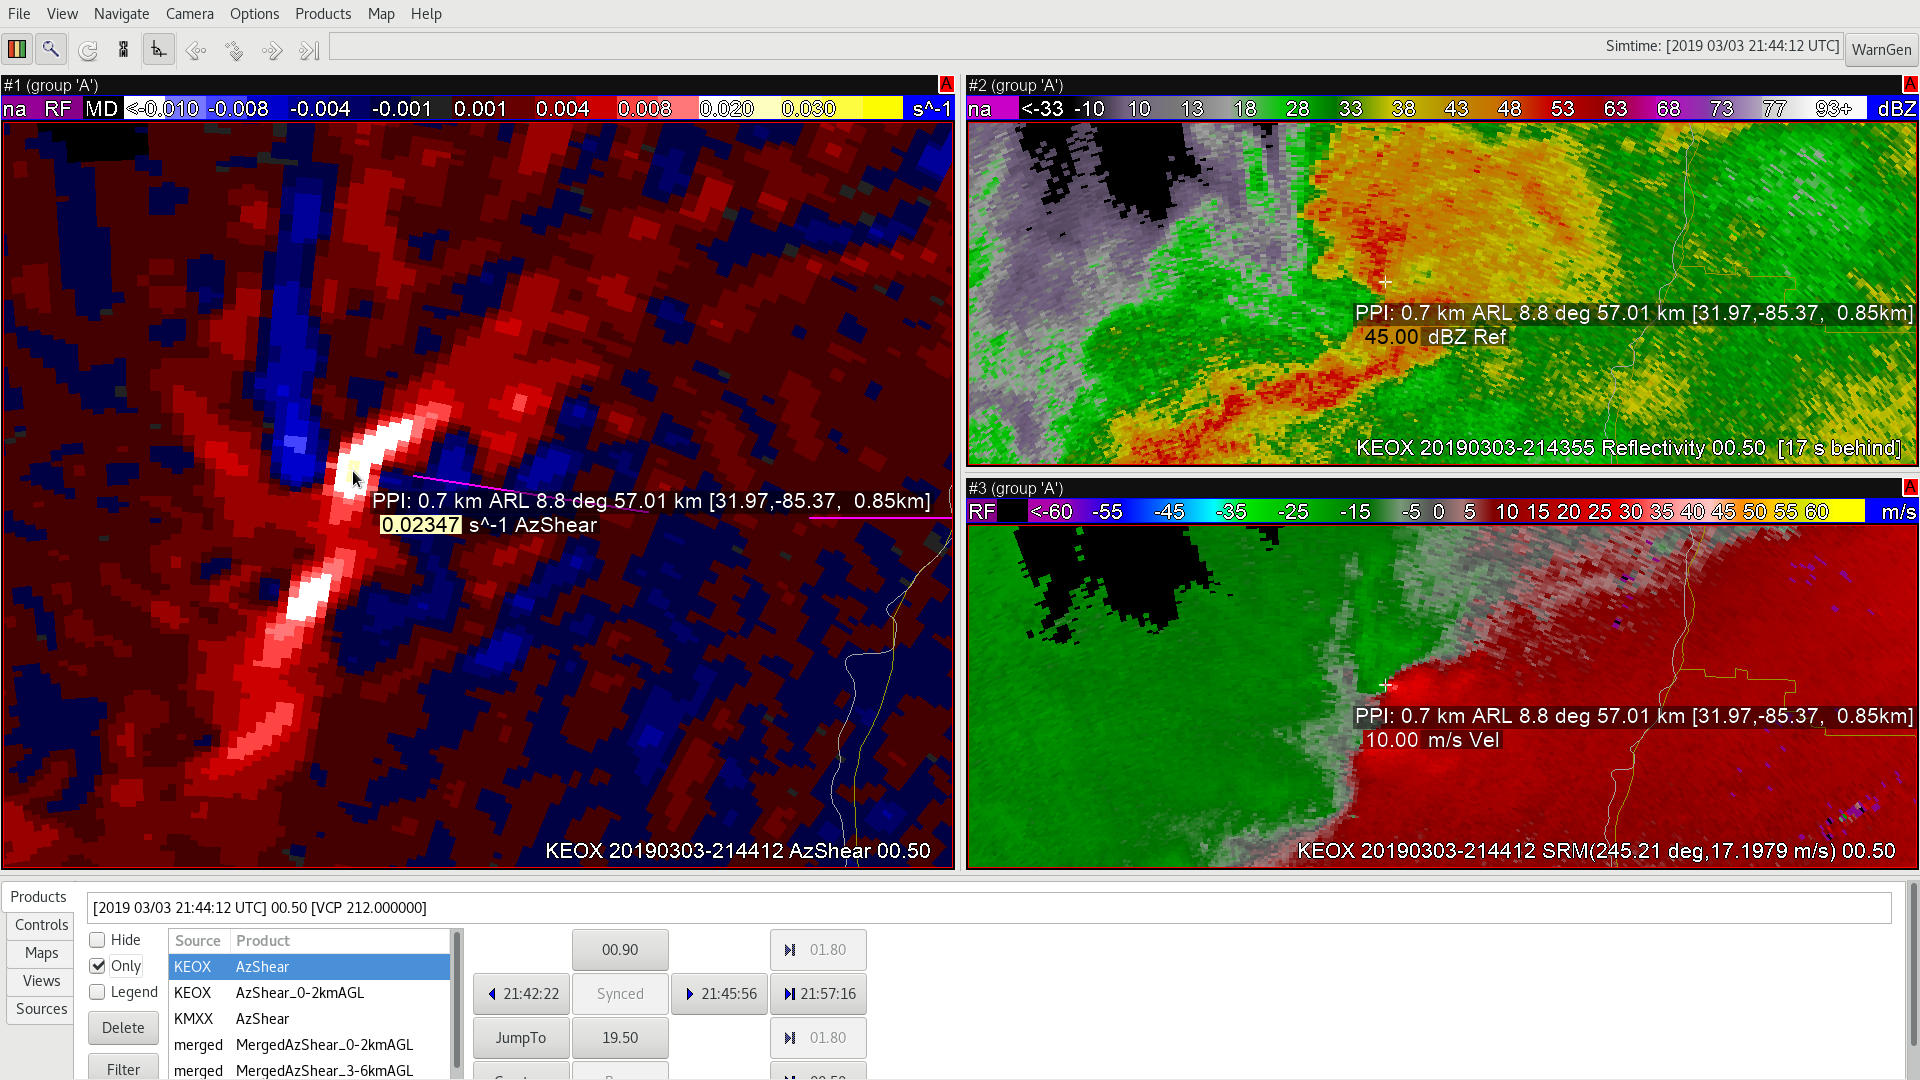
Now what does the new AzShear trace look like?

Well, we see more of an AzShear “couplet” as both positive *and* negative shear increase on either side of the surge. The maximum winds are still occurring where AzShear equals zero and this is located directly in between the AzShear maximum and AzShear minimum in conjunction with the center  the surge.

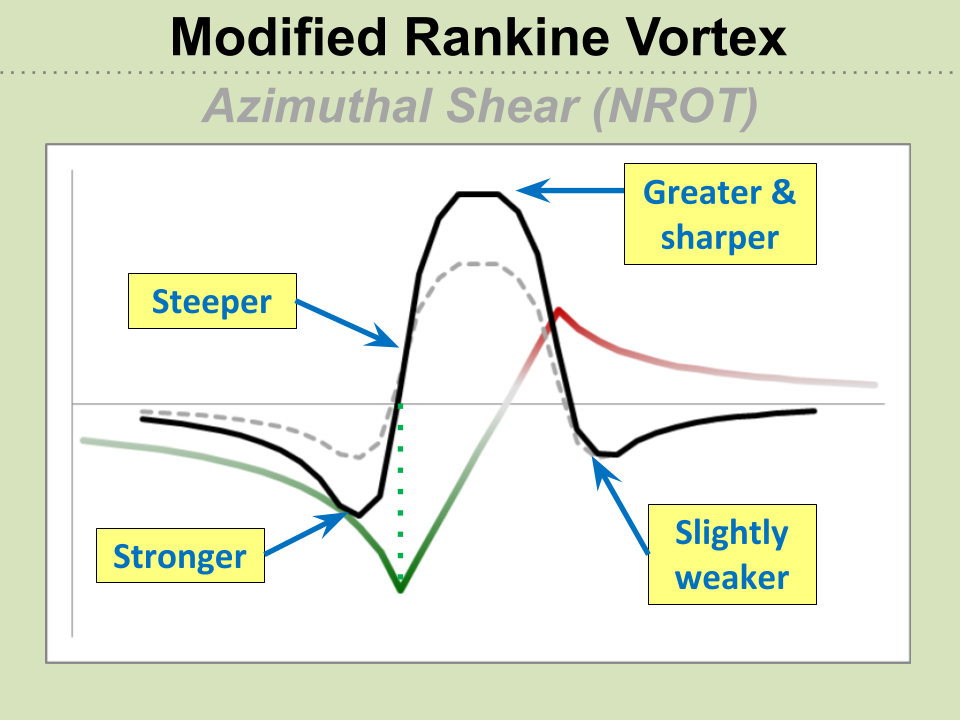
I’m firmly convinced that looking between these two features is an effective way to pinpoint where the most damaging wind will occur, whether it’s tornadic or straight-line. For the smaller tornadoes that most of us get, the southern edge of the AzShear maximum is a sweet spot that has the cumulative effects of rotation, translation, and inflow to maximize winds.
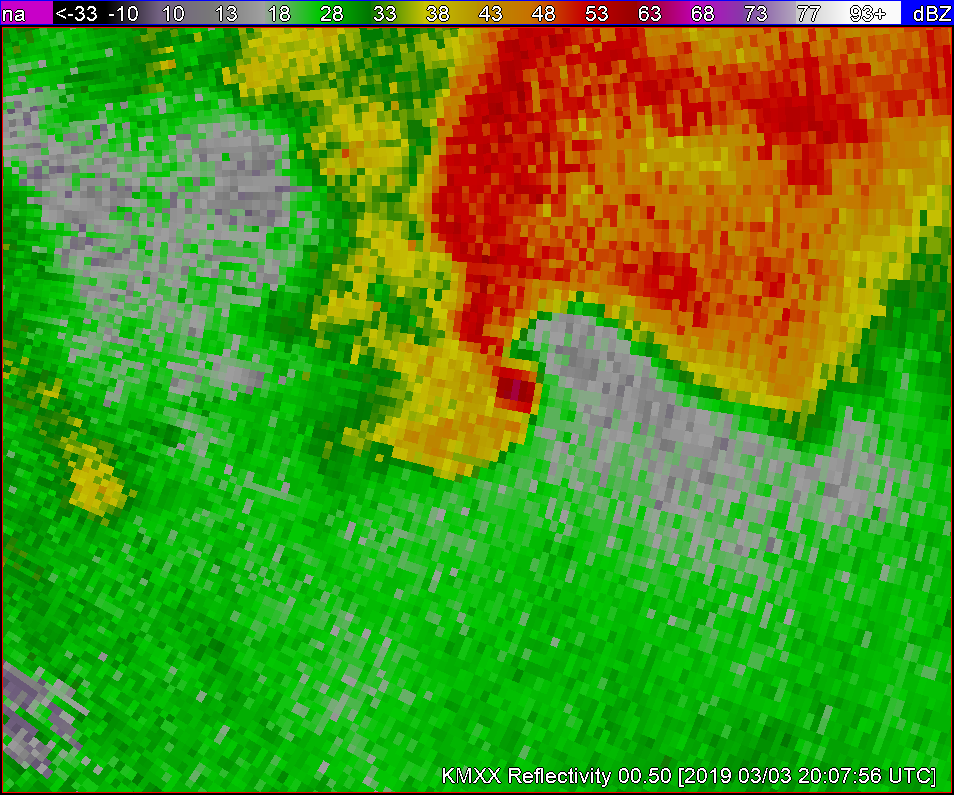
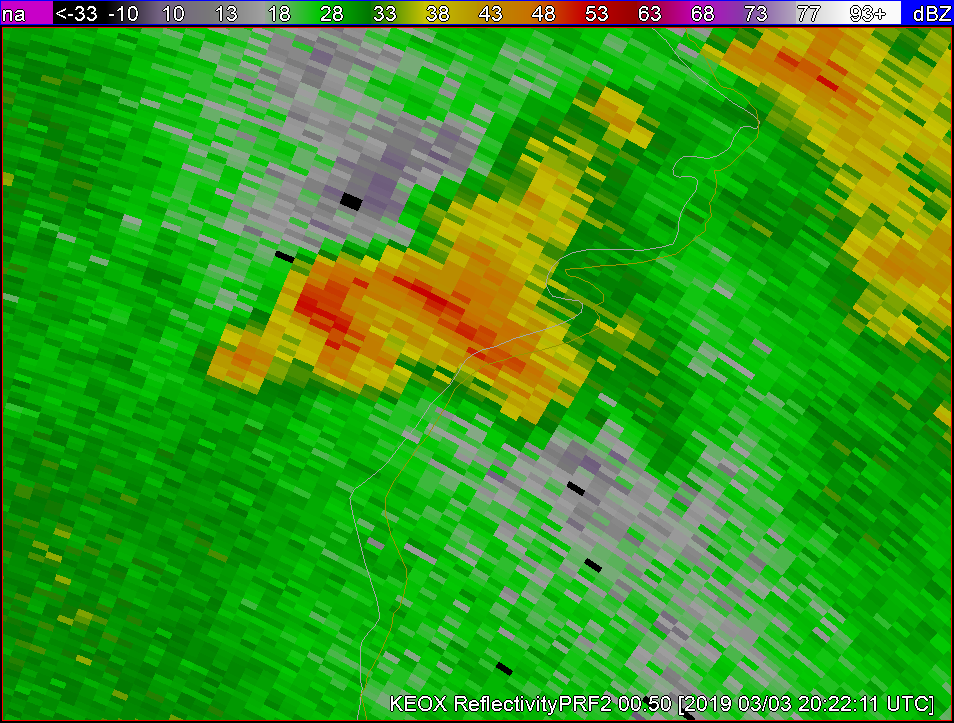
#MarfaFront


Using AzShear to Forecast for Large Areas

Analyzing the tornadic signatures on the KMXX RDA. This storm is quite obviously already tornadic with an apparent hook echo on reflectivity as well as very strong gate to gate velocity couplets through multiple levels. If I were to use AzShear in conjunction with the plethora of other available tools I would want the product to help me identify areas that are not as well developed as others.

In a case like this I’m not sure how much AzShear would help me forecast what is an obvious tornado. But as I am usually responsible for a very large area to METWATCH I decided to switch to the KEOX radar and zoom out to see if AzShear would help to identify areas that aren’t such a ‘slam-dunk’.

This storm to the NE of the RDA doesnt appear to be anything more than a lower threat general thunderstorm on first glance, especially when compared to other storms in the area.

Velocity doesn’t show anything too crazy either.

BUT when I look at KEOX AzShear  there seems to be an area of shear that may lead to something…Lets see…

Following the same storm for 40 minutes  I noticed the following: The storm developed into a possibly severe thunderstorm with reflectivity dBzs in the low to mid 60s, significant velocity couplets as well as continued higher AzShear.

For the purposes of how I am required to warn customers, generally 1.5hr required lead time icelyfor a hit within 5nm, this 40 min advanced notice of a storm that has increased severity significantly would be invaluable when added to my stable of available tools to use.

***Desmond***

Single Radar Az Shear Long Case

Just before tornado formation (as in just before CC hole develops) on leading discrete supercell, Az Shear product quickly ramps up in values and would be useful in getting warning forecaster attention that there is a strengthening low-level circulation there.


Stepping back and looking at the squall line, the Az Shear product quickly allows the warning forecaster to visualize the s curvature in the squall line, and quickly isolate the central segment of the squall line that is becoming more favorably oriented with the environmental shear. Here I was able to more quickly focus attention on the segment of the line that would go on to produce a tornado.


A couple of scans later, the AzShear quickly trended up before true gate-to-gate couples appeared in the velocity product. This would help the warning forecaster get a jump on the areas of tornado formation.


Viewing angle and distance from the radar definitely important. In the images below MXX is much closer to a QLCS tornado and viewing from behind the line. While EOX is south of the line looking down the length of the line, and viewing from a greater distance. Here the low-level QLCS circulation is much more evident in MXX, while it gets lost on EOX. The area of interest is marked by the white circle on each image.


Felt the main benefit of this product may be for QLCS tornadoes, and could extend warning lead time. In the example below, a mesovortex along the line is more easily identified by viewing the AzShear product over the raw velocity data. This will allow the warning forecaster to more quickly identify the important areas along the line that will need monitoring. By expanding the color table at the top end of the color curve, it was easier to monitor the trends in the strength of the circulation. This combination could allow the warning forecaster to more quickly identify a circulation and start drawing up a warning while monitoring the trend of that circulation as input to the warning decision. Overall feel this could really help forecasters extend warning lead times on QLCS tornadoes by a couple of volume scans. This is a huge help as these tornadoes are already the hardest to warn on with lead time.

— warmbias —

Orca Likes His AzShear

On MXX the Hook, Strong MESO, and TVS from 1950-2008, with the cell heading N of Phenix City,  the products  lined up really well with AzShear and added confidence in locating TVS and projecting track.  After 2008z on MXX new color scheme proved itself viable, highlighting the top end of the scales.

@2020z On MCV to S of MXX radar the forming TVS was caught about one-two VS earlier on AZ Shear than the Vel displayed any strong couplet

~ 2000z On a discrete cell ahead of the LEWP, AZ Shear had similarly stellar performance from EOX radar and high-end values lined up well with Hook, G-G shear and the tornado track

From the EOX radar the in the QLCS ~ 2016z, the AZShear did really well spotting the shear 3-4 Volume Scans prior to any exaggerated Ref/Vel signatures, this was impressive

Another score for AZShear on QLCS FC track ~ 2140, several Volume Scans prior to touchdown, the new color table >.02 and no real definitive SRM or Reflectivity signature to help out!

I’d really like to see this product in the field, ASAP!!

Fun 30 minutes of storms in Florida

There was a nice area of convection moving off the east coast of Florida with storms forming off an apparent outflow boundary moving to the south. As the storms moved off the coast they increased intensity exponentially. Focusing on these storms as they moved over water reflectivity showed max dBzs in the low to mid 60s with tops 45-50k ft high. GOES-16 Event density (5min-1min update) showed a value of 247 suggesting a nice updraft, which AzShear seems to further support with a bright white color and value of .007s^-1 exactly where the max dBzs/echo tops/GLM data is. In addition,prob severe did a good job of tracking the storms…but with the storms moving off the coast it is impossible to get any storm reports to verify its accuracy.

Utilizing all of this data I would most definitely want to issue a localized small craft or some sort of marine advisory or warning…if there was one for this are. -Desmond

AzShear .007s^-1

GOES-16 Event density (5min-1min update)

Max dBzs in the low to mid 60s


AzShear at Large Distances from the Radar

In one case of a tornado embedded within the QLCS, the AzShear signatures  from both radars were nearly 100 km away. In both instances, the signature was displaced northward from the tornado path. From KEOX, the tornado path was 107.8km from the radar and was looking at approximately 1.8km up in the storm. From KMXX, the storm was 89.9km from the radar and looking at 1.4km in the storm.  Something to consider for training is the distance from the radar and any tilt from the storm.

KEOX AzShear, Ref, SRM at 2036Z.
KMXX AzShear, Ref, SRM at 2036Z.

Also interesting, is that KMXX, looking slightly closer and lower, shows a stronger AzShear signature than KEOX (0.016 s^-1 vs 0.006 s^-1). So, still a best practice is looking at multiple radars if looking at single radar AzShear, or look at the MergedAzShear 0-2km products. However, it has been noted that the mergedShear products may be more useful for QLCS type storms, vs. supercell storms.
_____________________
A little while later…

A long-tracked supercell ahead of the line exhibited very high AzShear values early in its lifetime (as high as 0.03 s^-1), but as the storm moved away from the radar, the AzShear values tended to decrease. At first, it was thought this was merely coinciding with the distance from the radar (160km at time of first image below) and how high in the storm the radar is looking (3km), however, there may also be some information about the strength of the tornado at that distance. At 160km, the AzShear strength dropped to around 0.006 s^-1. However, a short time later, there was another strong AzShear signature (>0.01s^-1) just south of there, that was also associated with a tornado path. This signature was also at 160km from the radar. Curious if it could be surmised that the northern long-track tornado was not at strong as the southern shorter track? Also of note, the southern signature was again north of the assessed tornado track.

KEOX AzShear, Ref, Vel at 2100z (Focus on end of the northern long-track tornado)
KEOX AzShear, Ref, SRM at 2120Z. (Focus on southern tornado track signature)

-Tempest Sooner