Those of us who use GR2Analyst already have access to AzShear via its NROT product. I stated elsewhere that the negative values are important, and here I’ll attempt to explain why. Below is a schematic of a Rankine vortex, which is akin to a rotating cylinder. Radial velocities are maximized at the edge of the cylinder and then drop off as an inverse function of range.
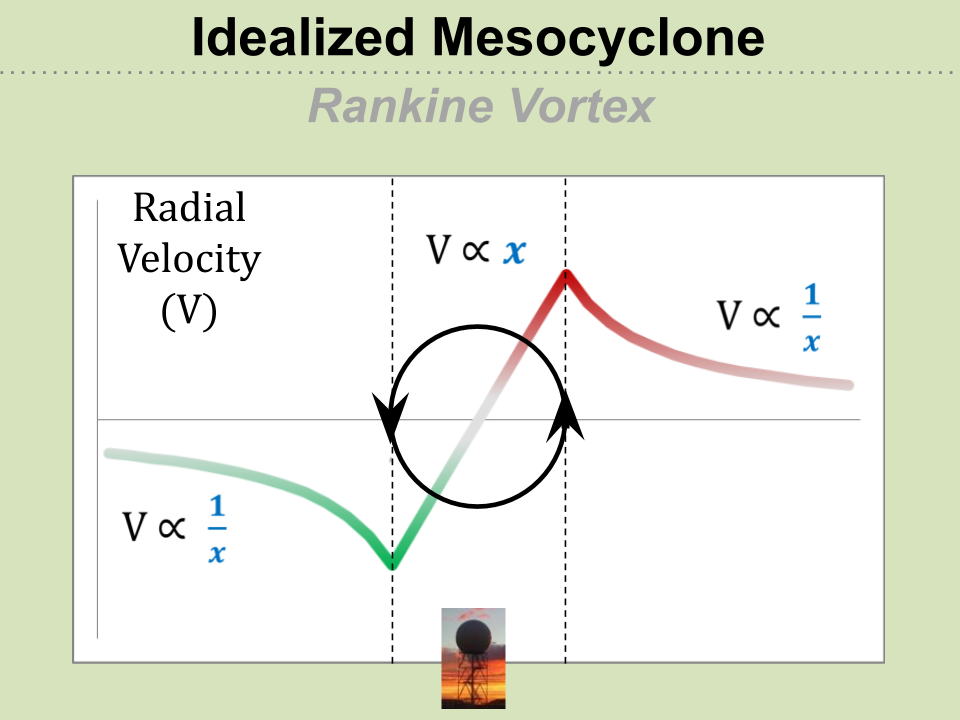
We know azimuthal shear is positive across the entire “cylinder”….
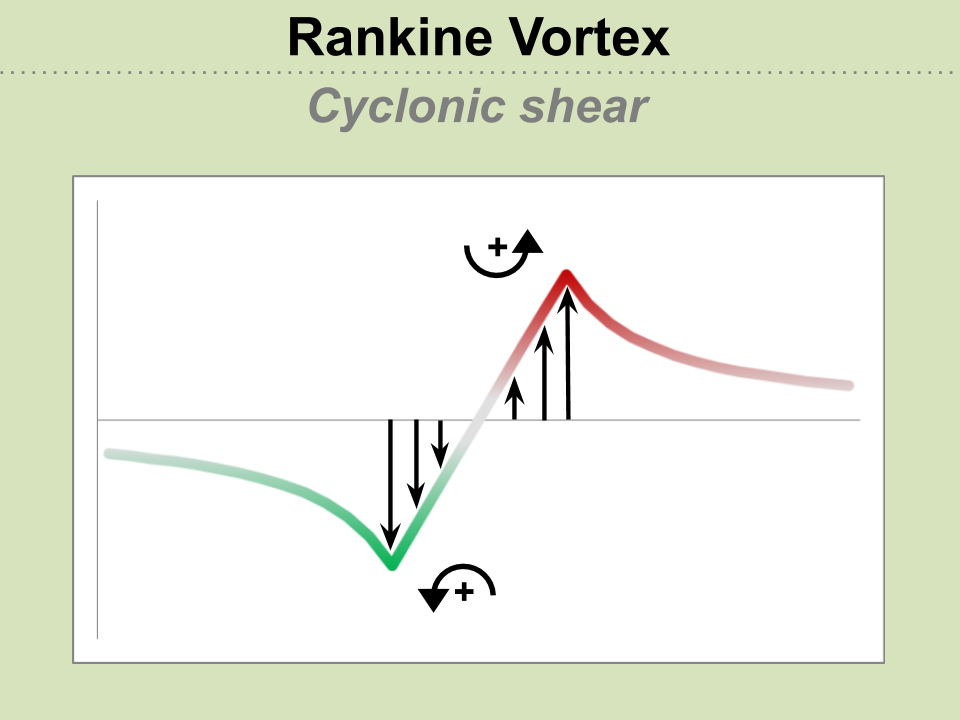
What about just outside the cylinder? If you look closely, you’ll see that there are *negative* AzShear regions on the radials that are just outside of the max/min radial velocities positions…
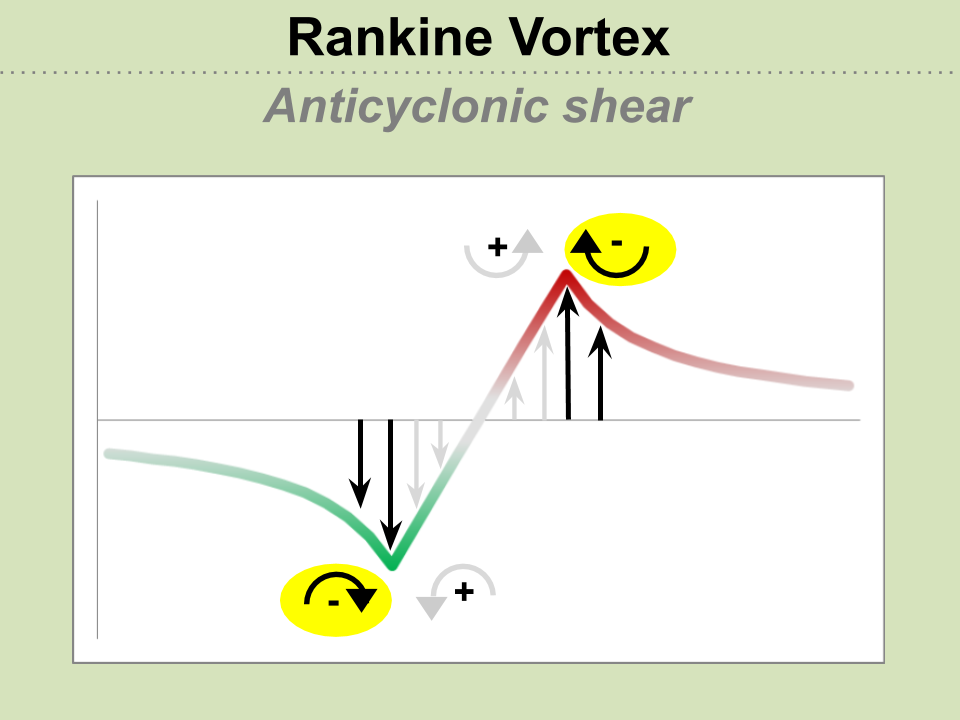
Putting it all together and thinking of azimuthal shear as a running average of shear as we move across the radials, we get a plot of AzShear that looks something like the black trace below. 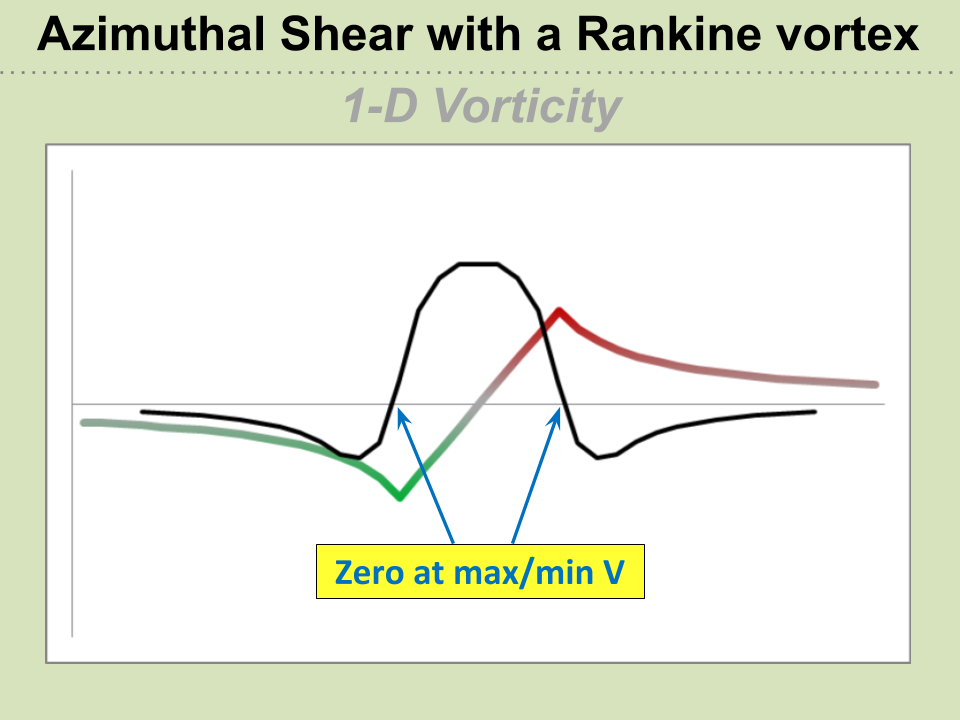
We see slightly negative AzShear regions flanking the AzShear maximum, which would be observable for a well-sampled mesocyclone, such as seen on the right hand side of the image below…
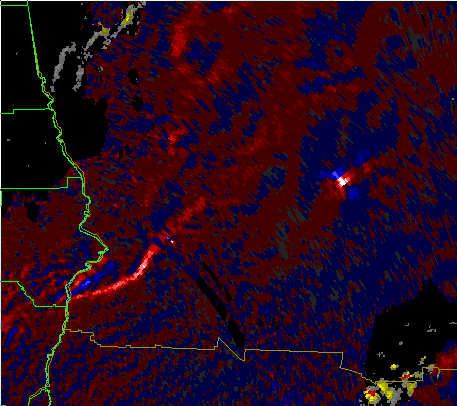
Also notice in the figure above that the maximum inbound/outbound velocities line up with where AzShear crosses zero. Now, let’s pretend we have a rear flank downdraft or RIJ surge by boosting the “inbound” side of the circulation…
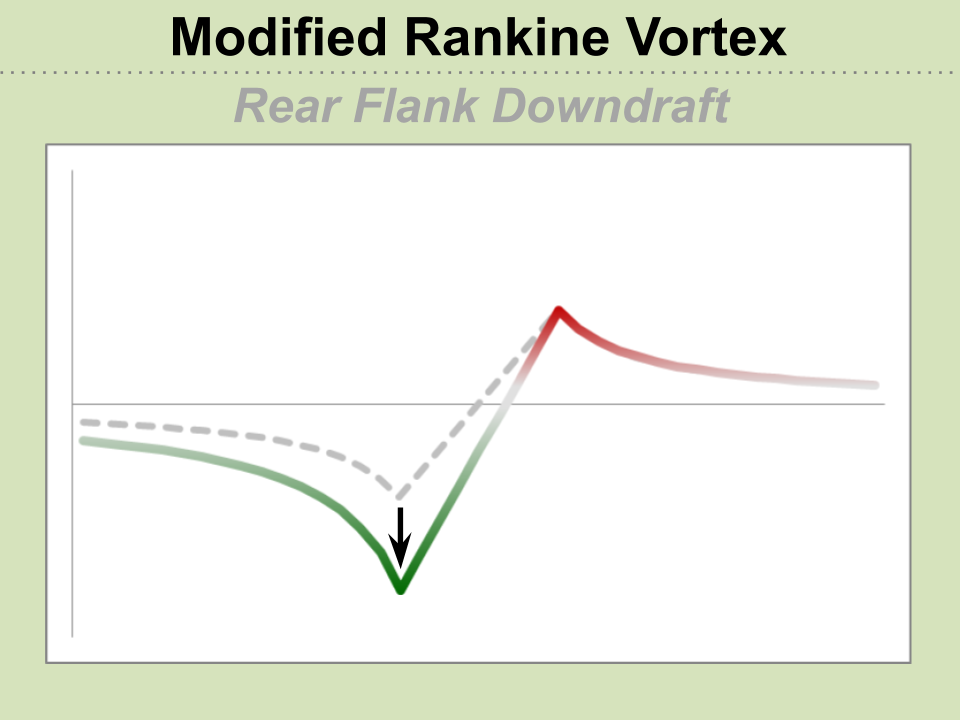
Now what does the new AzShear trace look like?
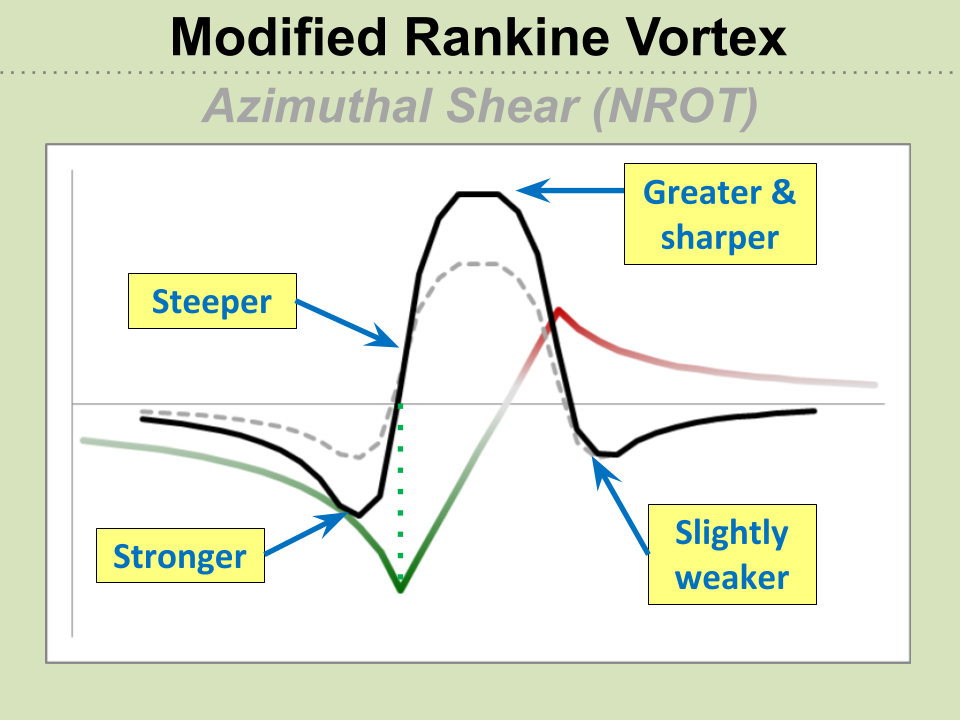
Well, we see more of an AzShear “couplet” as both positive *and* negative shear increase on either side of the surge. The maximum winds are still occurring where AzShear equals zero and this is located directly in between the AzShear maximum and AzShear minimum in conjunction with the center the surge.
I’m firmly convinced that looking between these two features is an effective way to pinpoint where the most damaging wind will occur, whether it’s tornadic or straight-line. For the smaller tornadoes that most of us get, the southern edge of the AzShear maximum is a sweet spot that has the cumulative effects of rotation, translation, and inflow to maximize winds.
#MarfaFront
