A first cut at depicting the added value of the volume browser in AWIPS for NUCAPS soundings is shown below. I messed around with vertical cross-sections and time series of NUCAPS soundings in the upwind area of the MCS in northern IL that is expected to contain some potential for new convective initiation. Below is the transect of the cross-section.

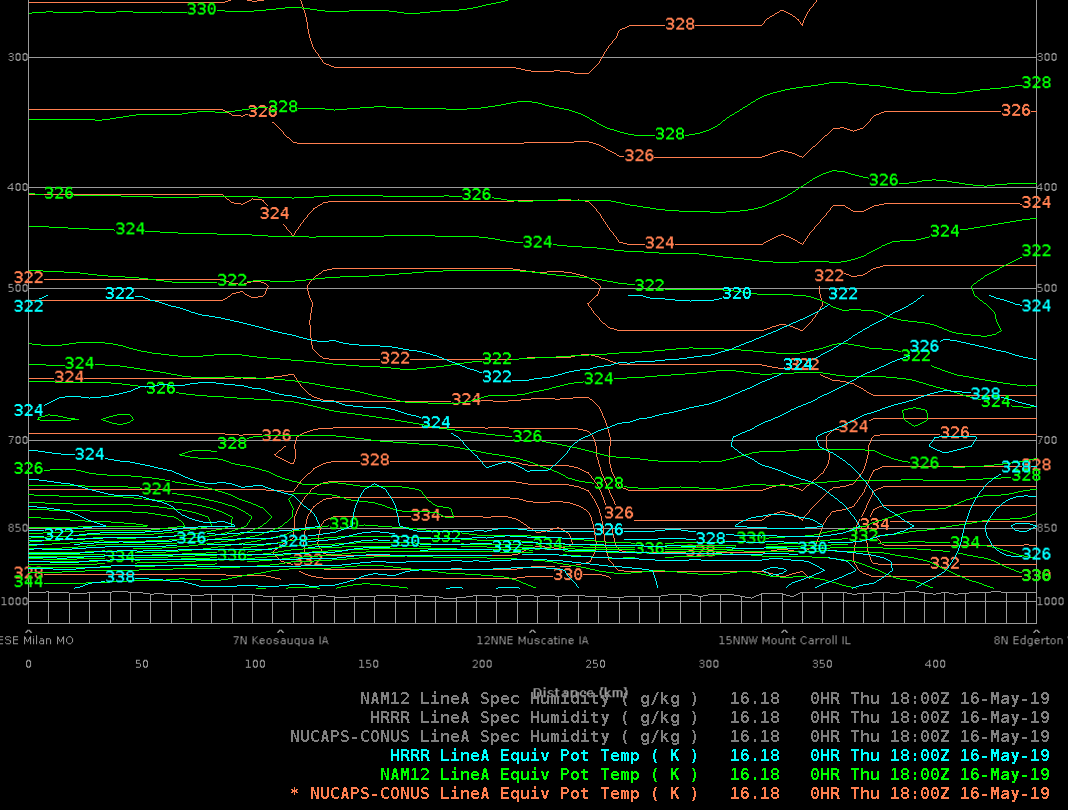
Here is the cross-section of equivalent potential temperature from NUCAPS at 18Z, NAM-12 at 18Z, and the HRRR at 18Z.

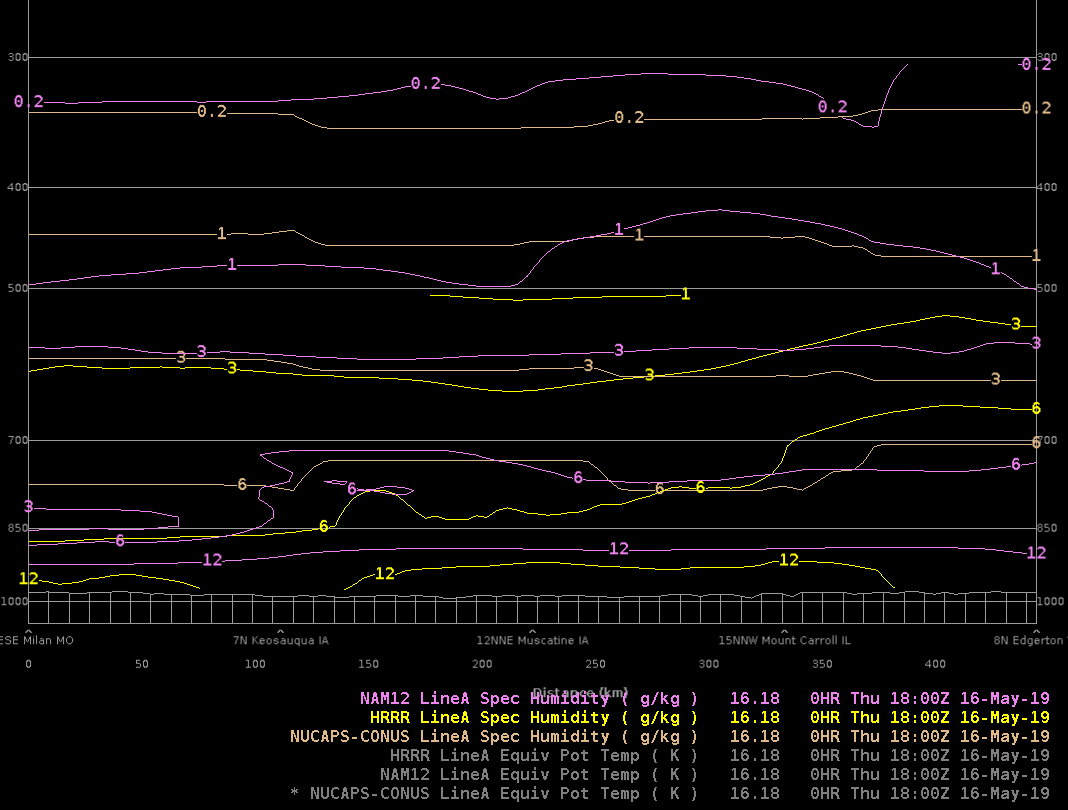
The two models and satellite soundings are in very good agreement at altitudes above 700 hPa, in less agreement between 700 and 850 hPa, and in poor agreement between 850 hPa and the surface. NAM12 is the highest with theta-e values between 336 and 344K, with HRRR about 5-10K colder, and NUCAPS still colder in the SW portion of the cross-section, and slightly warmer in the NE portion of the cross-section than HRRR. Is it because of temperature or moisture differences? It appears dominated by moisture discrepancies as shown below:

I can’t quite figure out how to plot additional (or fewer) contours (AWIPS newbie here) but its quite clear that NAM12 is the moistest and NUCAPS is much drier near the surface. The 12Z Quad Cities RAOB had 7-8 g/kg for water vapor mixing ratio but with the six-hour discrepancy it is challenging to establish ground truth.
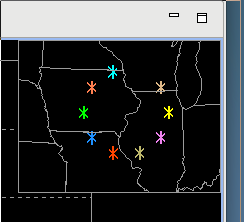
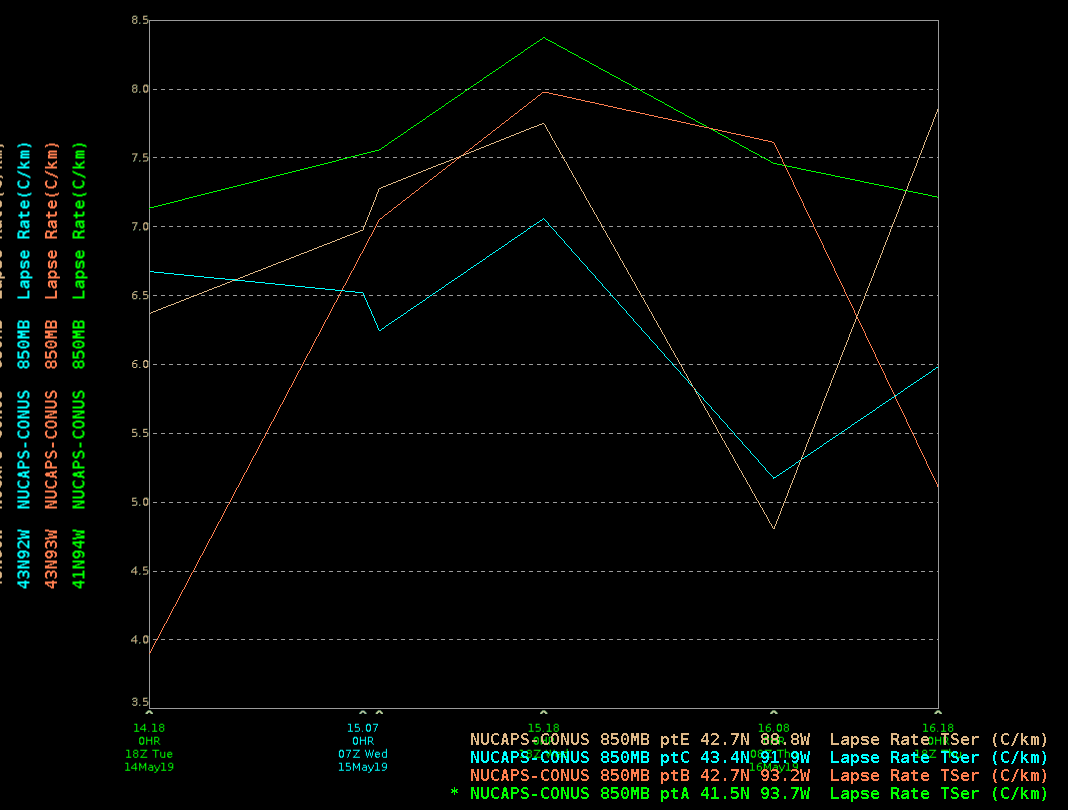
The volume browser is capable of making time series plots too. Here is a ring of points depicting time series of 850 hPa temperature lapse rates over the last few days of soundings:

The time series plot is shown below. A two-day time series of sparse satellite soundings isn’t all that insightful, but using this for 0-6 hour NUCAPS-FCST products (in comparison to model output) might be quite valuable for forecasters.

Brian Kahn
