Good non-severe storm with agreement from radar/satellite products

One storm became near severe around 545 pm in EWX CWA. All parameters; lightning, ProbSevere and Dual-pol radar agreed on the evolution of the storm and expected impacts. Radar data suggested there to be equal wind and hail threat based on high ZDR and KDP within the core suggesting sub-severe hail. There was some notching in the back side of the storm’s reflectivity as the front end of the storm surged eastward suggesting some wind threat. Lightning over this time had increase from 10 fl/min to 20 fl/min about 15-20 minutes prior to the development of some weak mid level rotation. As the storm cycled and weakened, so did the lightning and ProbSevere values. An uptick in GLM event density was followed by a slight increase in ProbSevere values toward the end of the loop.

KEWX 4-panel – Refl (UL), ZDR (UR), KDP (LL), CC (LR)

KEWX 4-panel – SRM (UL), V (UR), HC (LL), SW (LR)

GLM sequence of Gillespie County storm – 1-min(FED)(UL),AFA(UR),TOE(LL),EventDensity(LR)

ProbSevere time trends from http://cimss.ssec.wisc.edu/severe_conv/plots/PSplots.php?ID=176047

— SCoulomb

HWT day 2: 19:10 GLM and AzShear observations of Missouri tornadic supercell

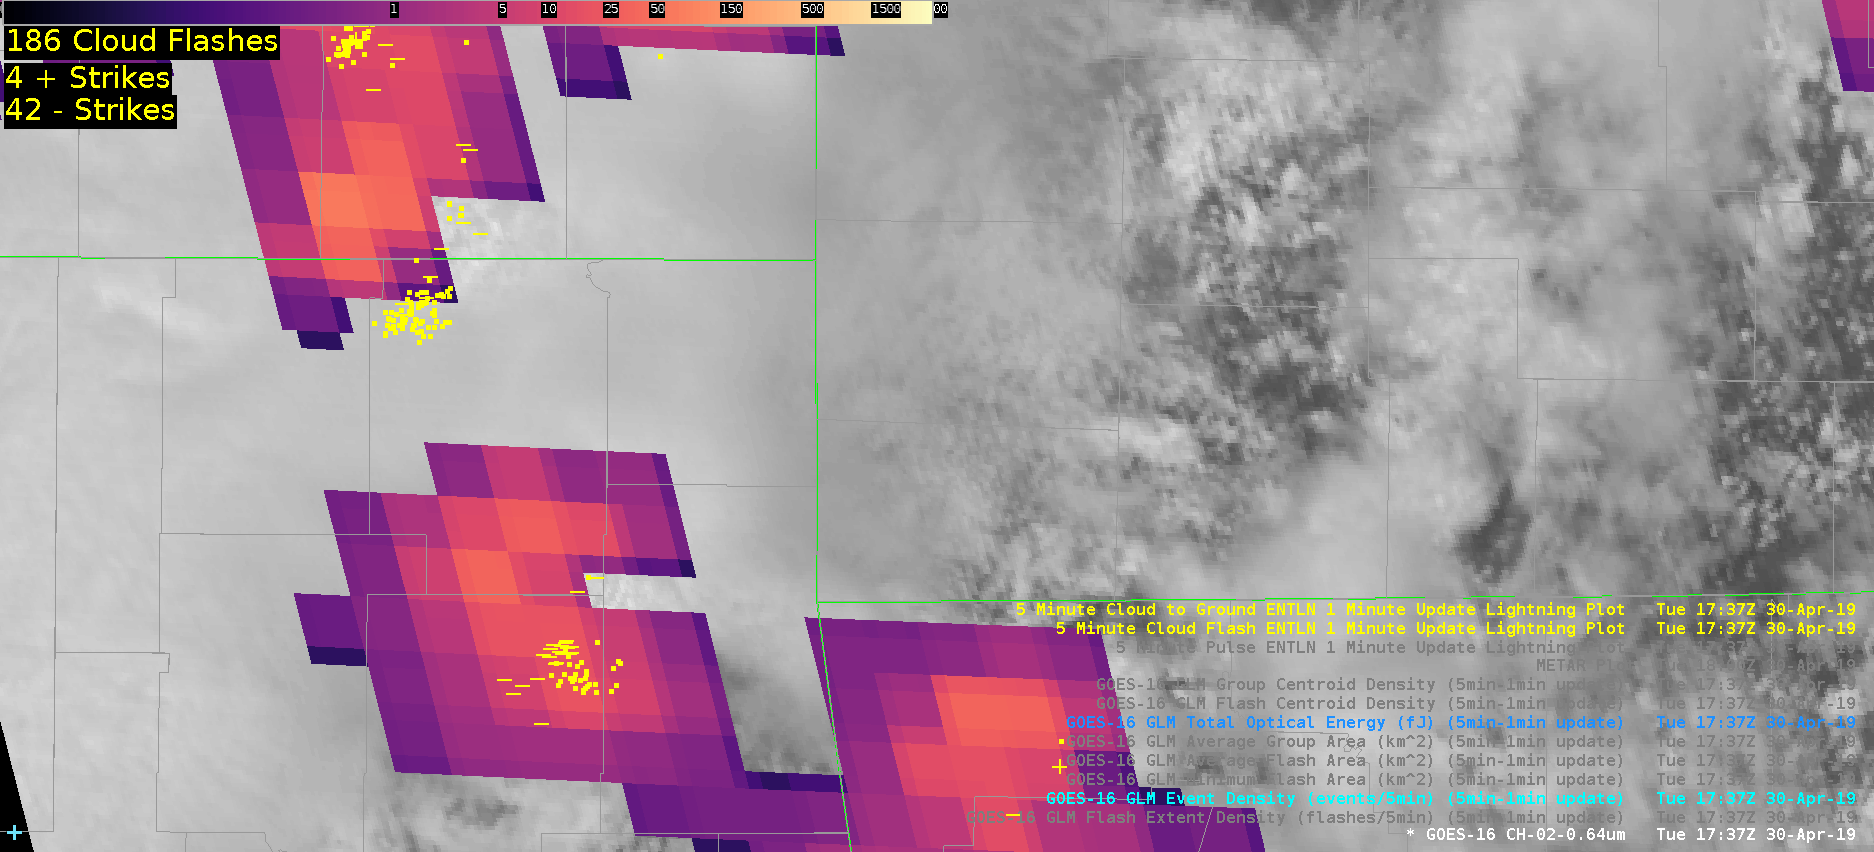
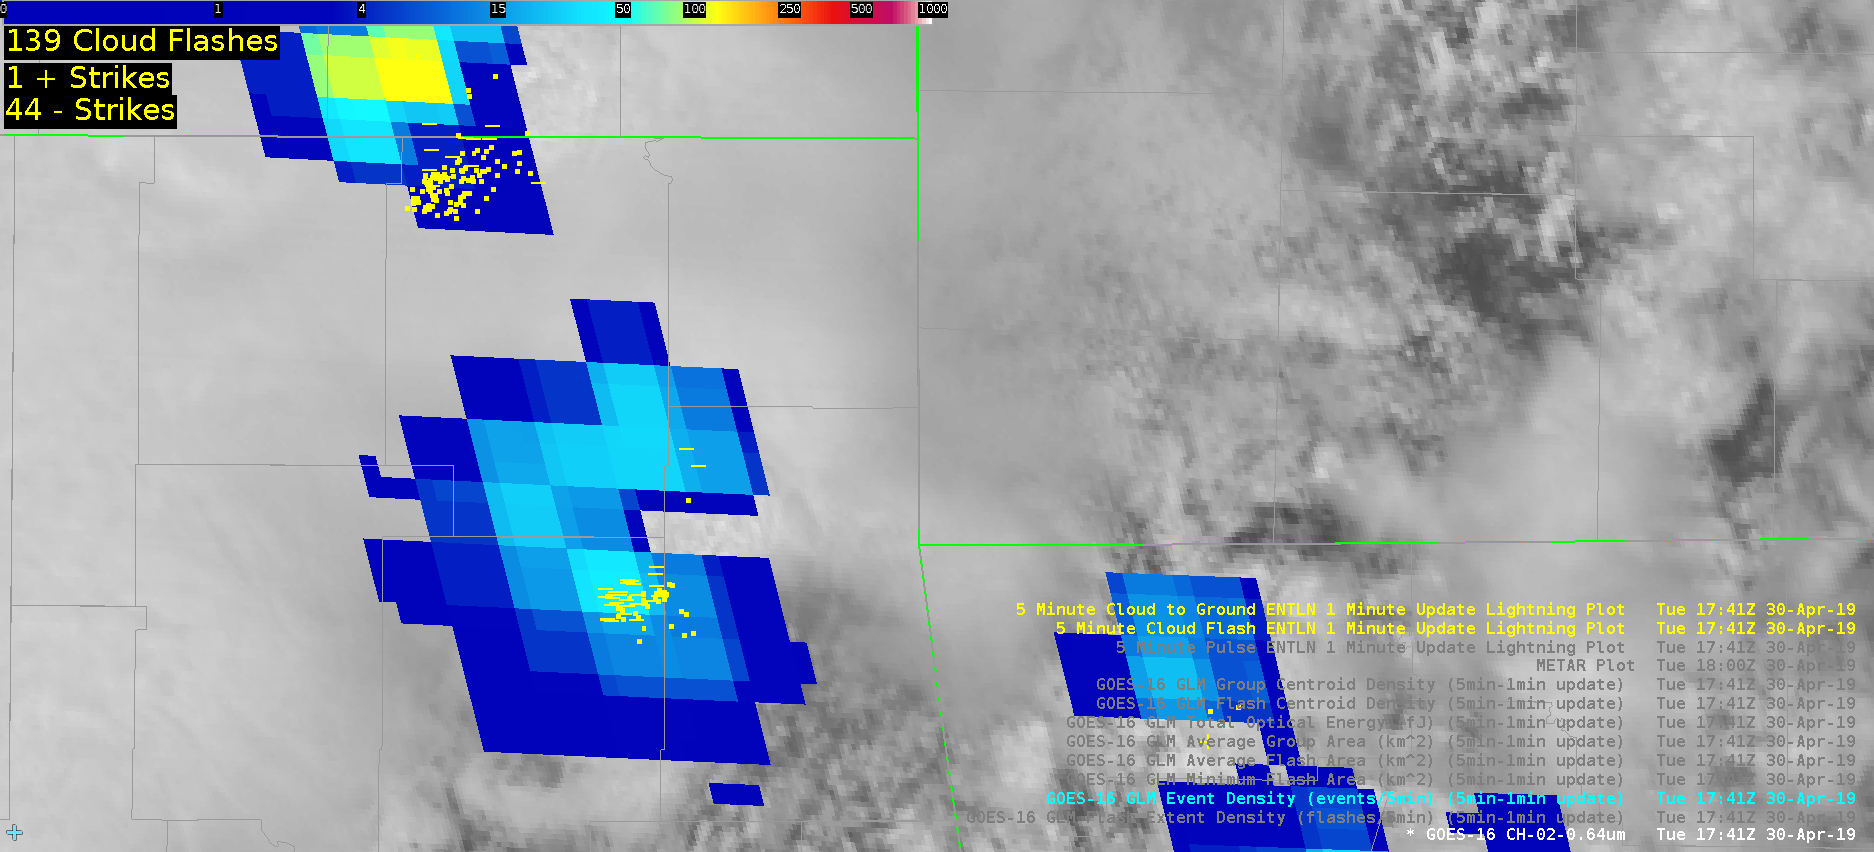
Feature following zoom showing the GLM pulsing phenomena associated with intensification/weakening of a supercell in OK/MO. During the third pulse, a TOR warning was issued.

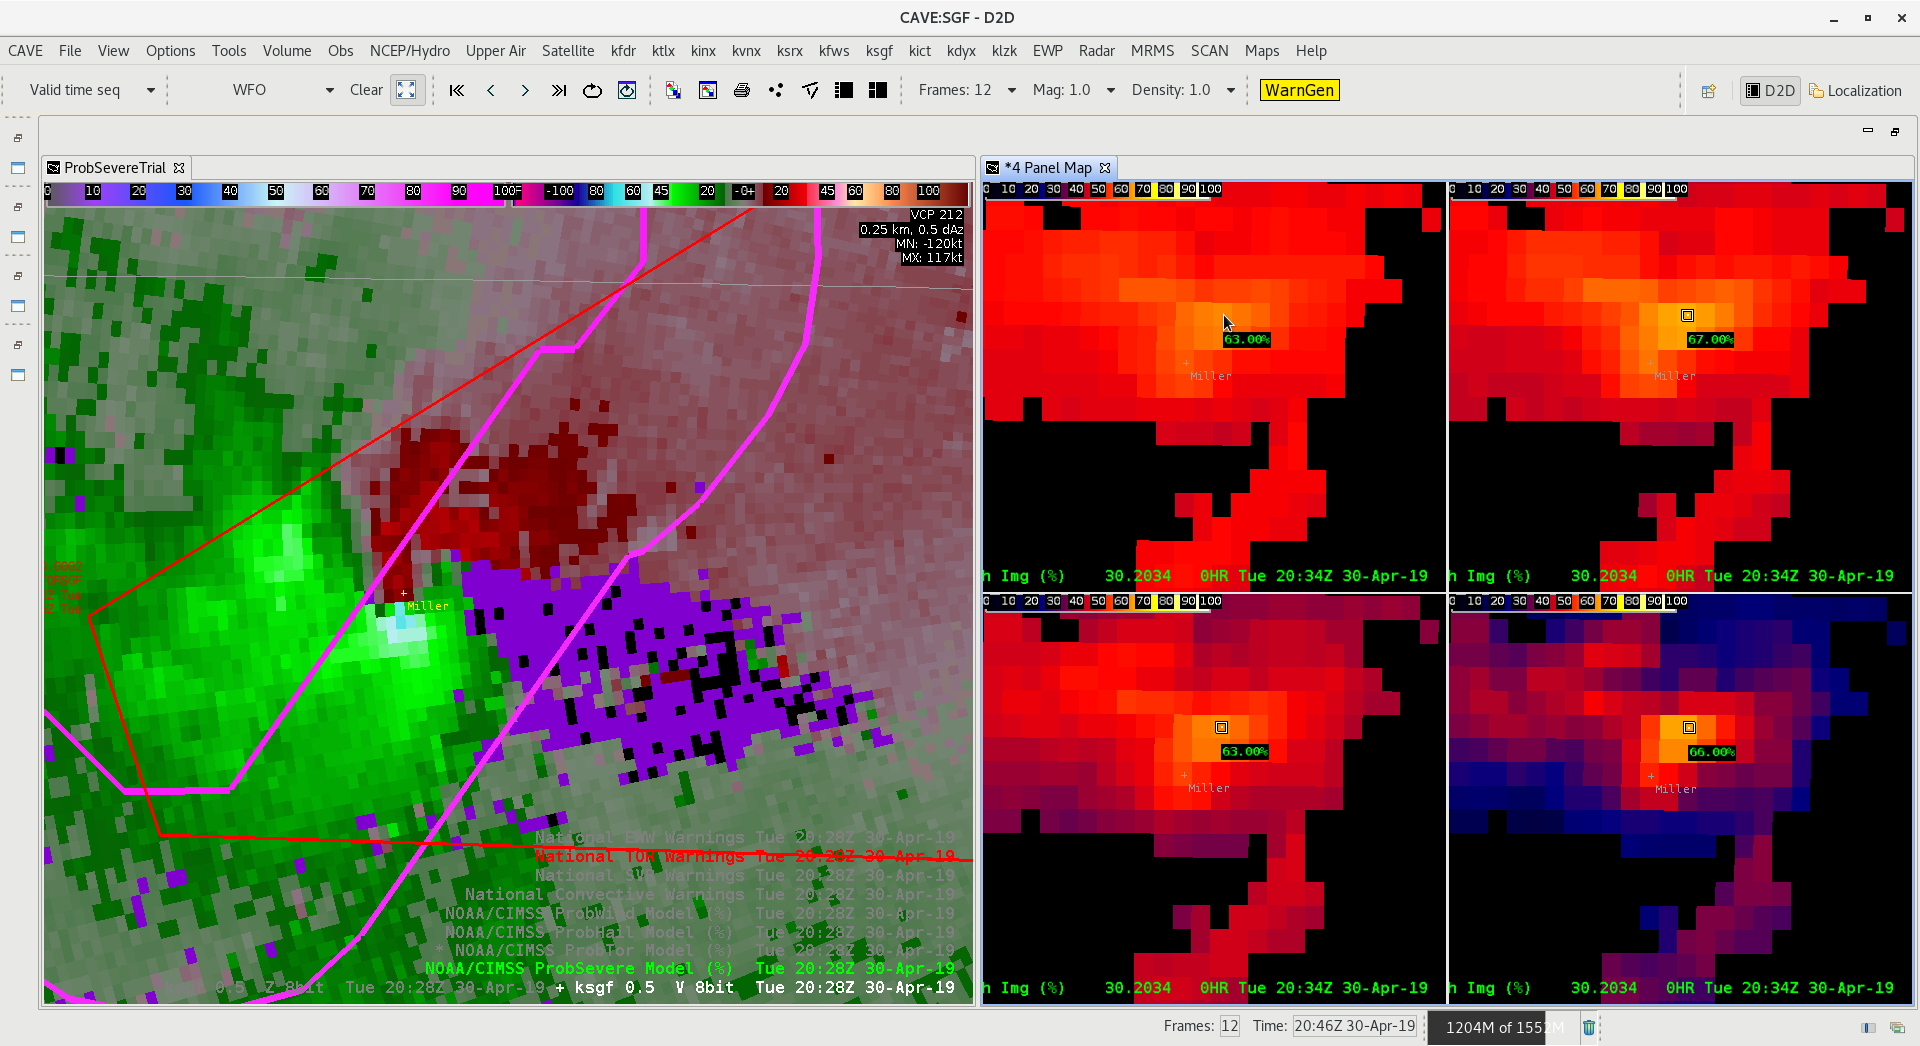
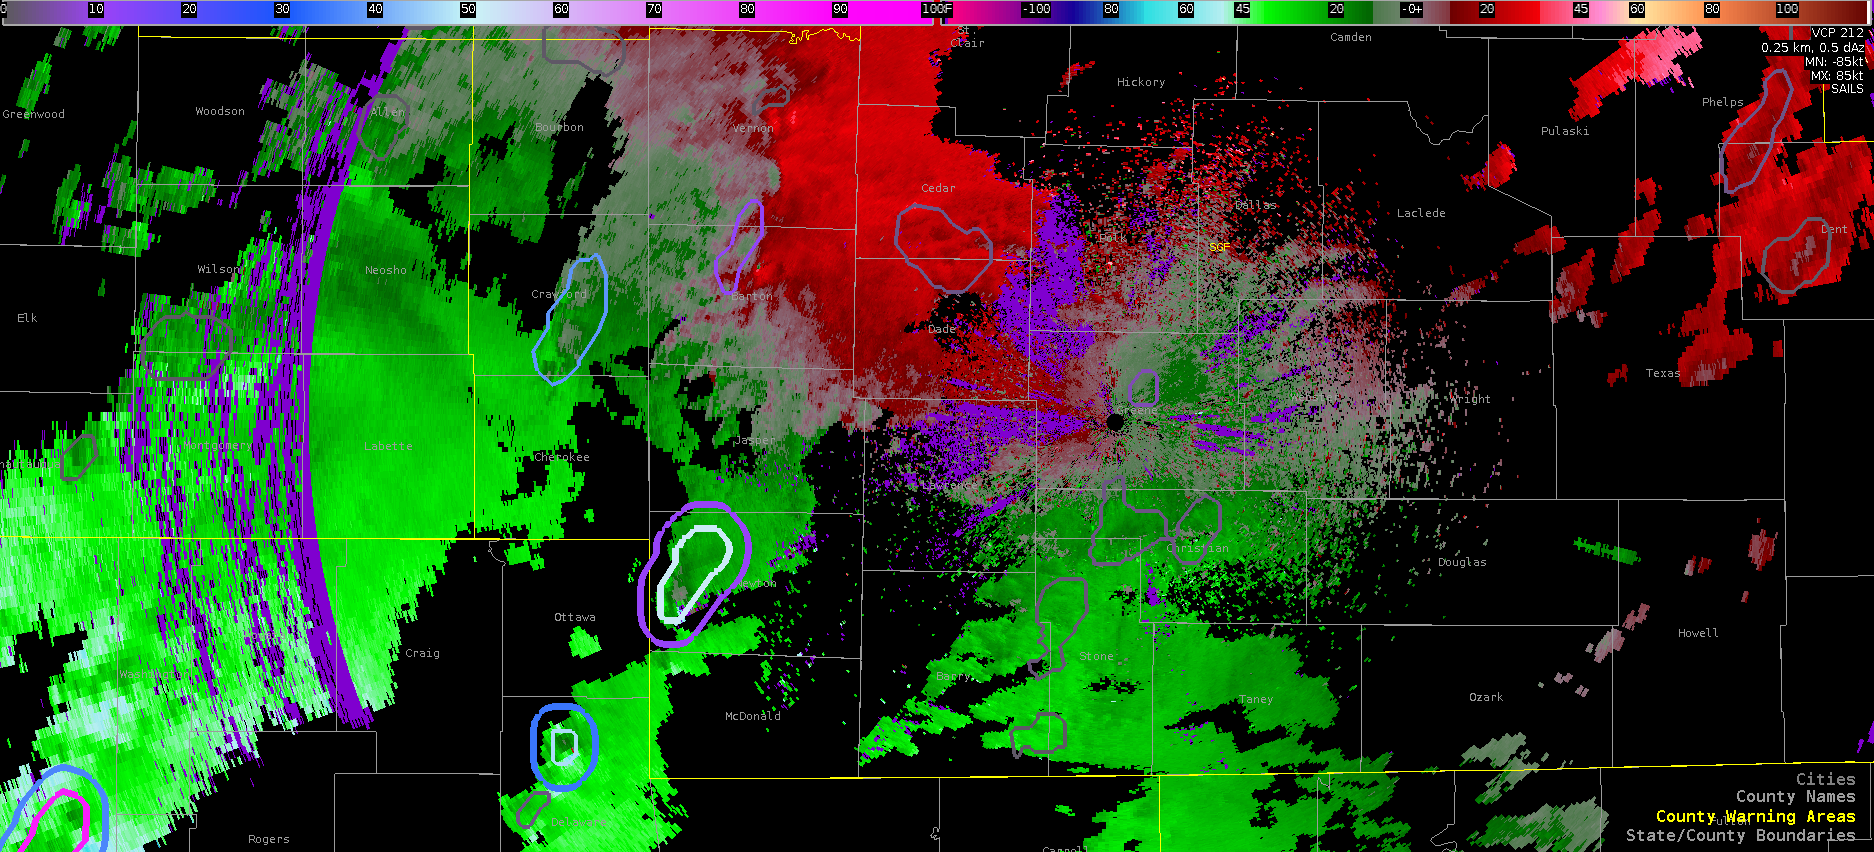
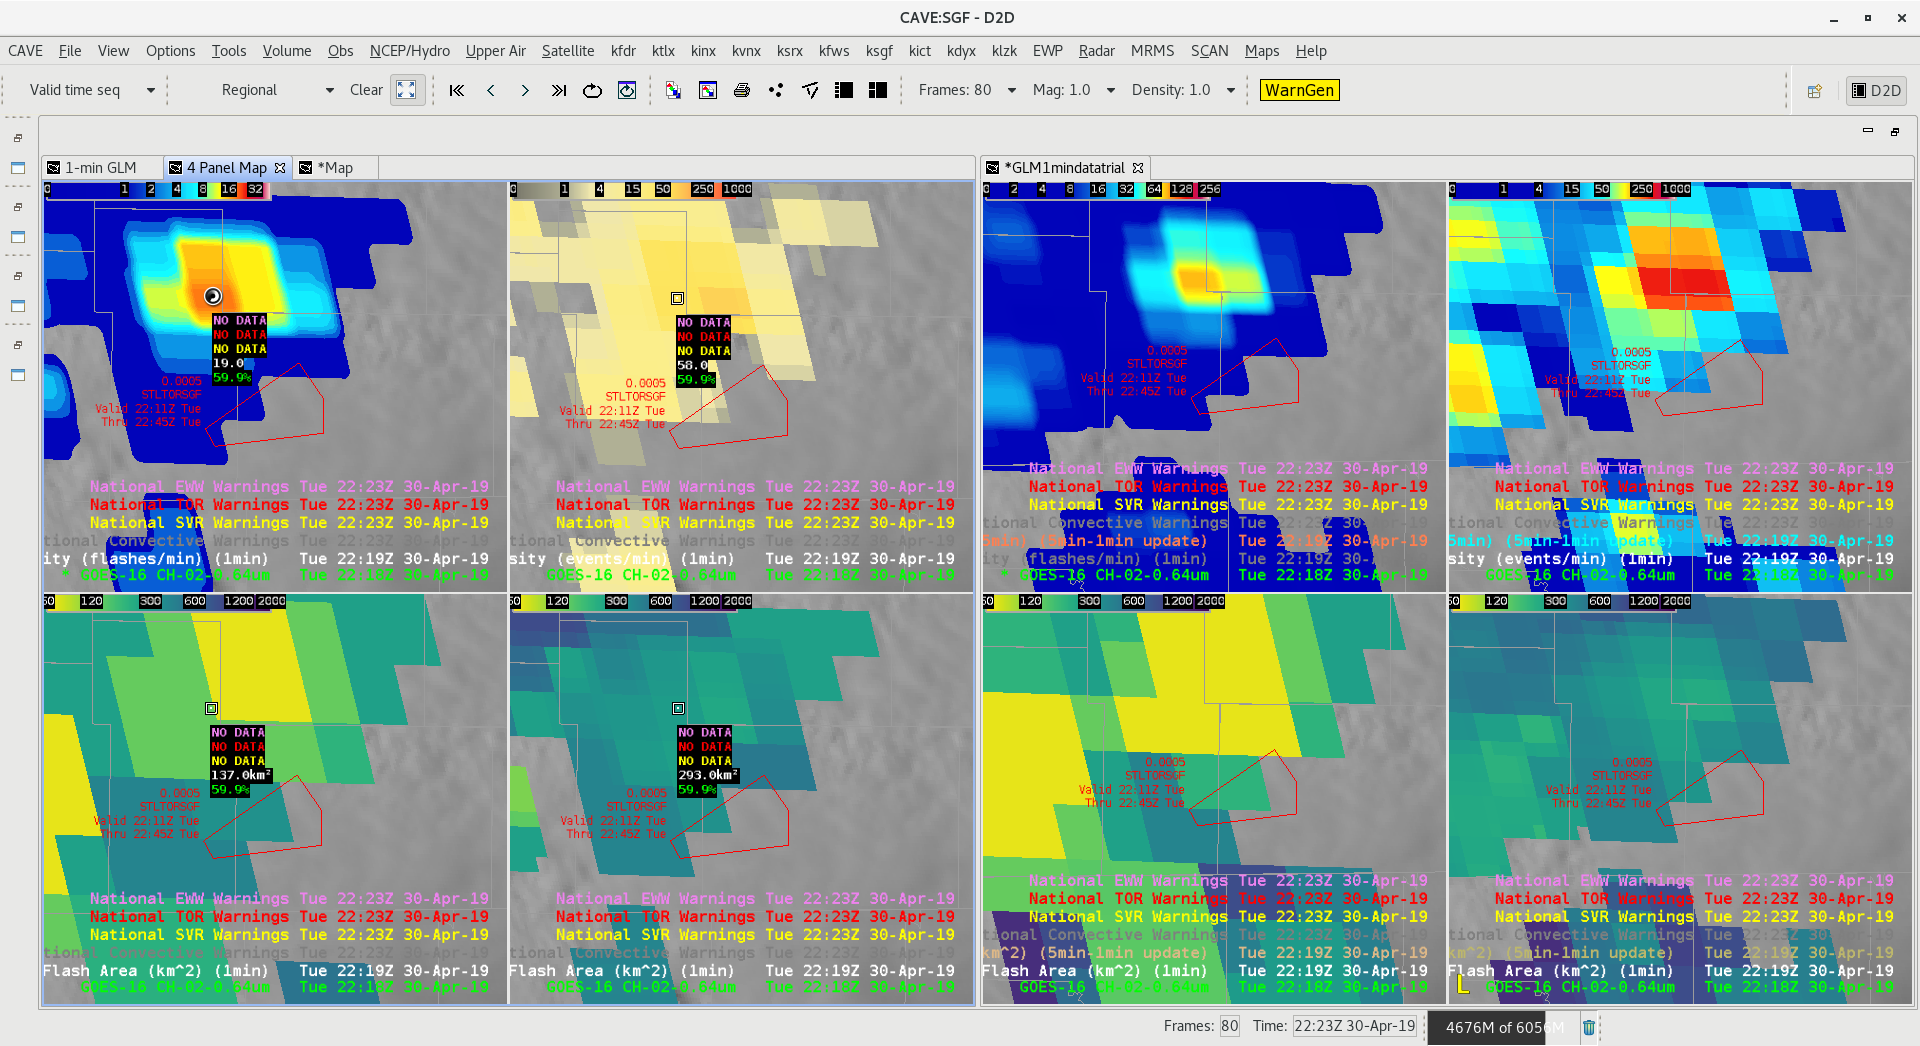
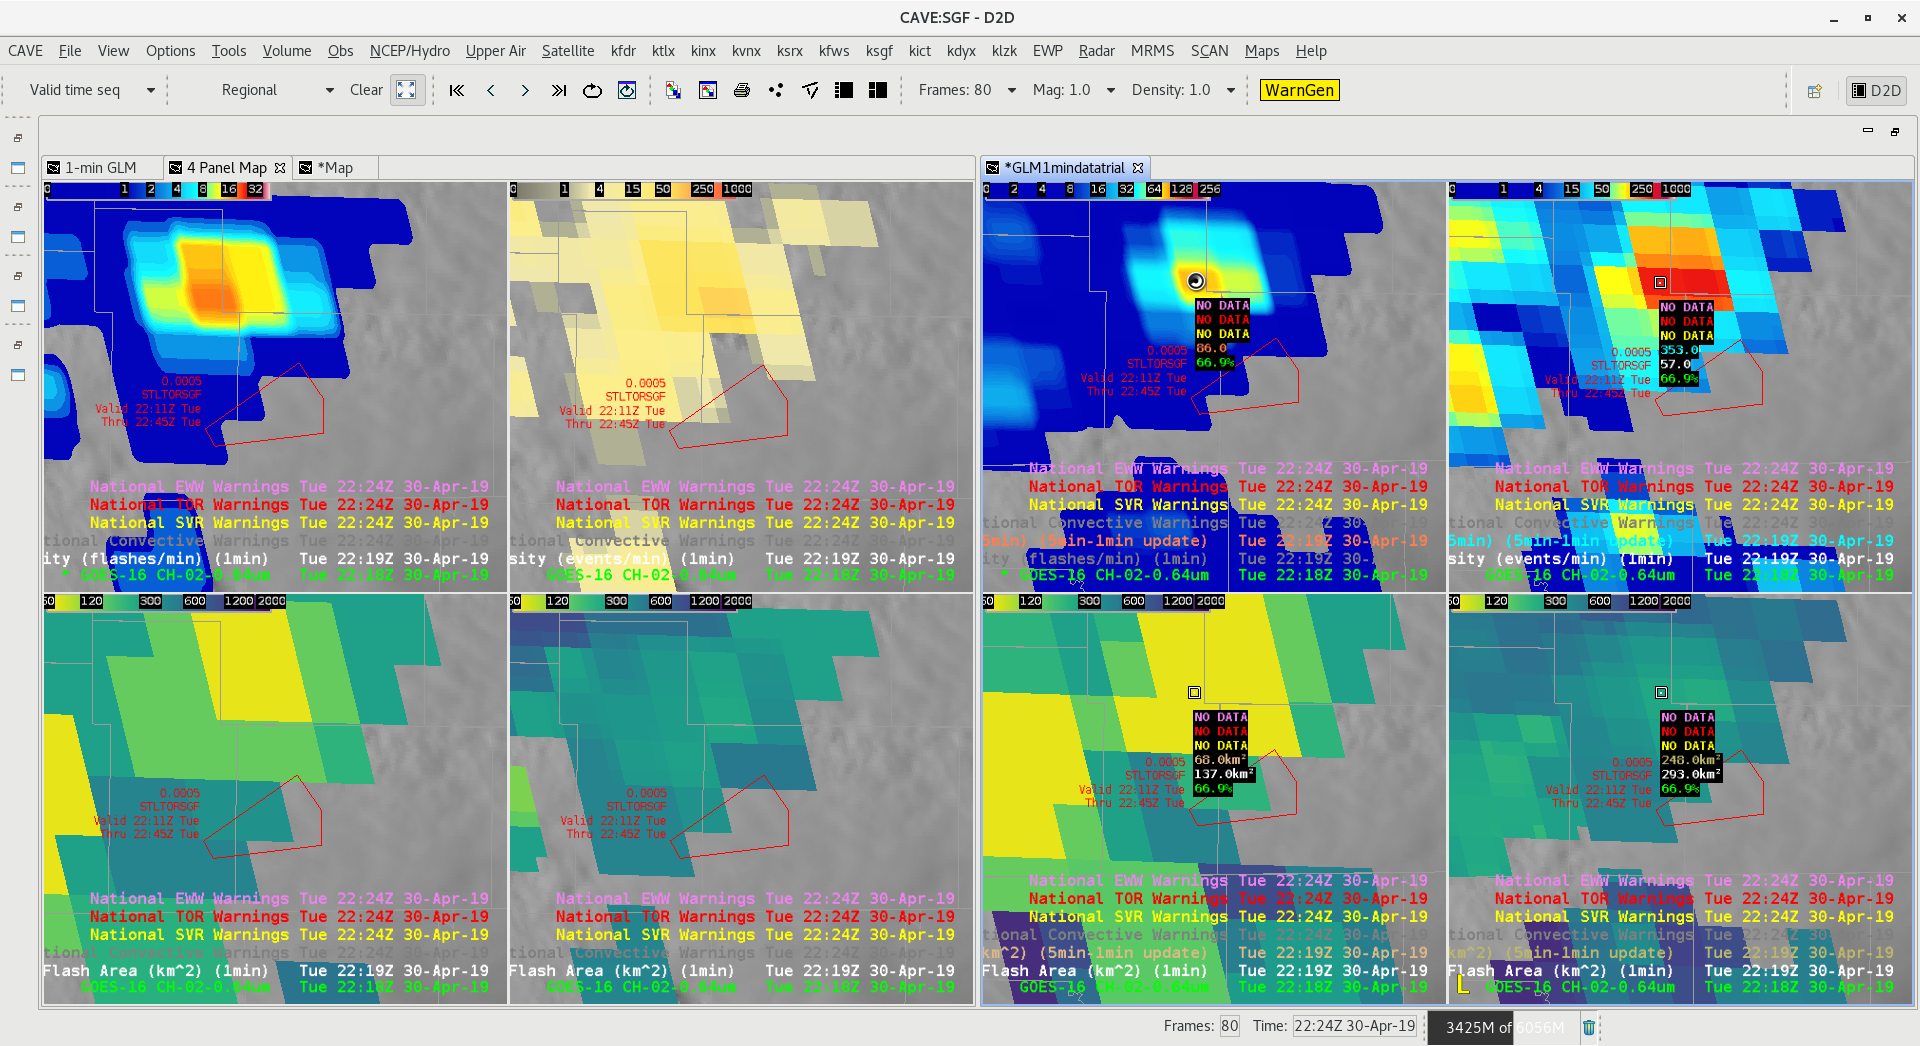
Case of CPTI values on a confirmed tornado near Miller, MO. No confirmed damage estimates yet, but TOR was confirmed at this time visually and with a TDS

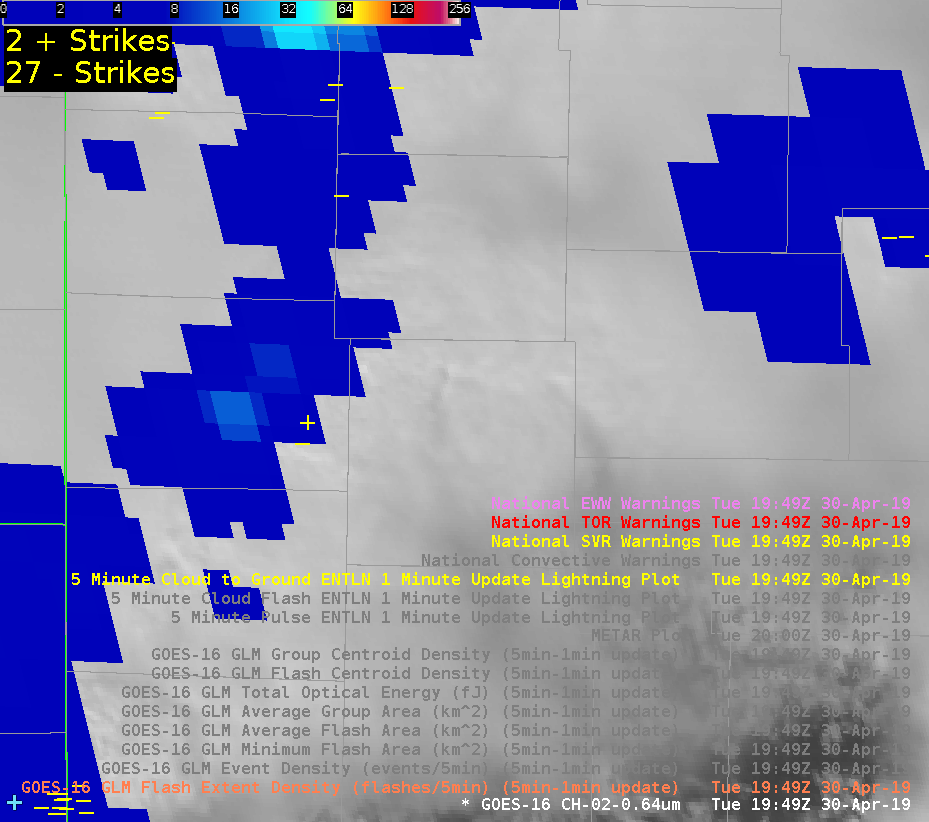
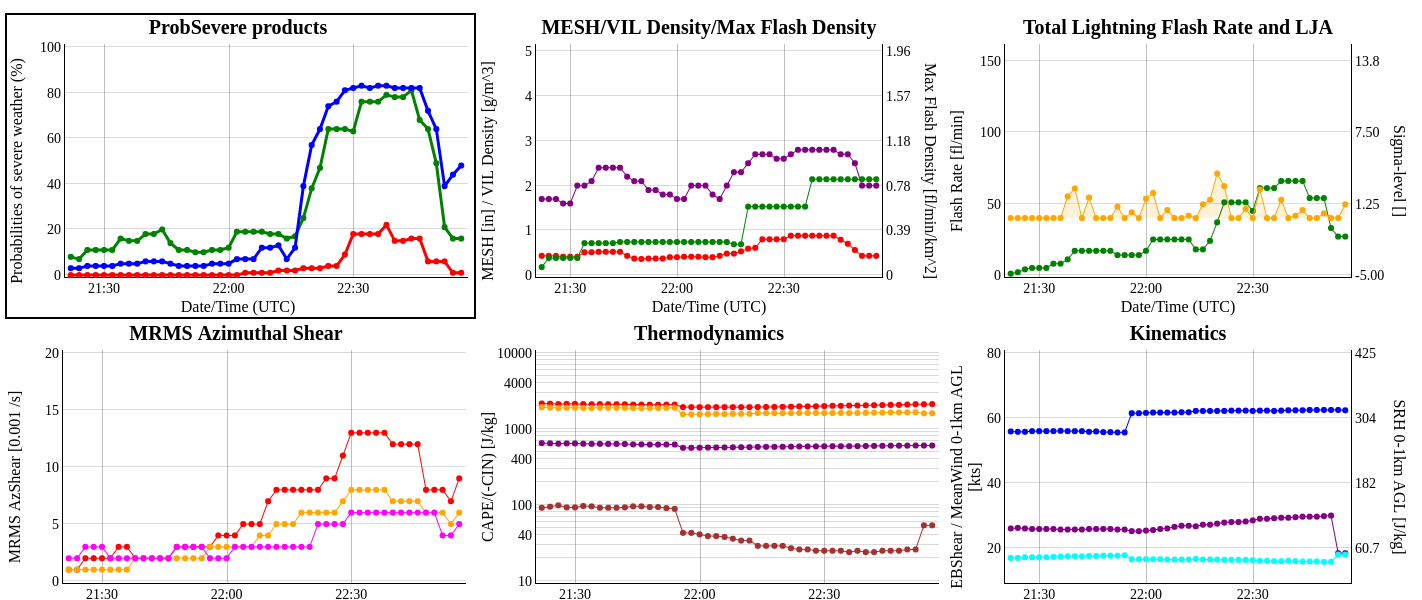
Lightning jump preceding a tornado and then confirmed touchdown in MO
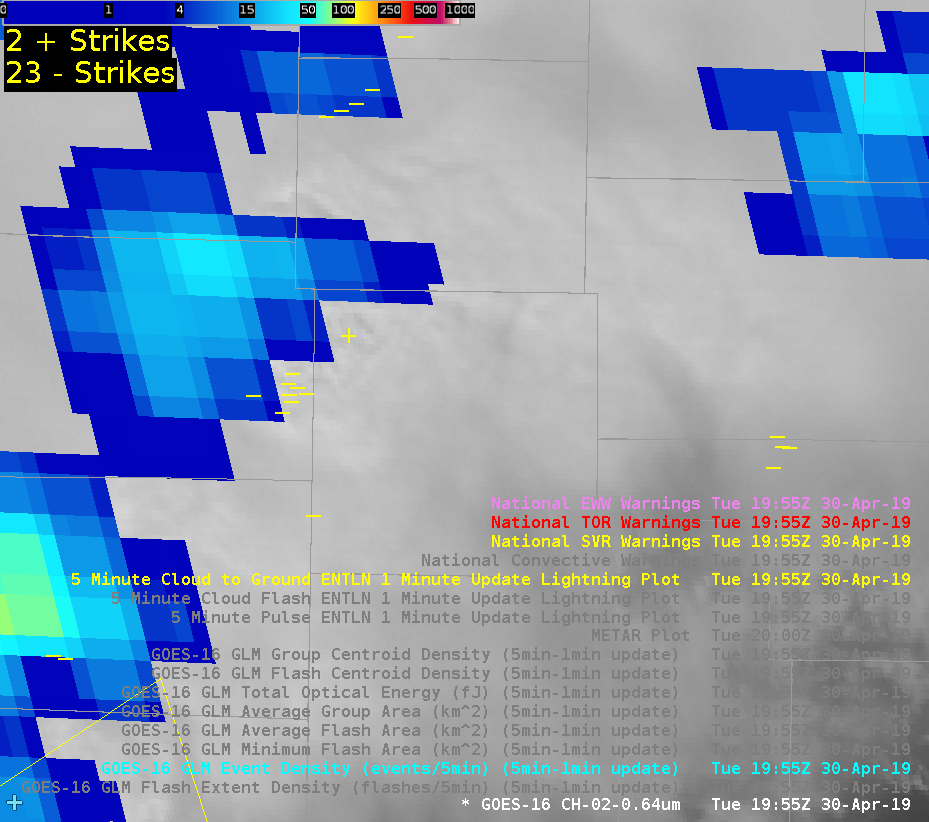
Event Density over the same cell

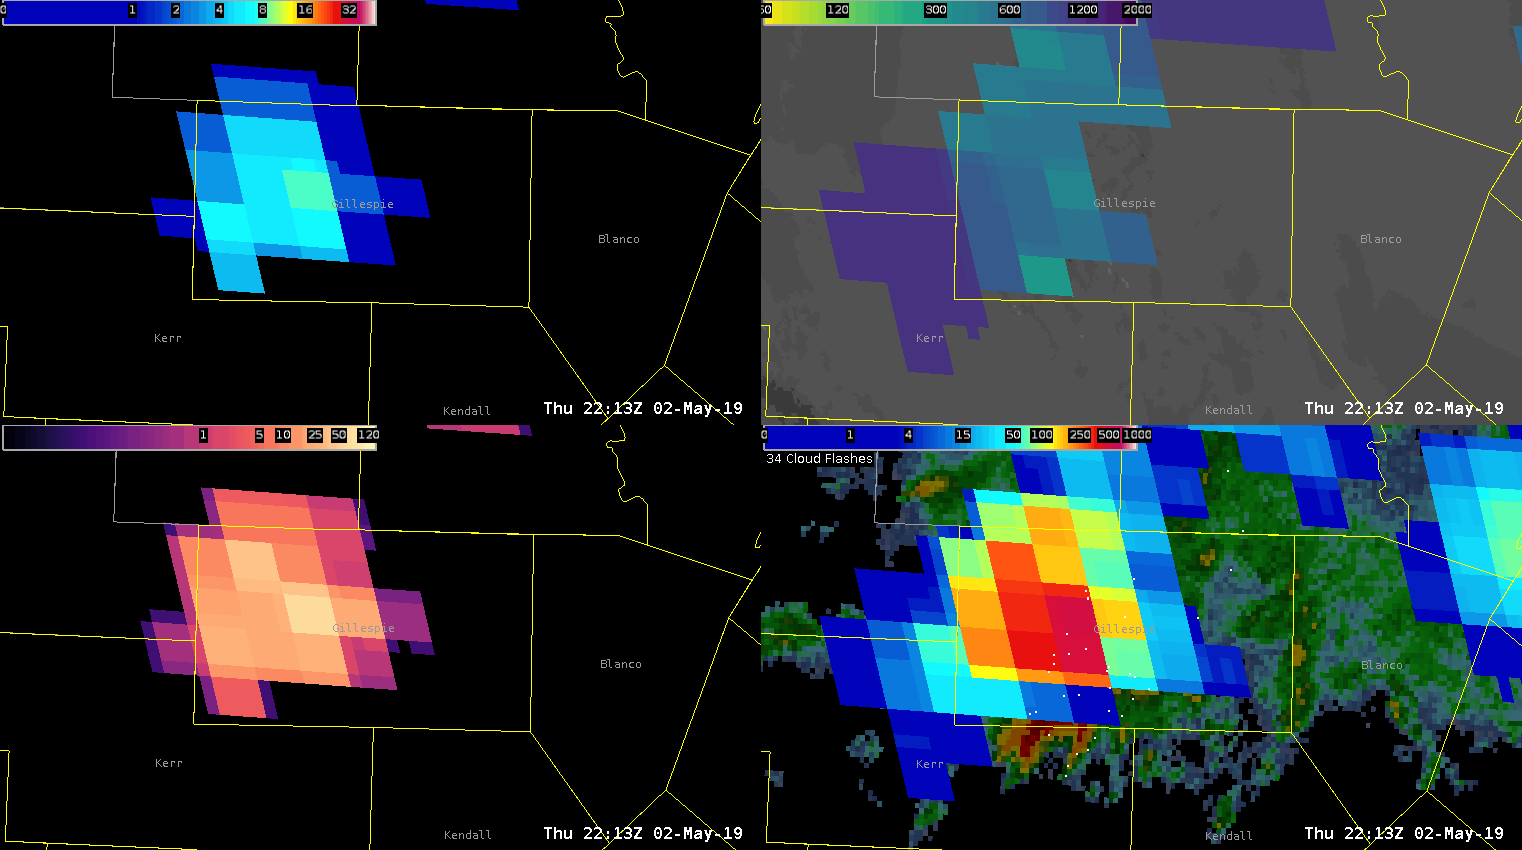
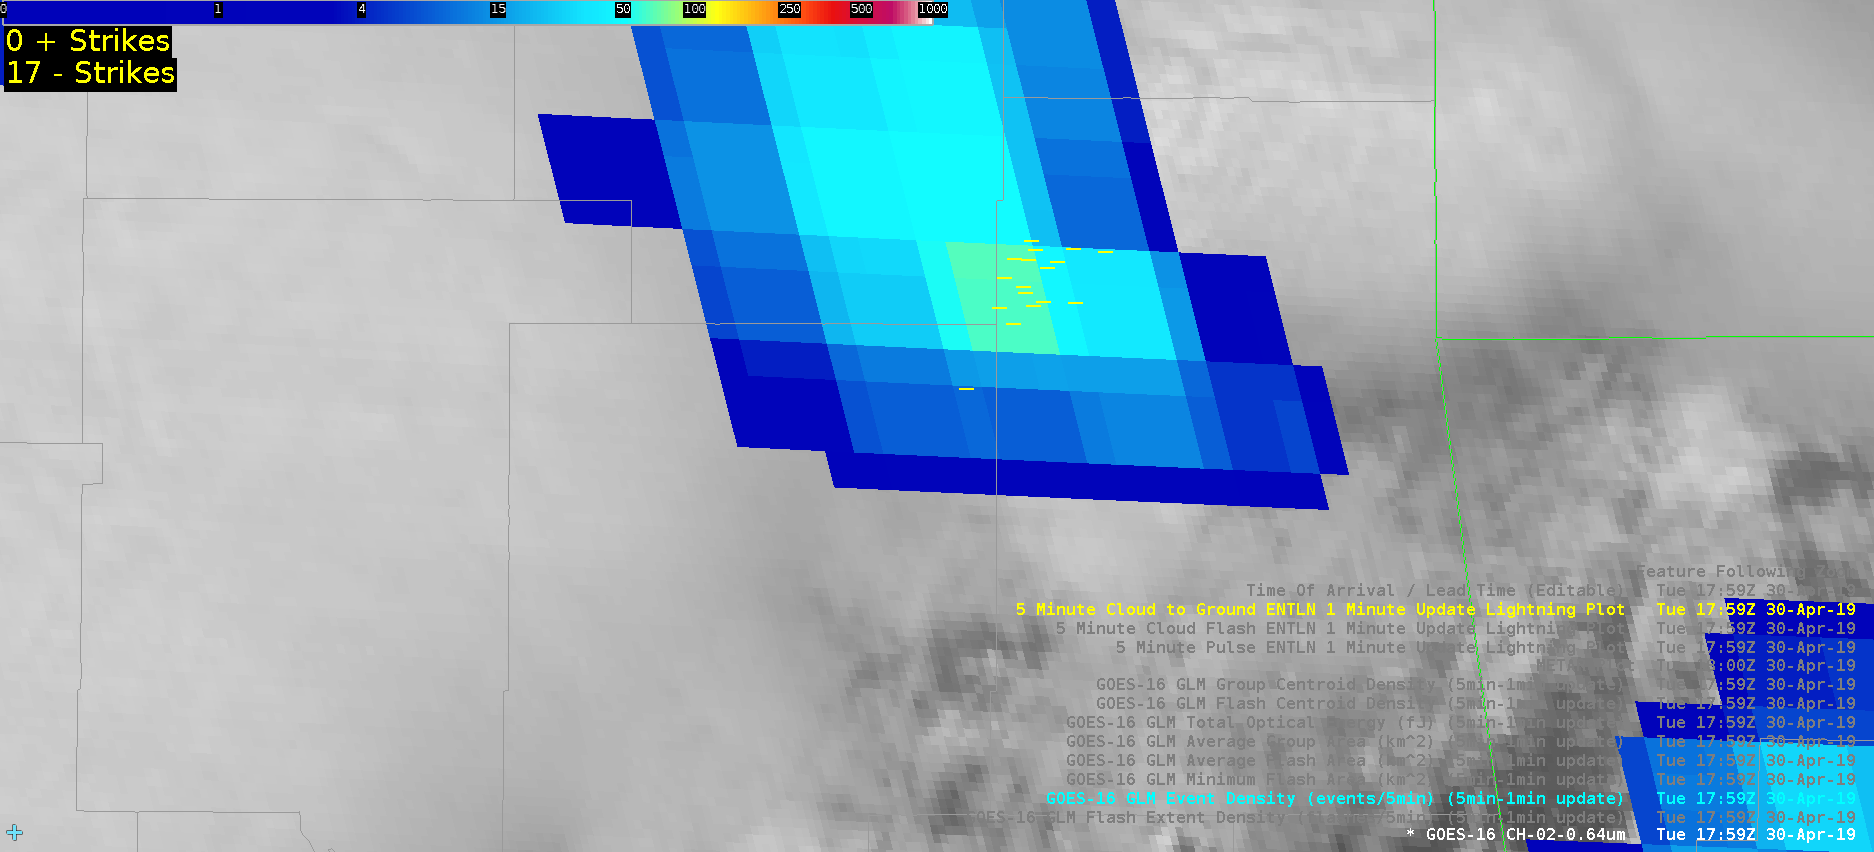
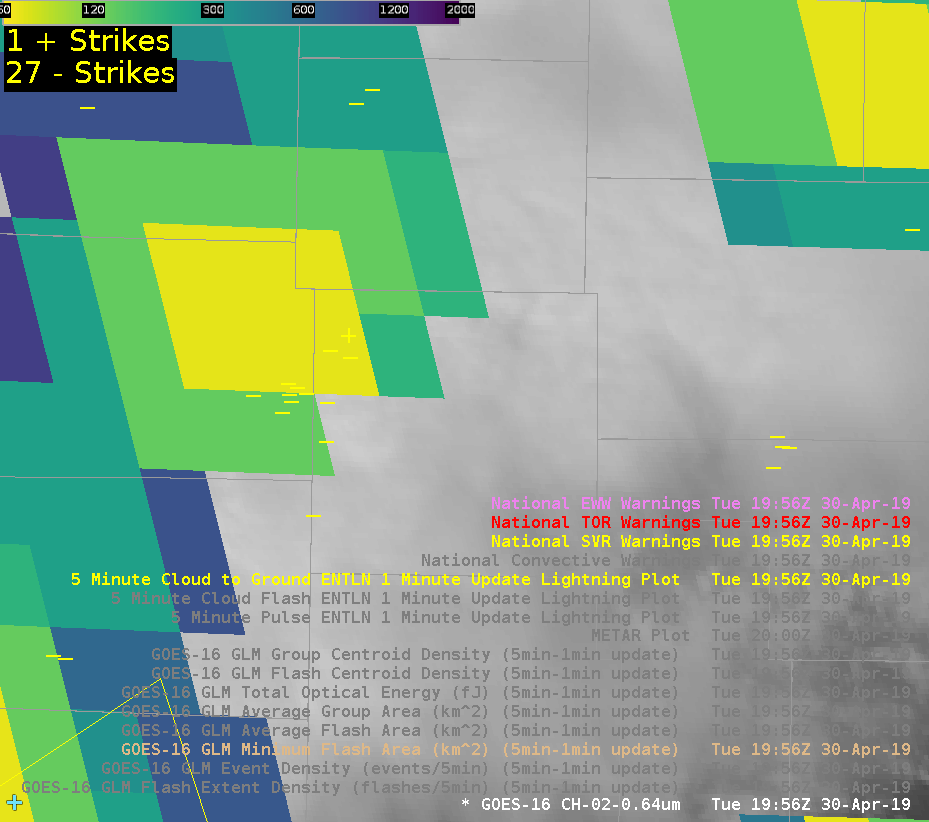
Minimum Flash area showing updraft core
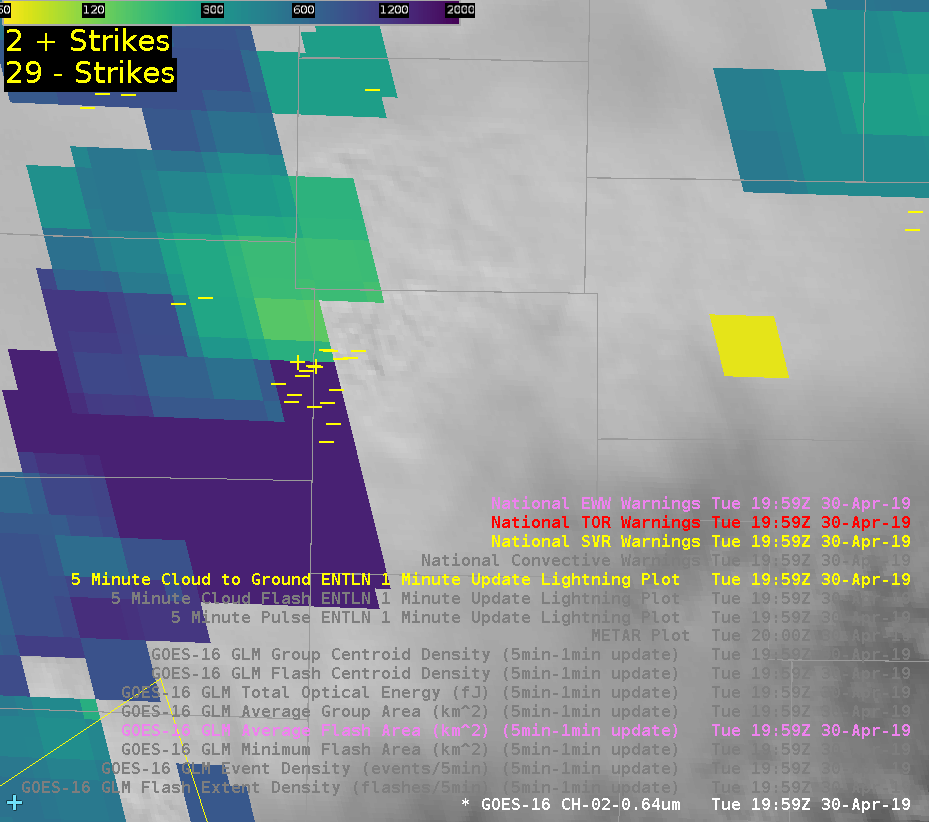
 

Average Flash Area


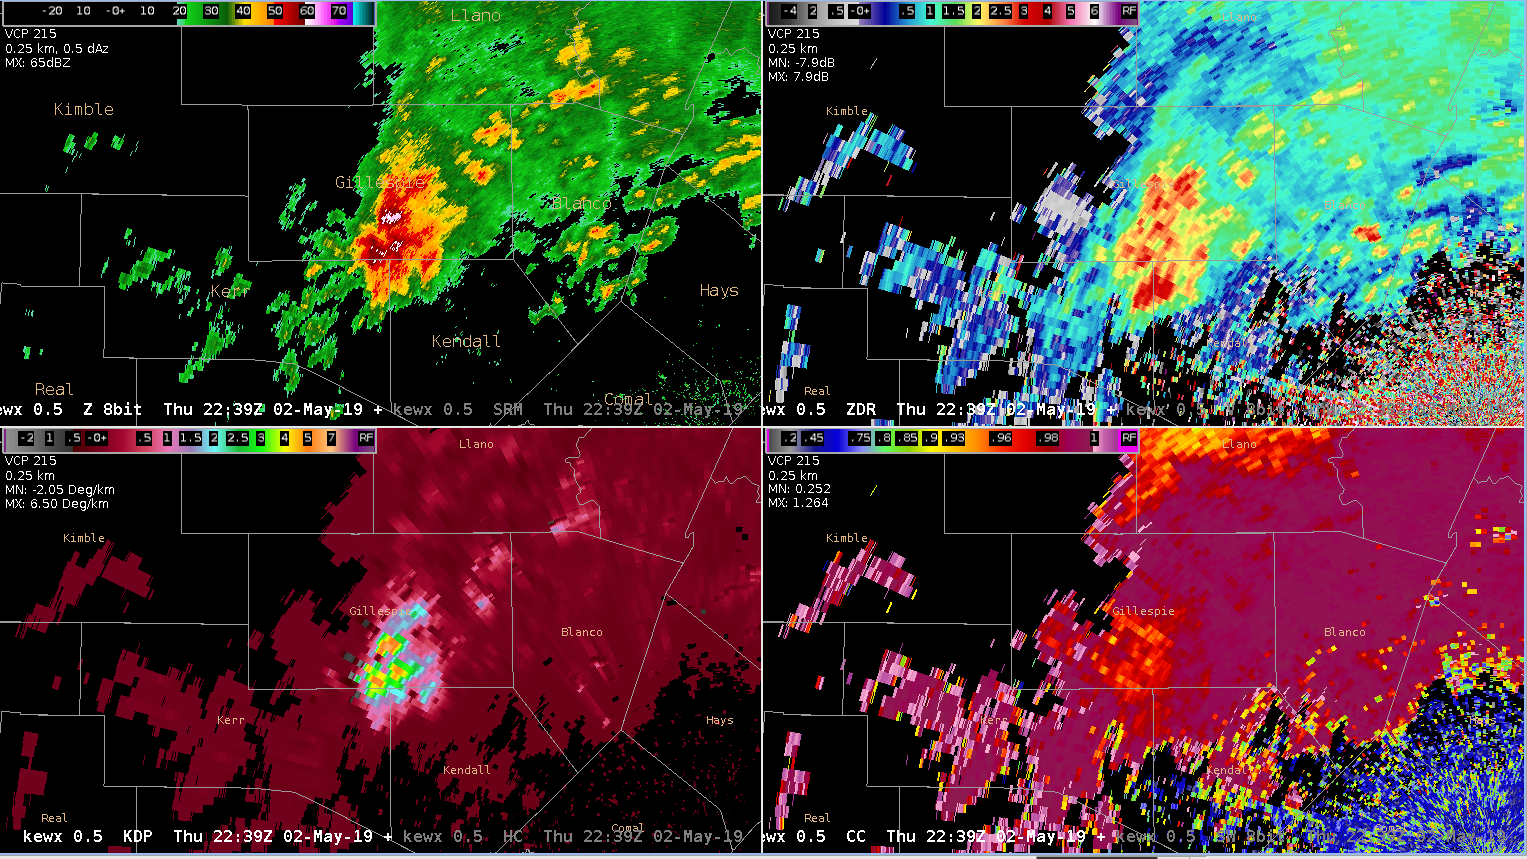
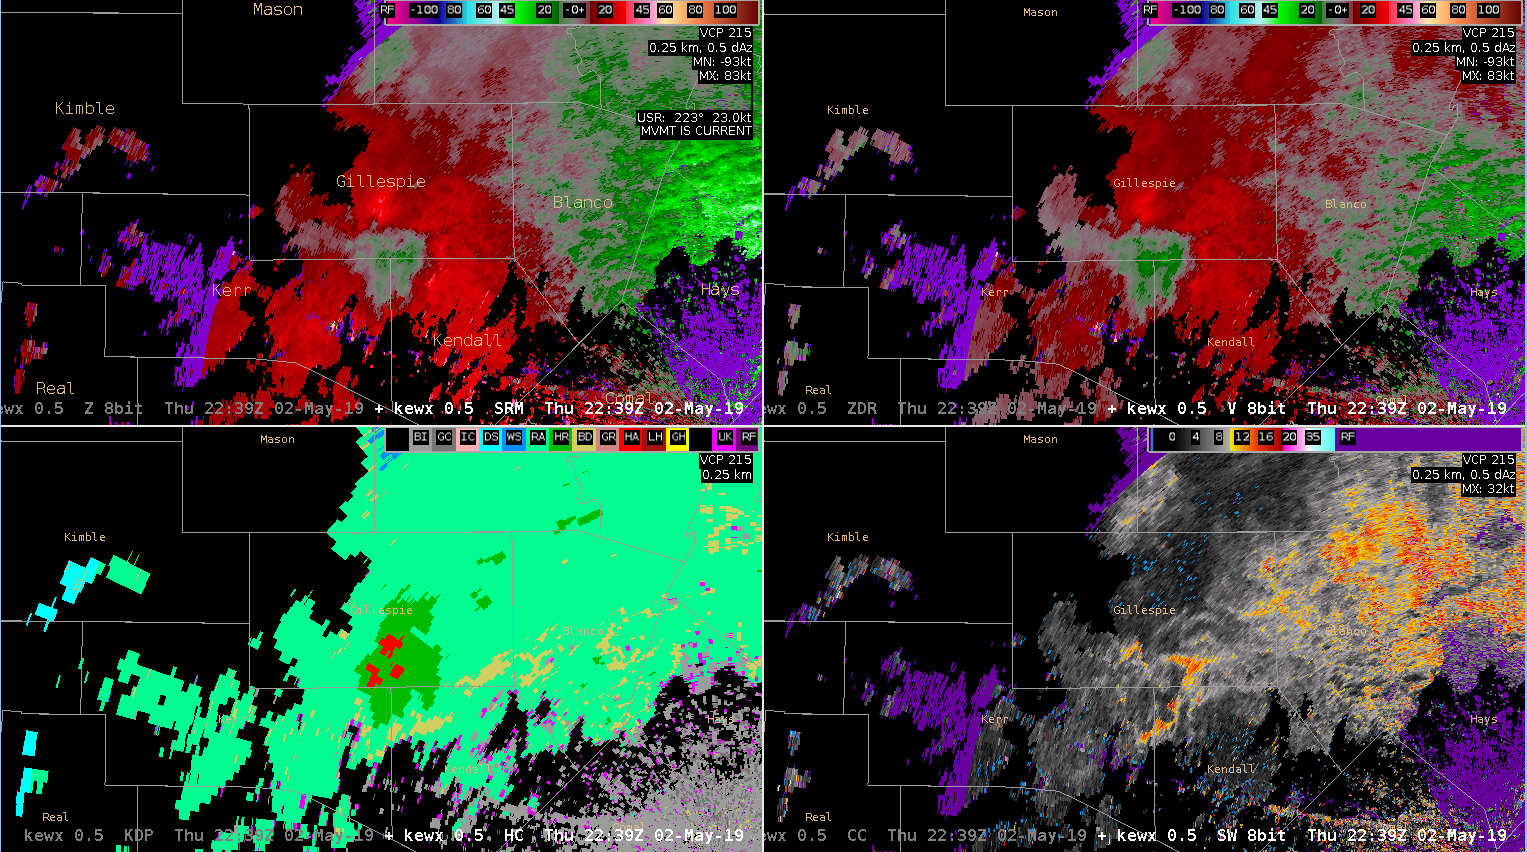
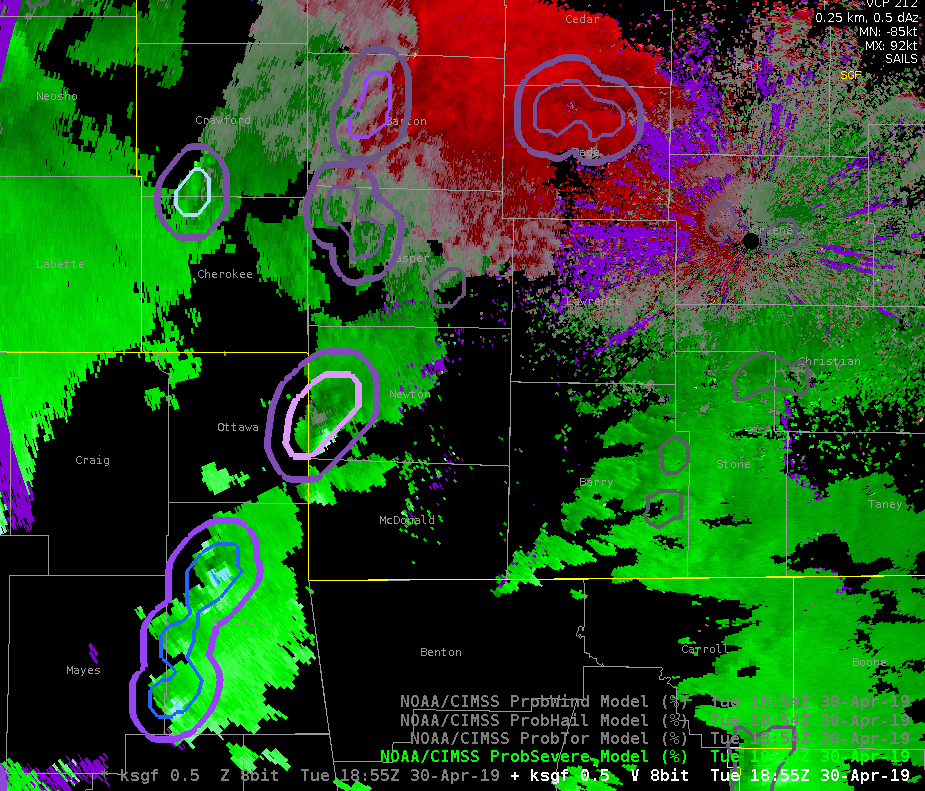
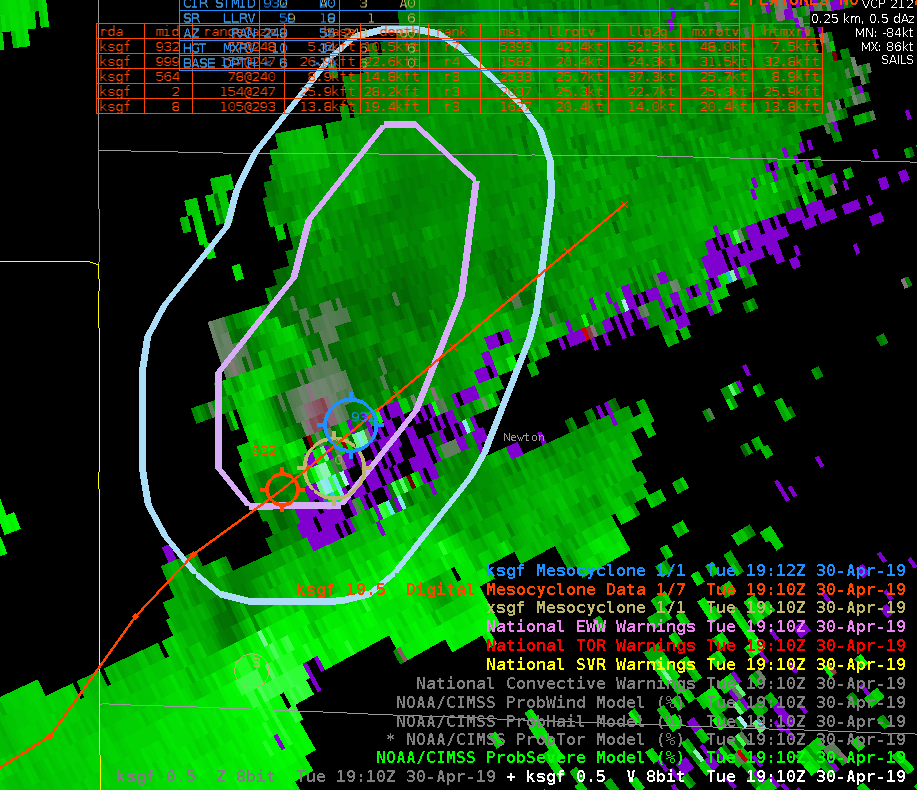
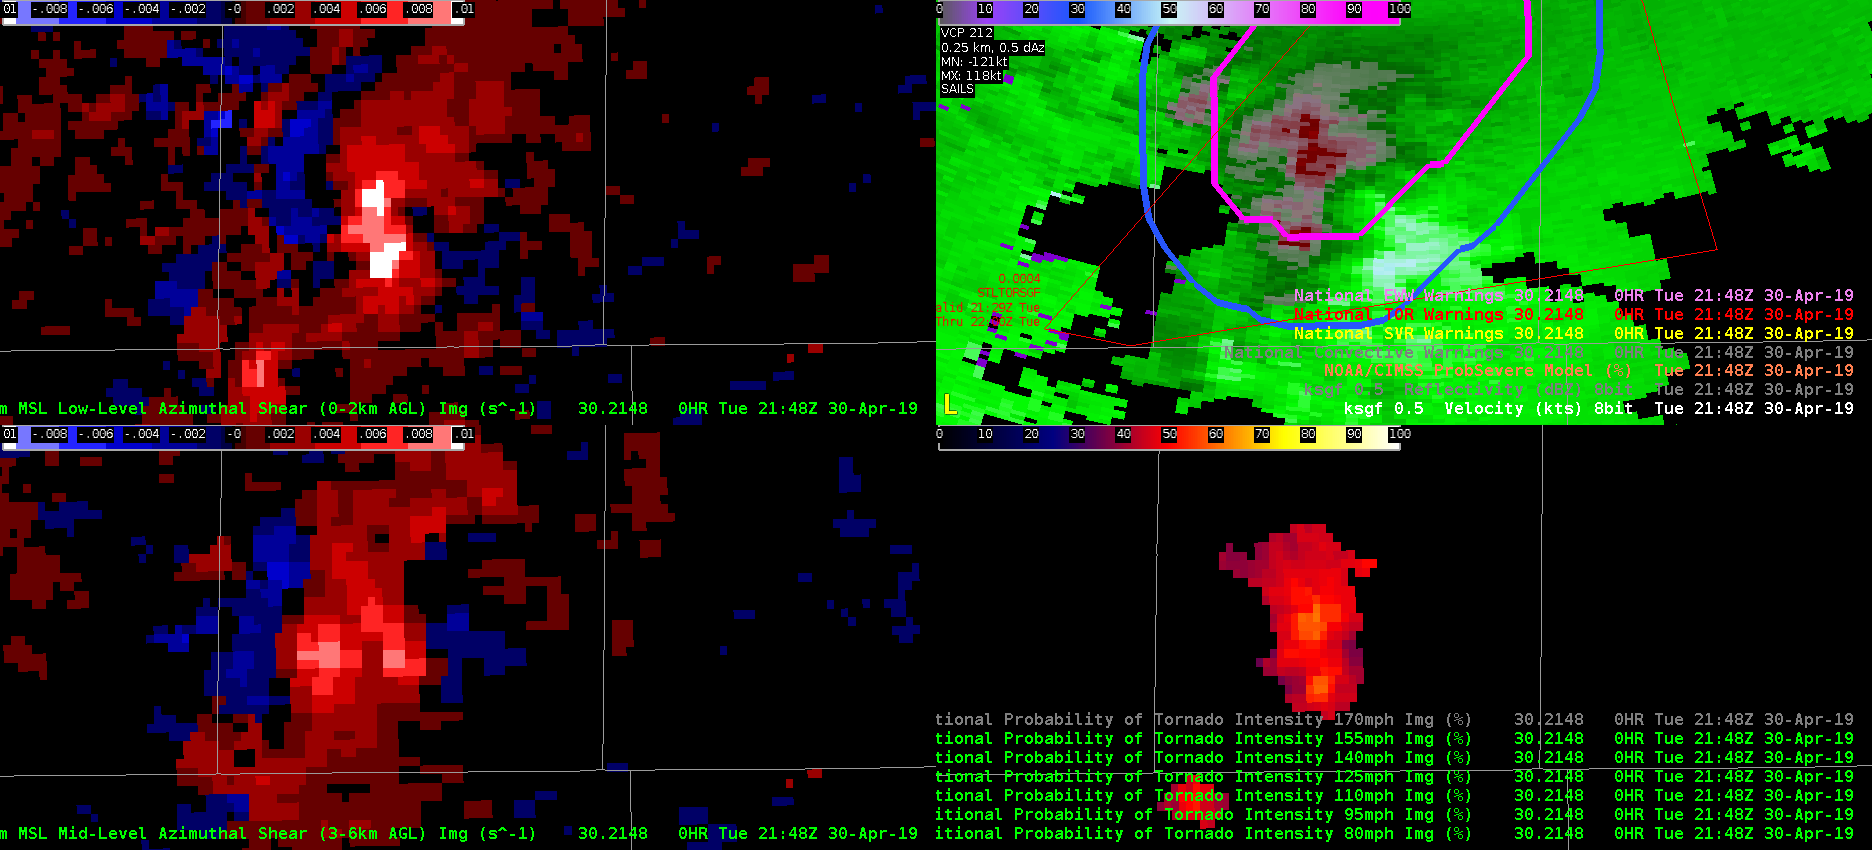
This is a case where AzShear overdid the tornadic threat This supercell had a circulation that never really tightened up. ProbSevere also vastly overestimated the tornado threat, likely due to nearby storm interactions and mergers. When convection gets messy, can we rely on these products as much?


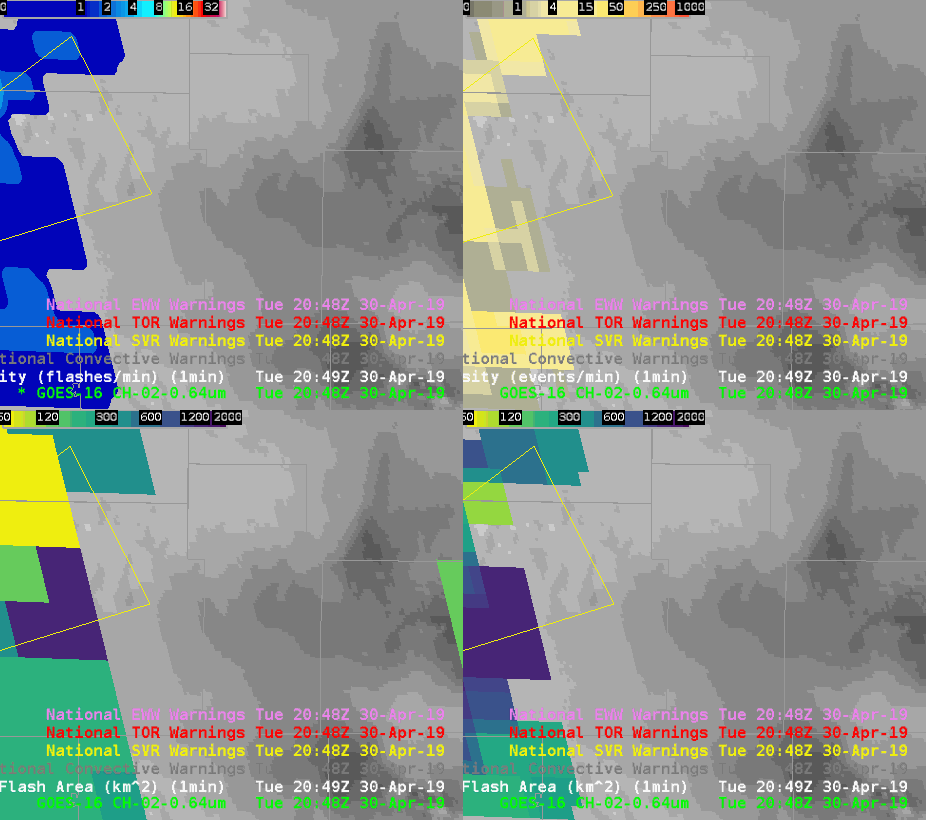
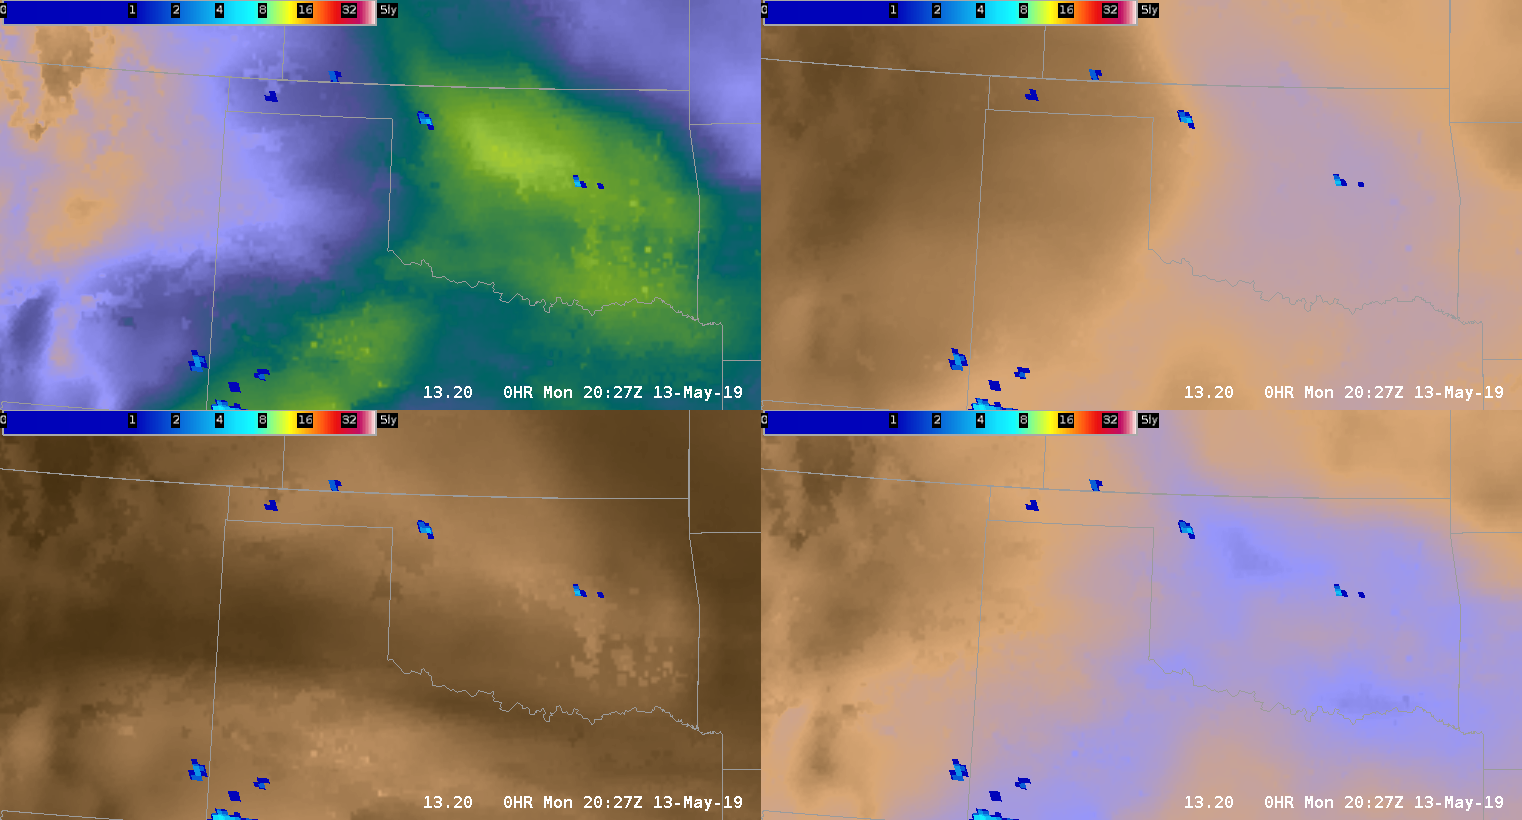
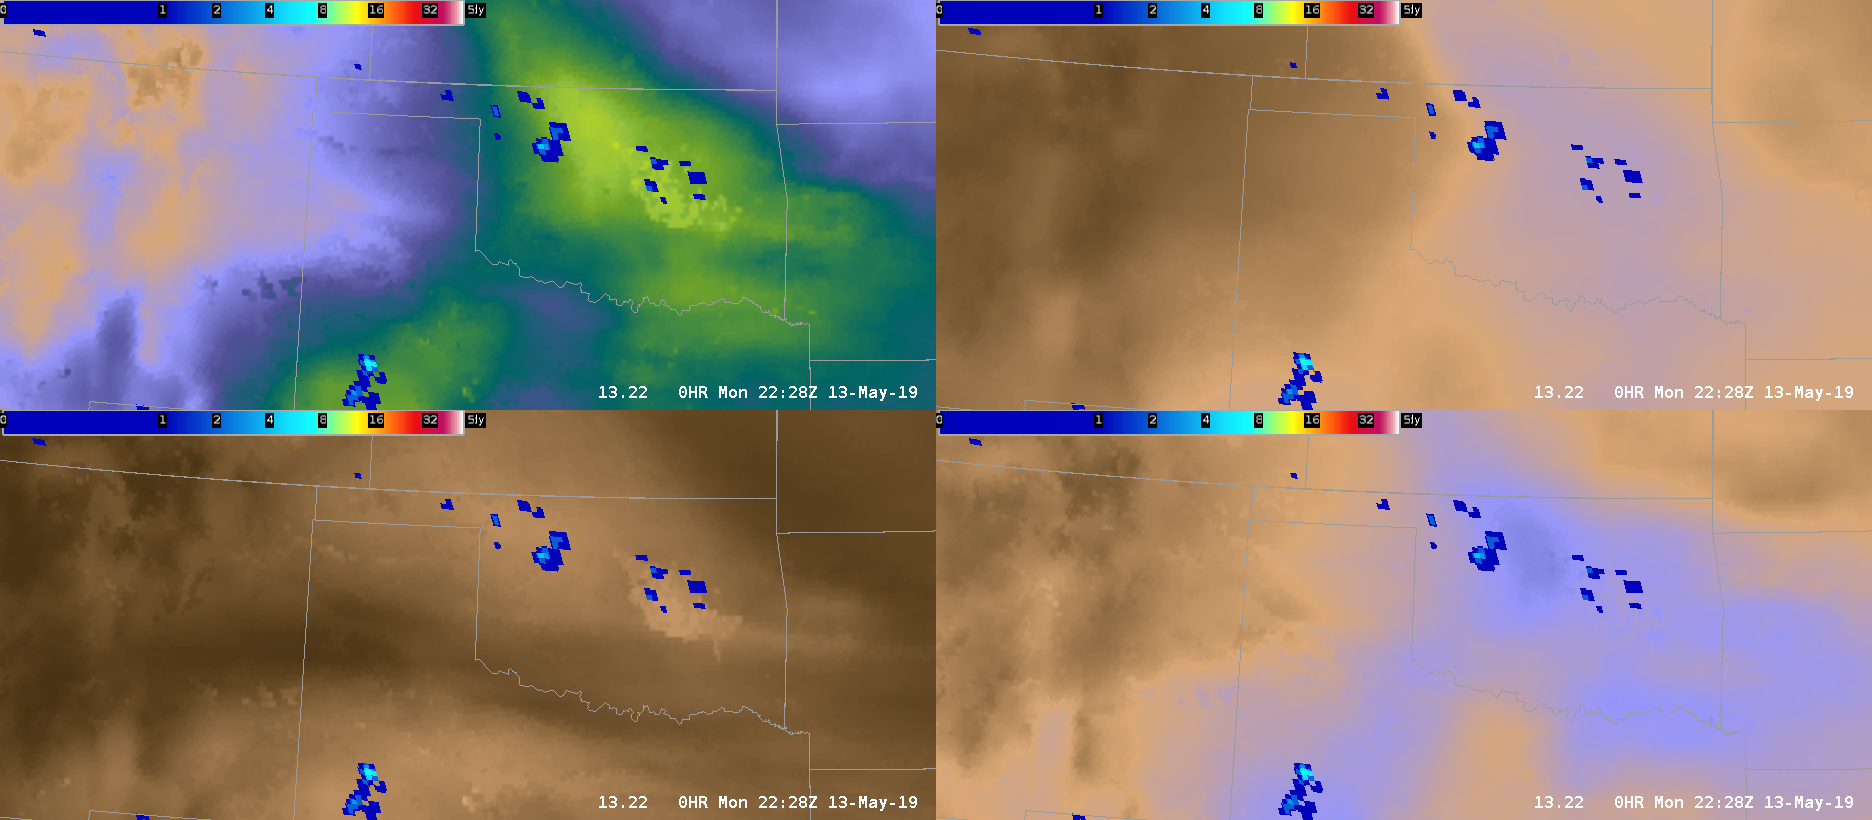
The two images above compare a 4 panel of 1 min GLM data (left four panels) versus 5 min data (right four panels). While the 5 min data was much smoother to view from an animation and trend sense, the 1 min data did provide some fine temporal resolution help during periods of rapid storm intensification preceding this tornado warning.

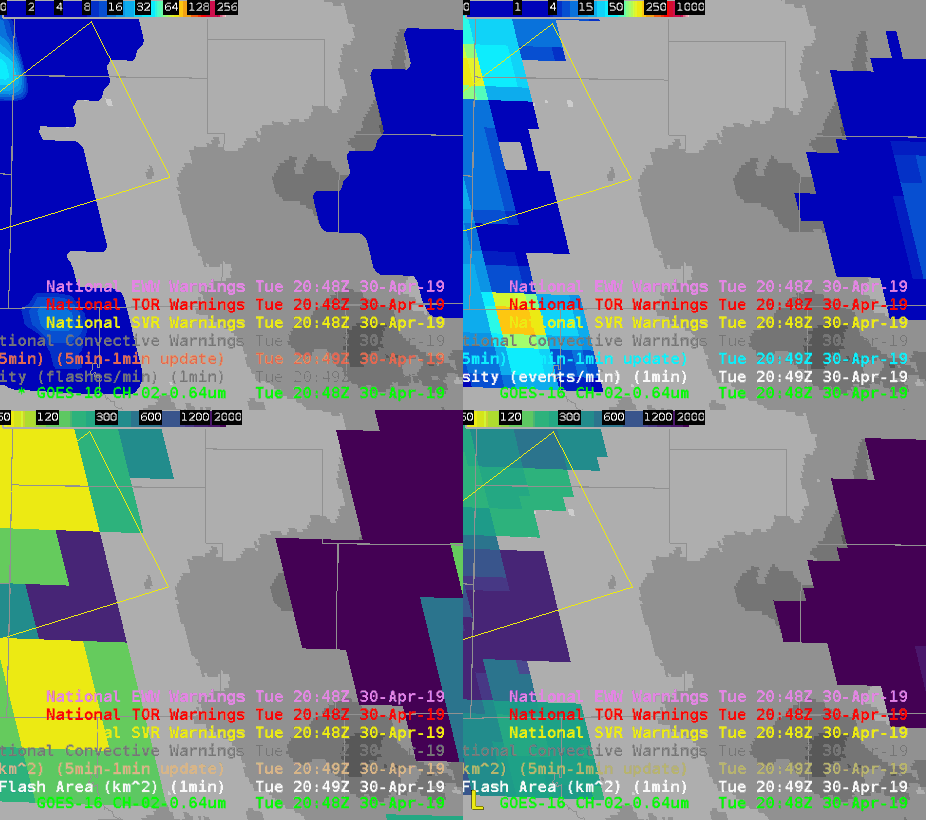
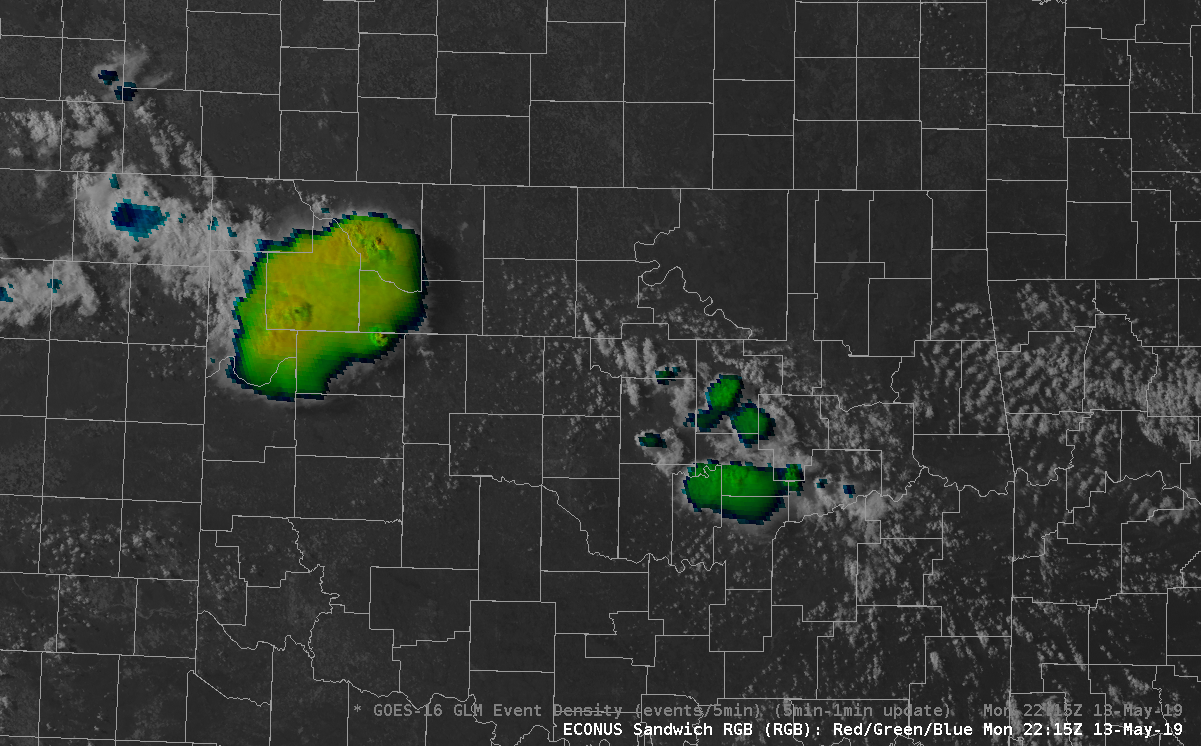
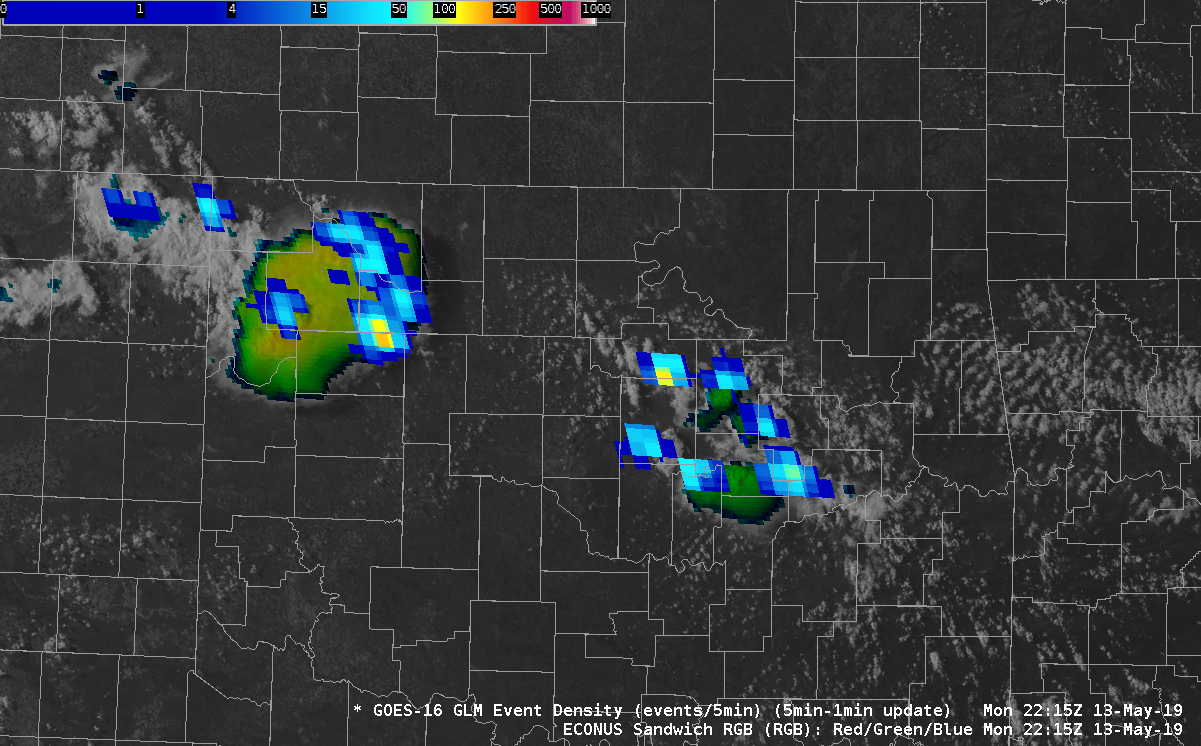
The above two loops compare 1 min looping (top 4 panel) versus 5 min looping (bottom 4 panels). In a loop the ‘flashy’ nature of 1 min data makes it less desirable in operations, however manual toggling and advancing still make this data useful.


HWT Day 2 case blog: Start until 19:10

This rapidly developing supercell displayed a GLM lightning decrease as it intensified. This was a good example of optical attenuation due to an updraft core. ENTLN network is displayed, showing that there was a tremendous of CG and IC flashes despite low GLM values. Shown is the TOE product.

The same storm and lightning minimum shown in Event Density.


ProbTor was occasionally too aggressive. Only one of these storms was really concerning at this time given the environment and radar tilts further up in the volume. On a day like this, it would likely be prudent to increase the probtor threshold above 3%

Prob Tor contours showing  a new probtor threshold of 10% instead of 3%. This was edited on the fly in the localization file of the procedure itself. This view shows a less cluttered display given the amount of rotating storms this day.


Comparison of MDA products over a weak low topped supercell, as well as showing the probsevere contours. ProbTor was at 47% at the time, prompting the issuance of a Tor Warning.