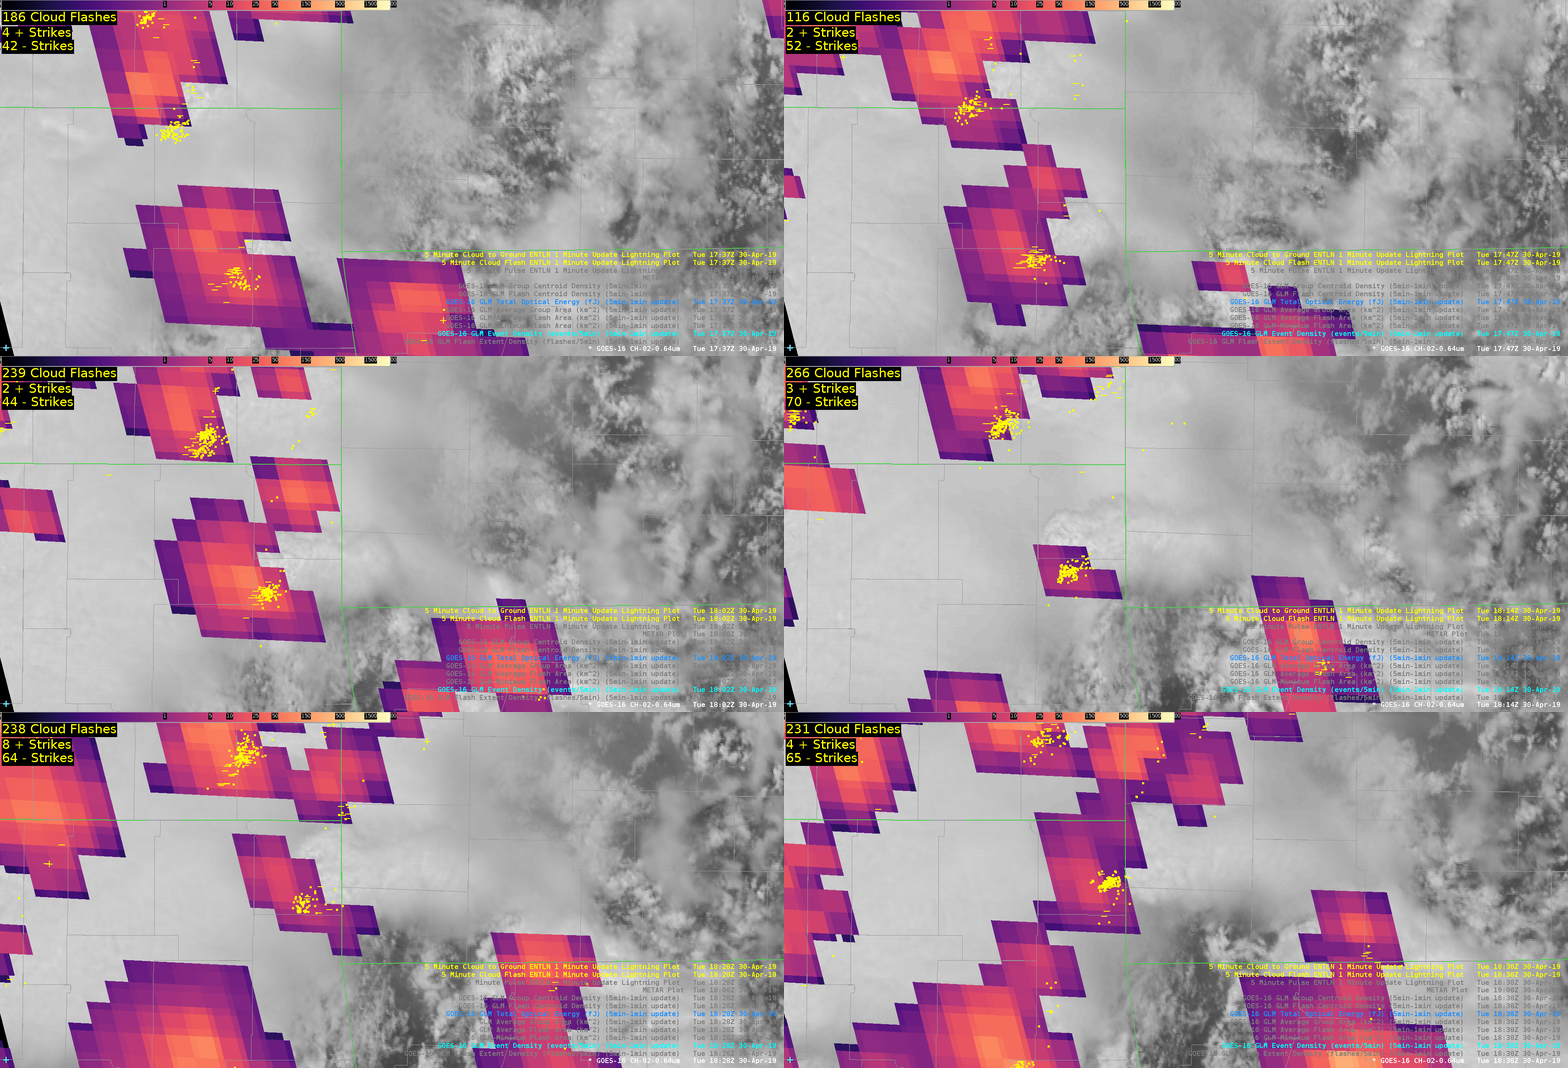
This rapidly developing supercell displayed a GLM lightning decrease as it intensified. This was a good example of optical attenuation due to an updraft core. ENTLN network is displayed, showing that there was a tremendous of CG and IC flashes despite low GLM values. Shown is the TOE product.
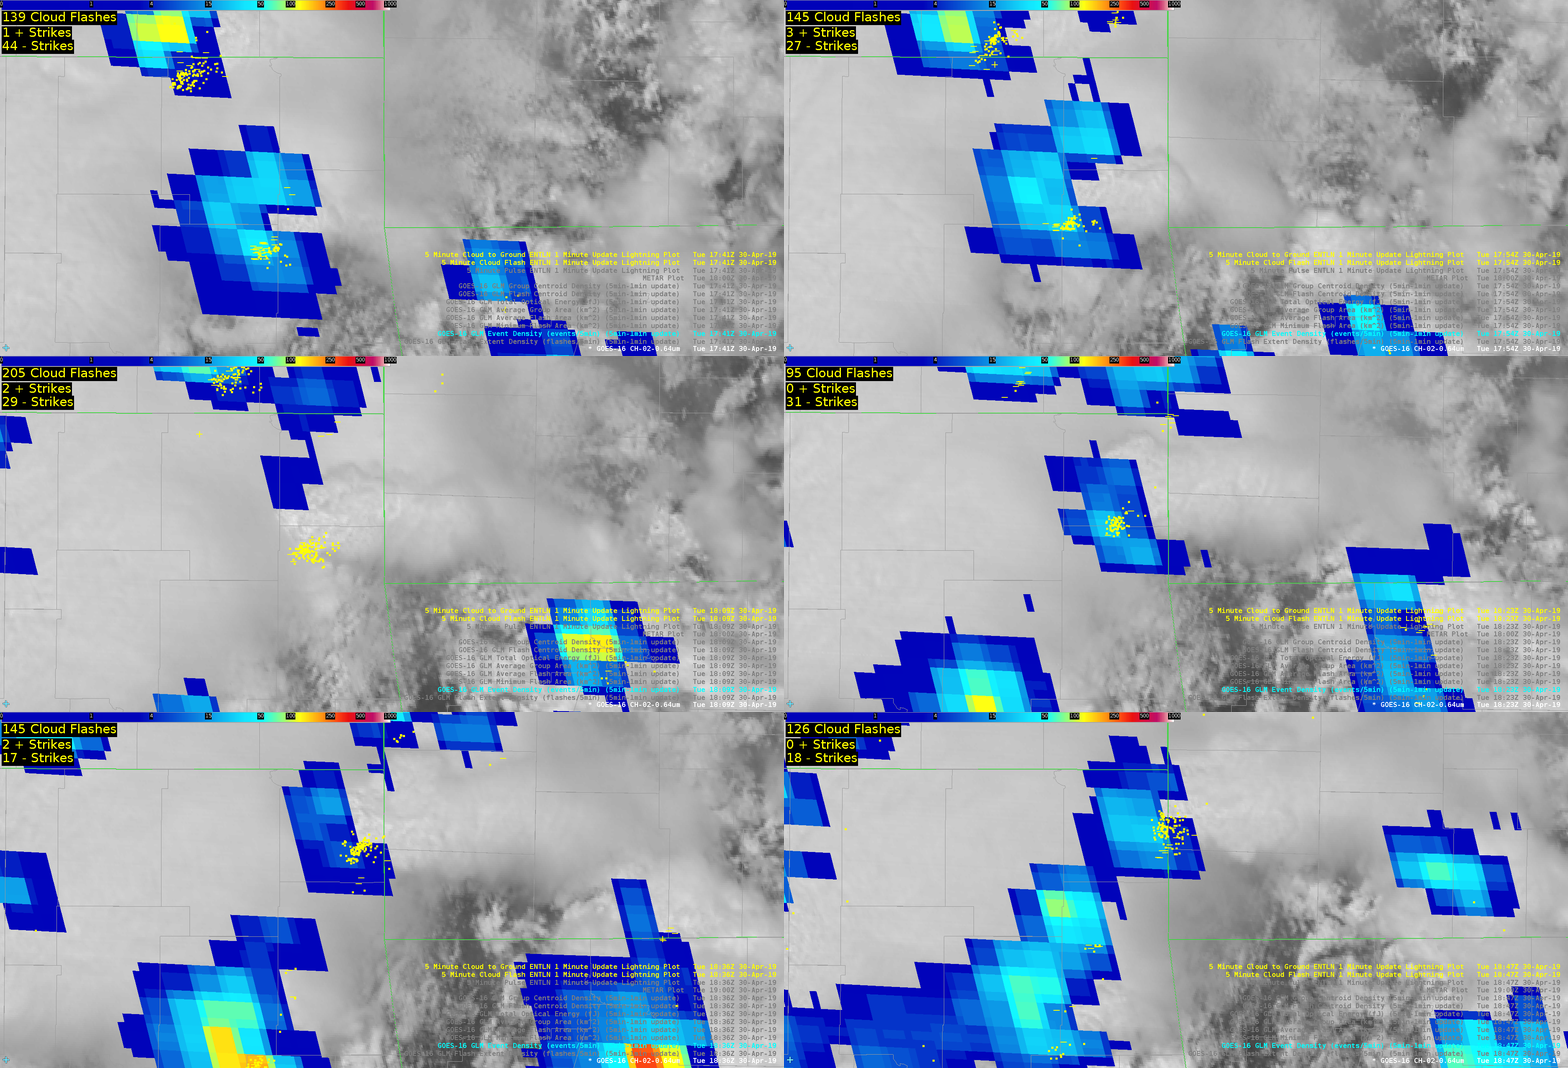
The same storm and lightning minimum shown in Event Density.
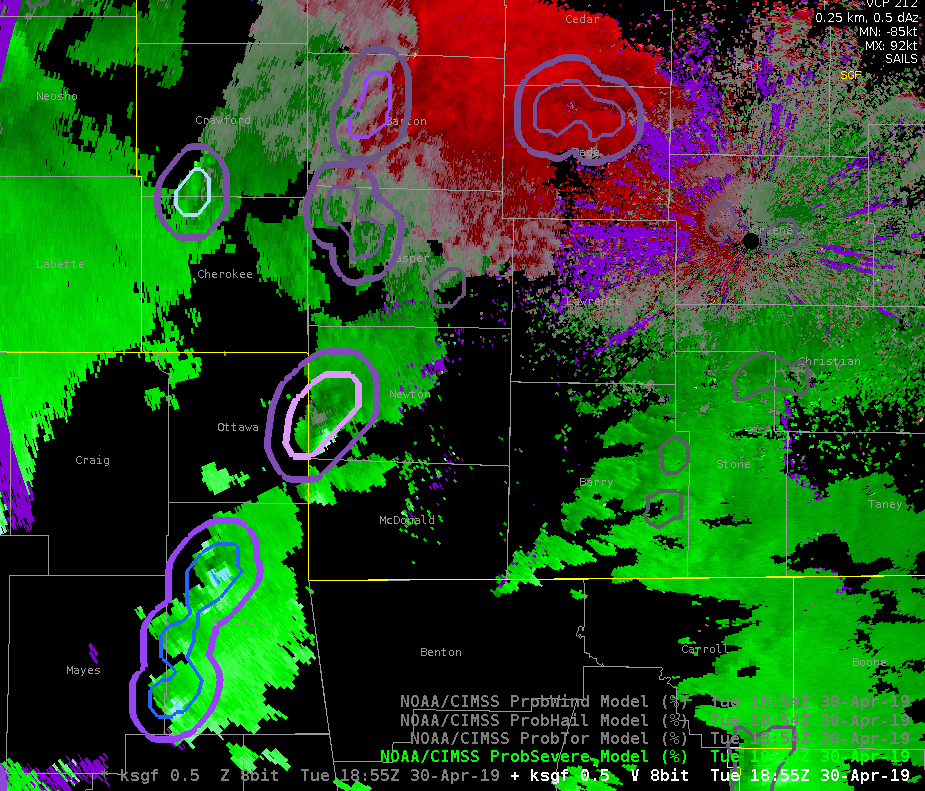
ProbTor was occasionally too aggressive. Only one of these storms was really concerning at this time given the environment and radar tilts further up in the volume. On a day like this, it would likely be prudent to increase the probtor threshold above 3%
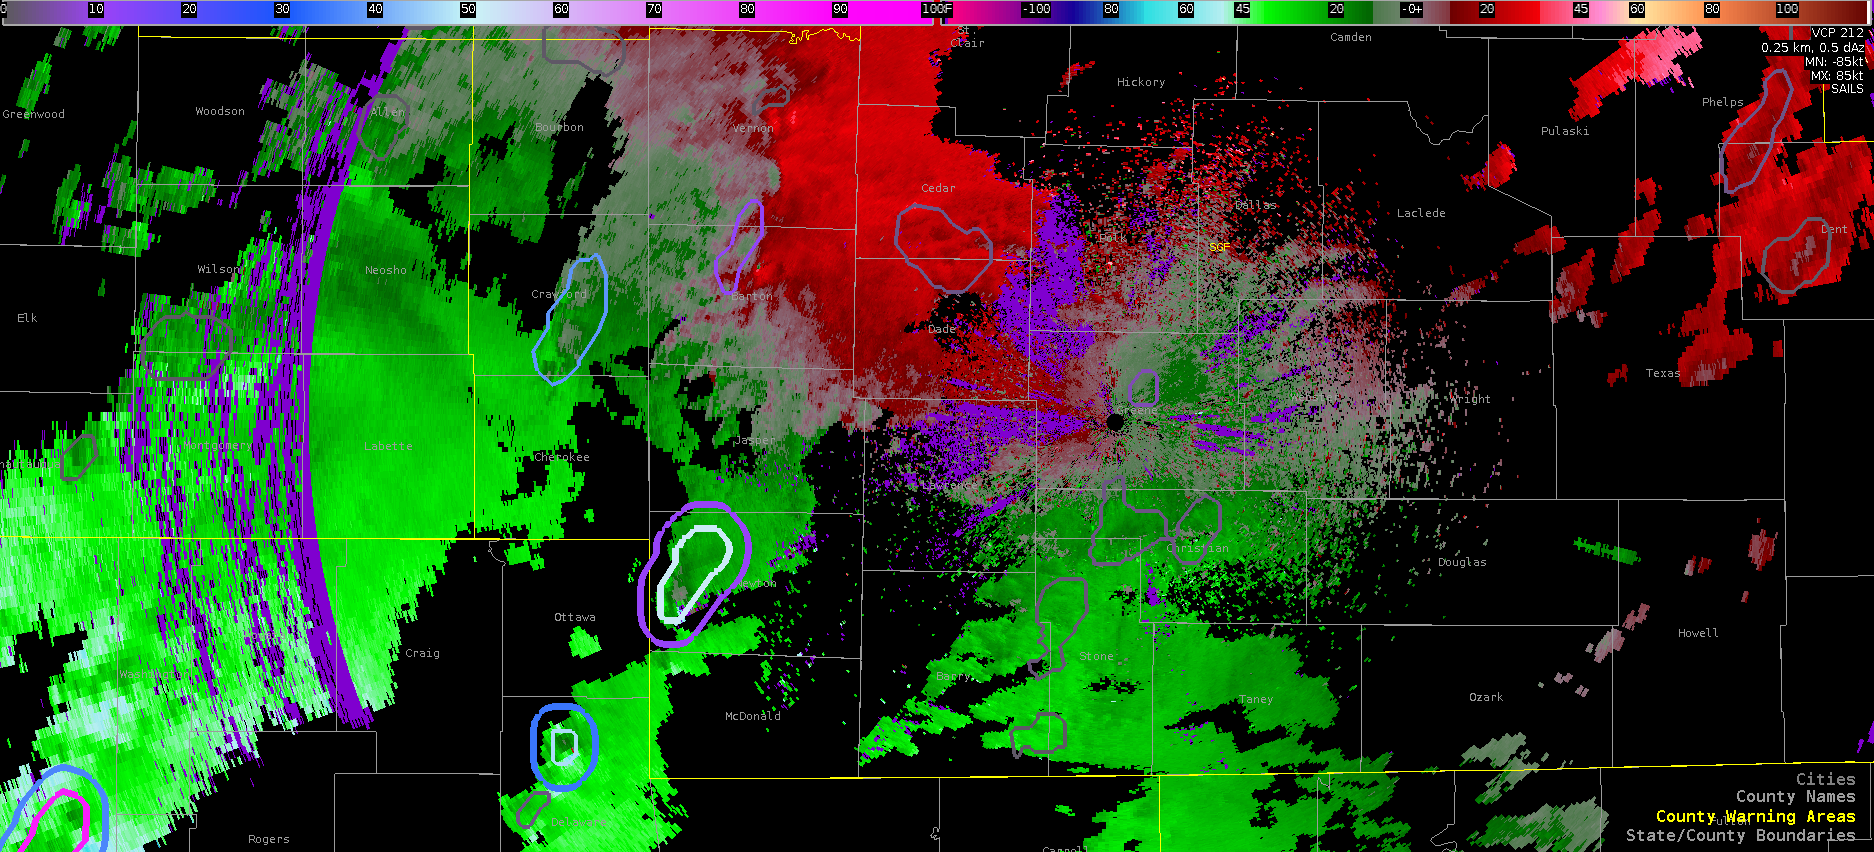
Prob Tor contours showing a new probtor threshold of 10% instead of 3%. This was edited on the fly in the localization file of the procedure itself. This view shows a less cluttered display given the amount of rotating storms this day.
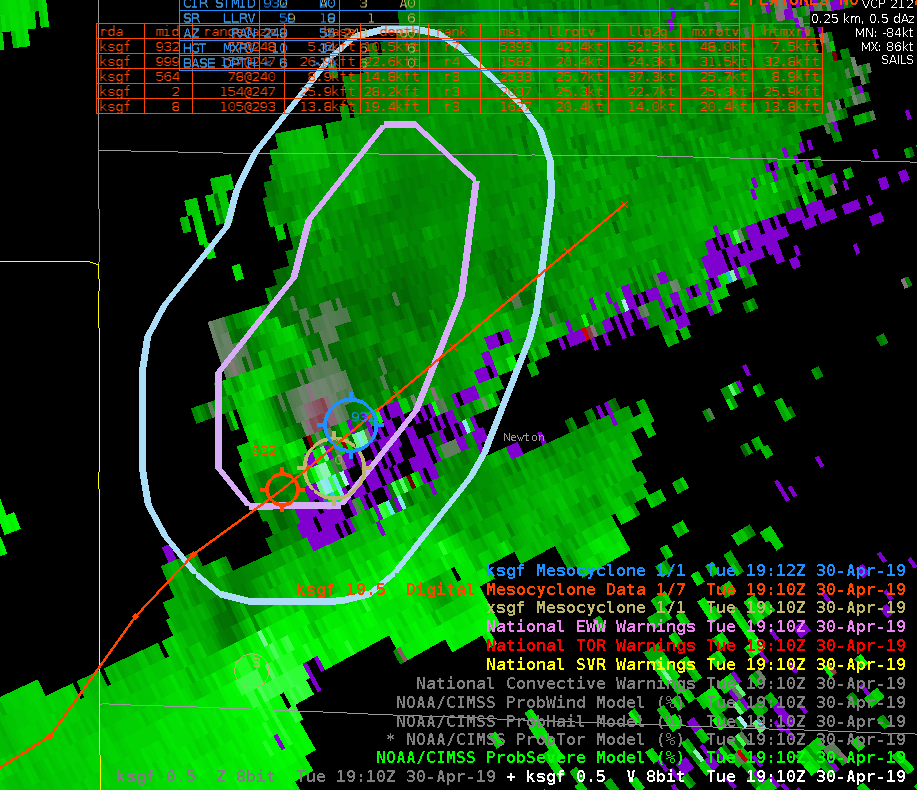
Comparison of MDA products over a weak low topped supercell, as well as showing the probsevere contours. ProbTor was at 47% at the time, prompting the issuance of a Tor Warning.
