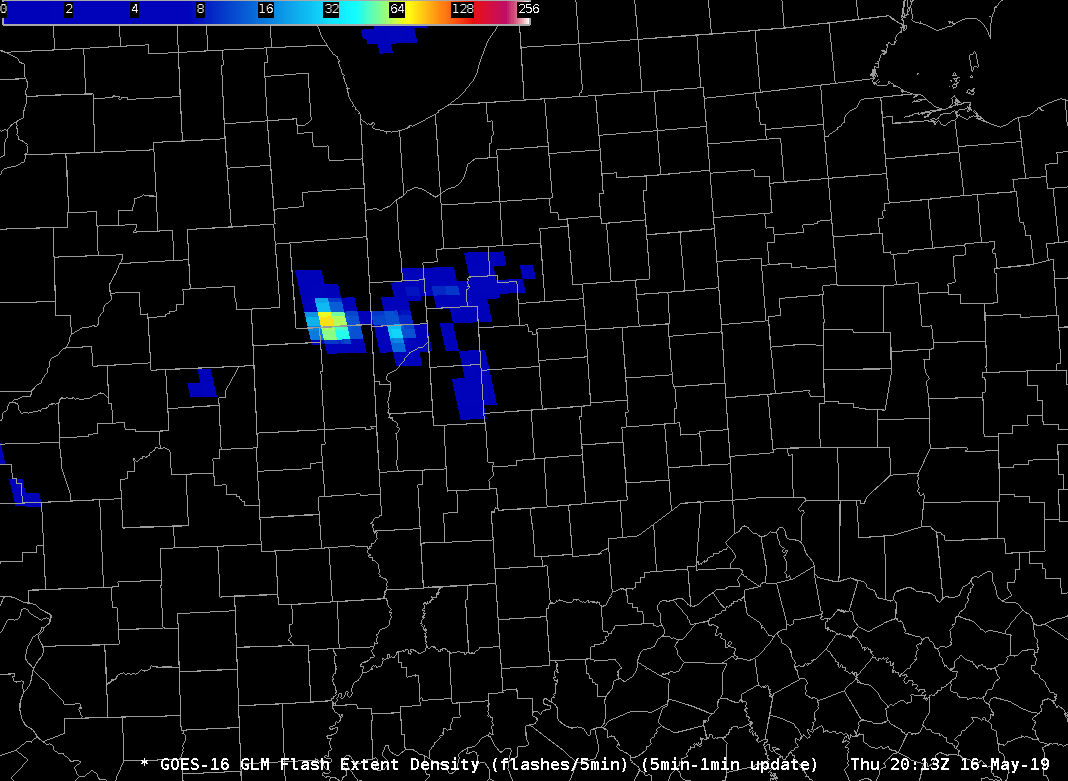
Testing a new colormap for FED using the Rainbow colormap in Python. The first image depicts the modified 5-min FED with the modified colormap. There is more variation on the lower end of the 5-min FED. Will this colormap depict the variation in the more intense convection. The second image is the original 5-min FED colormap. – Jonathan Wynn Smith (ESSIC/UMD)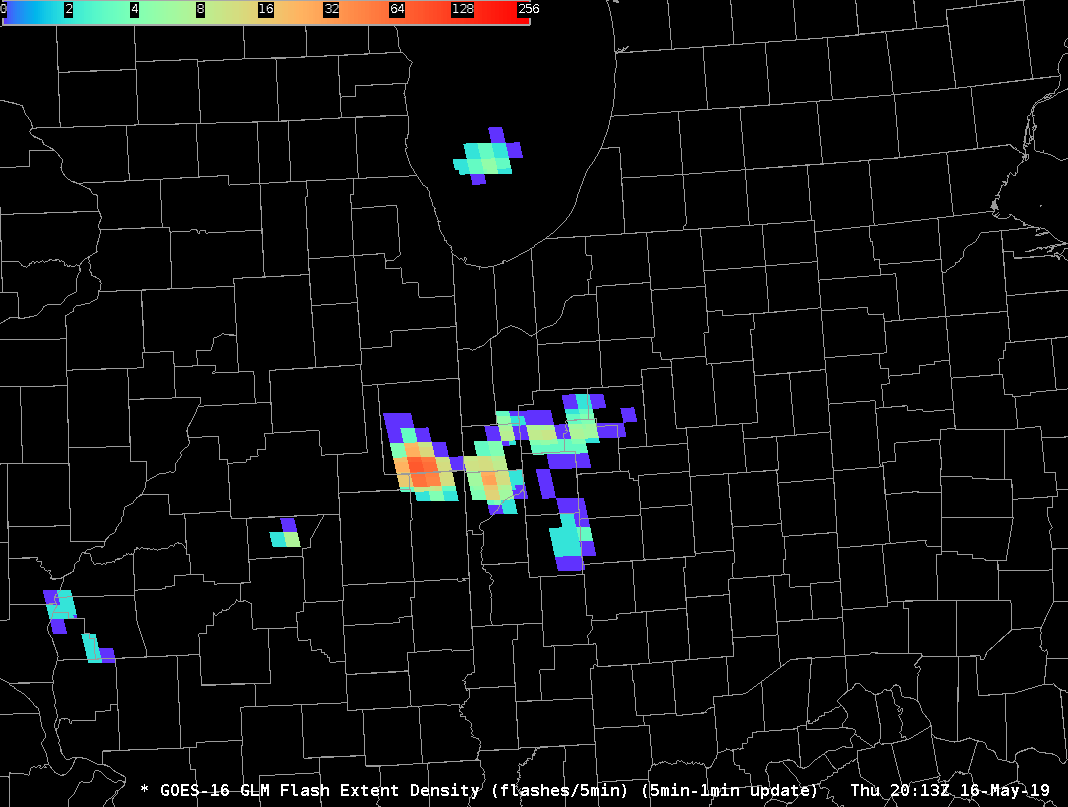
Category: GLM
IDSS Usage from GLM/Minimum Flash Area
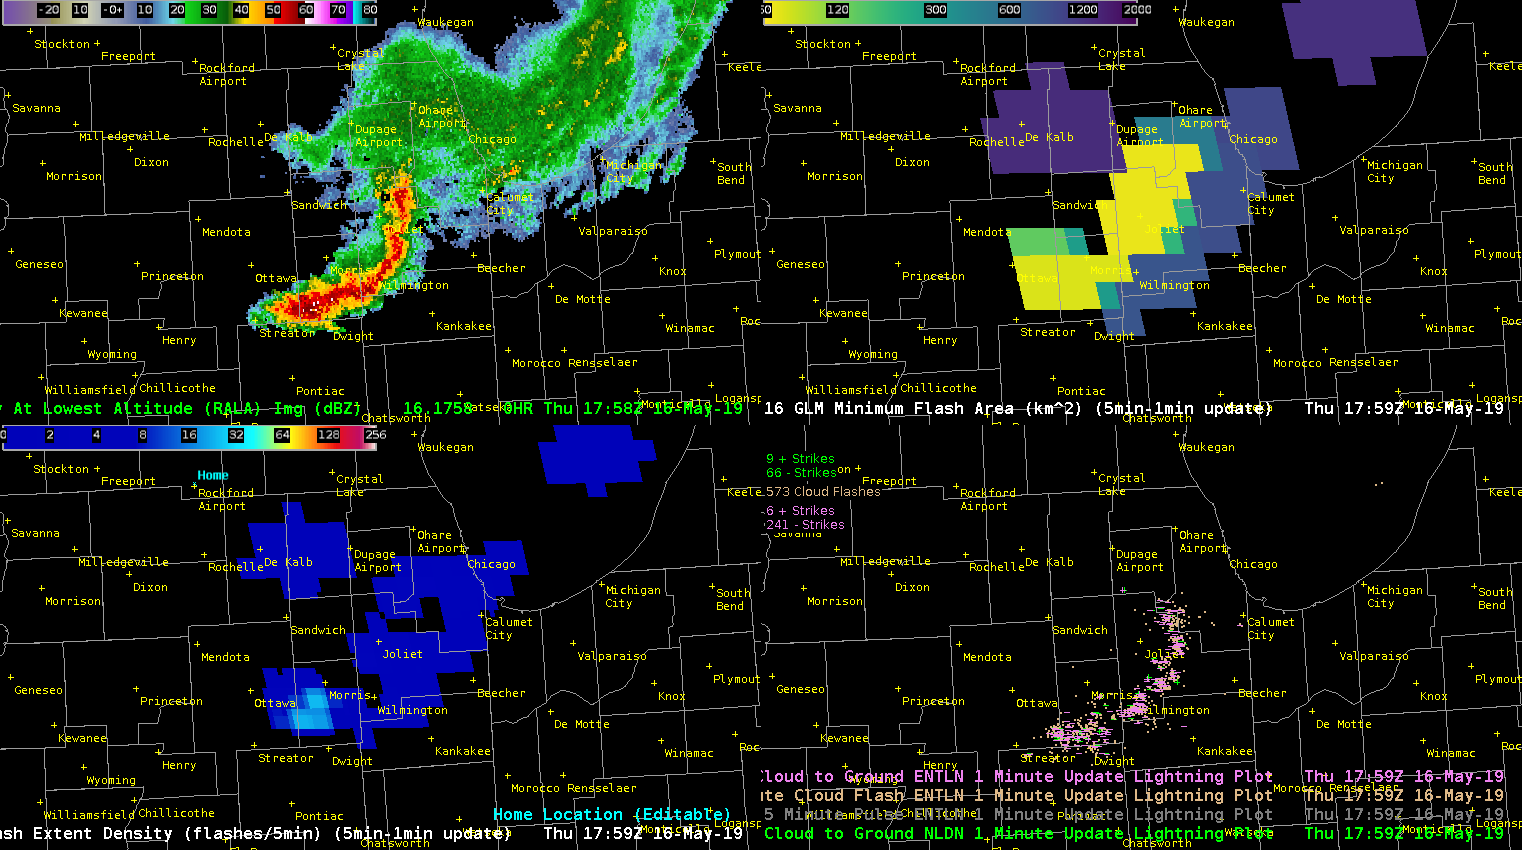
An MCS shifting southeastward across northern IL was producing quite a bit of lightning, and much of it was moving through the southwest portion of the line per Flash Extent Density. From a IDSS standpoint, the Minimum Flash Area and FED proved that it’s necessary to look at both GLM products and ground based lightning products to see the “total” picture. The GLM products captured a larger flash that extended out into the stratiform area behind the main line that is not seen in the ENTLN and NLDN products. This information can be especially important for Airport Weather Warnings and/or outdoor venues. You can easily see that the flash extends almost back to the Rockford Airport, while the main line and most of the flashes are ~80 miles away. In other words, areas near Rockford Airport are not out of the woods yet for lightning.
-Tempest Sooner
Lightning observed but no GLM
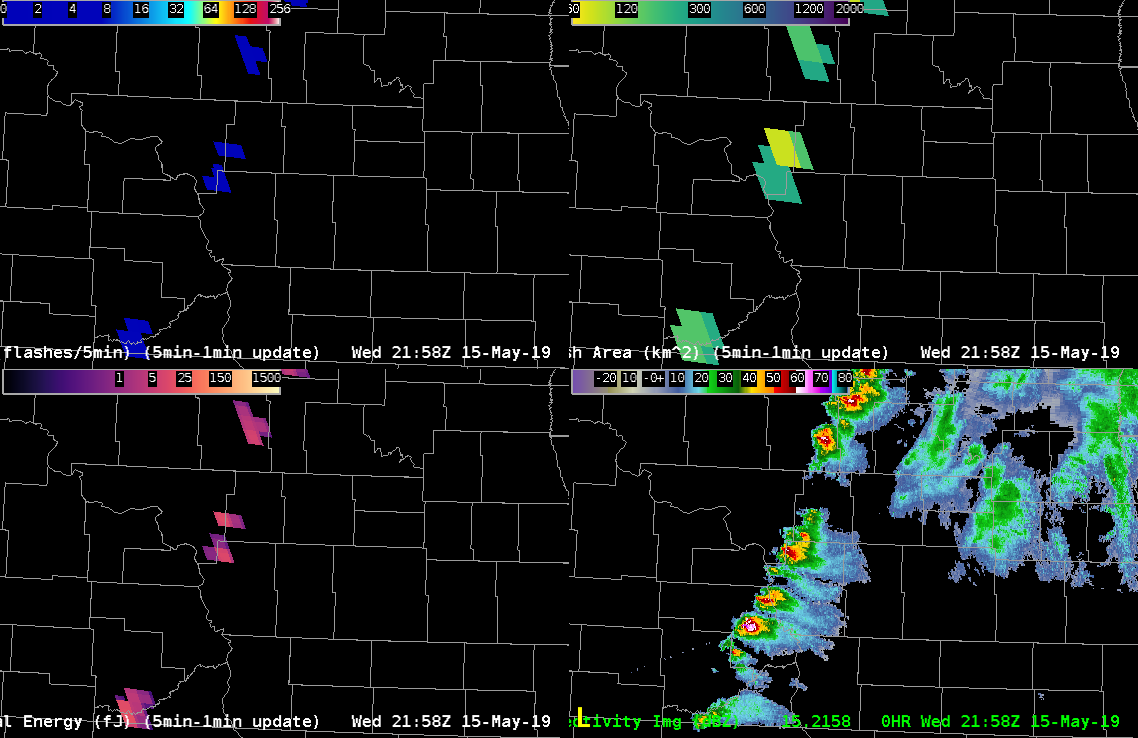
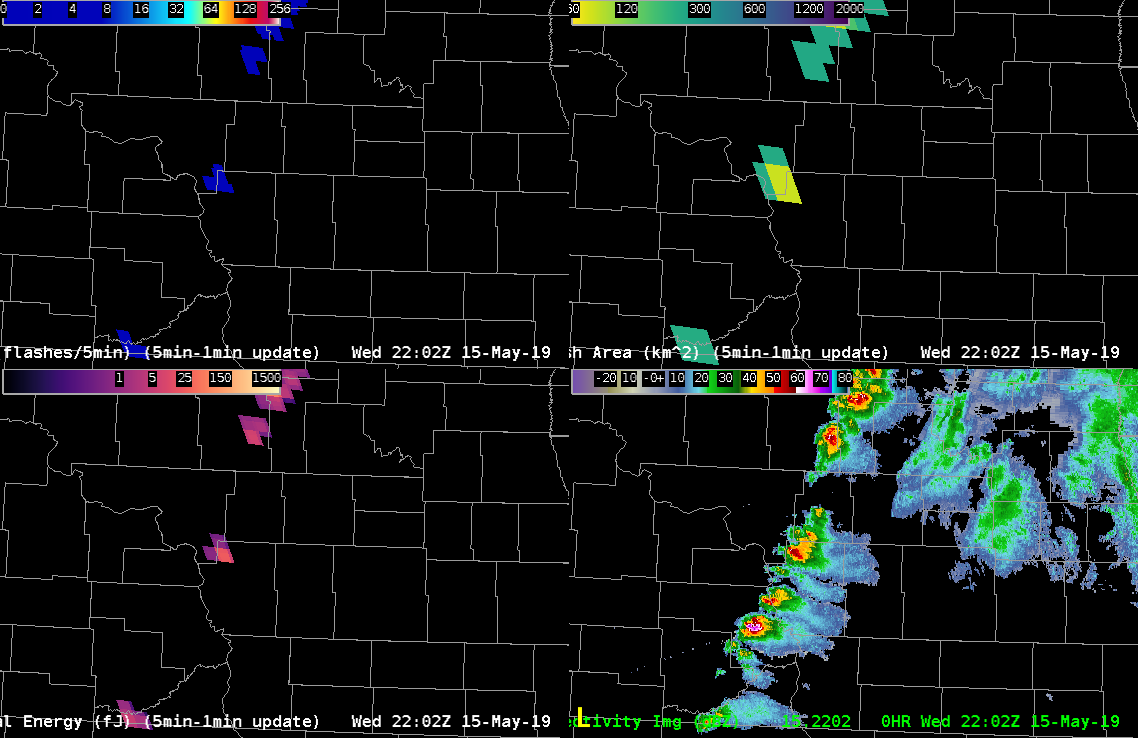
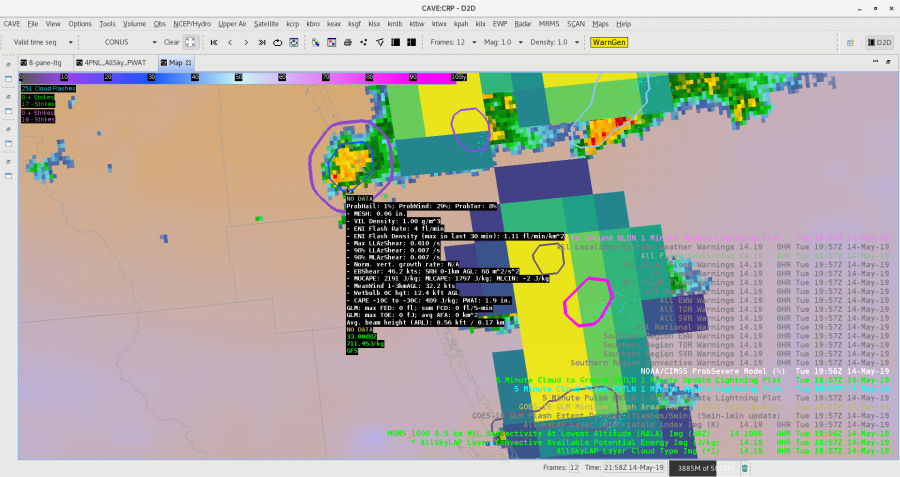
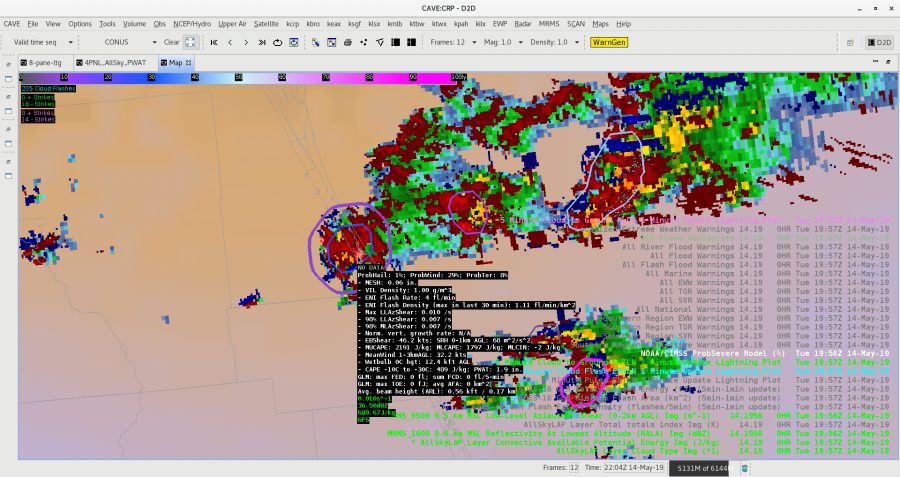
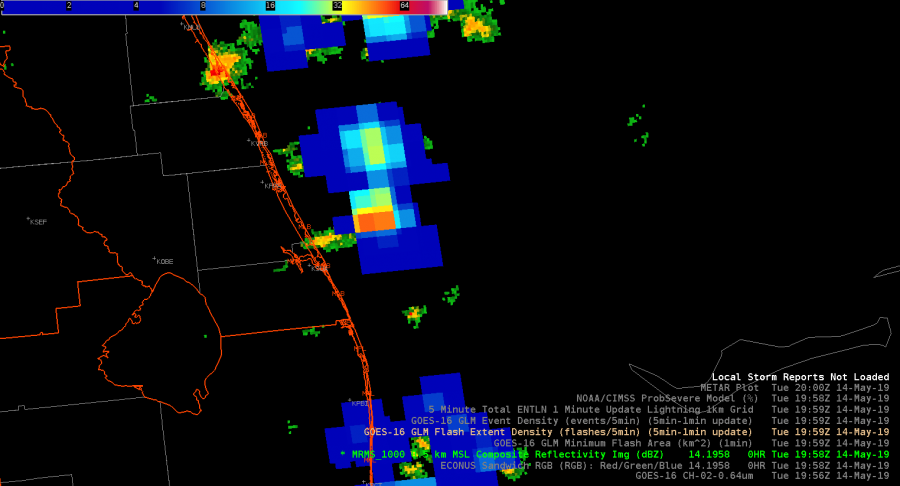
ProbSevere gives every indication of a severe storm over Morton County, ND (see ProbSevere read out below). The Earth Networks lightning suggests there of 52 fl/min but GLM FED gives 0 fl, TOE 0 fJ, and AFA 0 km^2. The two depictions below show those three GLM fields with the MRMS 1 km reflectivity. Perhaps there is an issue with viewing angle at this northern latitude. – Jonathan Wynn Smith (ESSIC/UMD)
ProbHail: 93%; ProbWind: 95%; ProbTor: 5%
– MESH: 1.83 in.
– VIL Density: 3.20 g/m^3
– ENI Flash Rate: 52 fl/min
– ENI Flash Density (max in last 30 min): 0.89 fl/min/km^2
– Max LLAzShear: 0.007 /s
– 98% LLAzShear: 0.006 /s
– 98% MLAzShear: 0.008 /s
– Norm. vert. growth rate: 2101Z 1.3%/min (weak)
– EBShear: 38.0 kts; SRH 0-1km AGL: 155 m^2/s^2
– MUCAPE: 2925 J/kg; MLCAPE: 1657 J/kg; MLCIN: -36 J/kg
– MeanWind 1-3kmAGL: 26.4 kts
– Wetbulb 0C hgt: 9.0 kft AGL
– CAPE -10C to -30C: 546 J/kg; PWAT: 1.3 in.
GLM: max FED: 0 fl; sum FCD: 0 fl/5-min
GLM: max TOE: 0 fJ; avg AFA: 0 km^2
Avg. beam height (ARL): 1.28 kft / 0.39 km
Object ID: 273531
PS: 98
GLM usability in heavily parallaxed locations
It’s pretty clear to me that both the GOES-west and GOES-east are having a lot of trouble detecting lightning (GLM) in the northwest U.S. with accuracy of location or frequency due to parallax, spatial resolution, and GOES tilt sampling of storms. Below is an animation specifically over southwest Montana where the GLM displaces the FED significantly (side note: TOE was very similar for these, so FED is shown for best example), and also has trouble picking up in-cloud pulses. The ENTI is overlaid in pink to show the differences in GLM vs ENTI. If you watch closely, the first frame depicts an ENTI in-cloud lightning flash & pulse in the far southwest portion of the screen, where no GLM FED (or TOE; not shown here) was even detected. There is also some instances where the GLM places lightning pixels where the ENTI or NLDN does not show anything in the same time frame (also making it hard to verify both products).
Below is a separate example where the FED does not show what I would expect it to show for a central Wyoming storm (differentiating intensity as well as location and timing). The GOES-east is the first to detect, then the GOES-west detects thereafter. GOES-east and GOES-west did not detect at the same time in any frame. Both products are loaded as a 5min-1min update.
Now here’s a case farther south in New Mexico where a storm cell is of comparable intensity as the northern examples. The GLM detection seems more accurate than the MT case, but the last frames here show that the GLM also has trouble with keeping FED on the cell core of interest.
Interestingly enough, the TOE (shown below) does a better job here in NM with spatial coverage than it did up north in MT, but still has displacement issues comparing to ENTI and MRMS storm cores. I find that the TOE (especially with GOES-west) does a better job at recognizing the spatial extent of a flash here than the FED product did. (See above vs. below).
Now the question is, is the parallex better in the south-central U.S.? And what if we look at higher resolution products like the group centroid density GLM product? While comparing the satellite GLM, with Day-Land-Cloud-Convection RGB, and with the ENTI/GLD/NLDN strikes (overlaid in pink) in SE Missouri…..it’s clear that a forecaster should not solely rely on GLM for core lightning locations (below). -shearluck
Reiterating the use of GLM over open water
A great example of GLM usability is over the Gulf of Mexico (or any open bodies of water) where radar coverage and ENTI lightning sources diminish. Here’s an example of how a system moves eastward over the Gulf: radar disappears, but GLM (and some NLDN/ENTI) lightning data still lets you know where the strongest storm updrafts are located. Not only that, but the spatial extent of lightning is better known now that you have GLM alone. Below is displaying radar and satellite with FED GLM data, and NLDN/ENTI lightning detection. ProbSevere also becomes less relevant. The separate updrafts are easily distinguishable toward the end of the animation using FED.
Next animation is the same, but with FED on top of radar making it easier to see its evolution and usability:
Now with the same scenario, comparing the Minimum Flash Area (MFA) GLM product with the Average Flash Area (AFA) GLM product, it is MUCH easier to differentiate new convection with the MFA product. Notice all of the yellow spots in NM and Mexico that make it easily detectable with the human eye as you watch your SA monitor. This may be a product of color scale for the AFA, but this tells me that the MFA would be more useful in convective initiation. I have not gotten much value out of the AFA as I would with just simply using the FED (Flash Extend Density GLM product) or TOE (Total Optical Energy). -shearluck
TOP IMAGE: MFA ; BOTTOM IMAGE: AFA
GLM Weak Convection
On a day with weak convection, it was interesting to watch the Minimum Flash Area and how it related to storm structure. As expected closer to the updraft, smaller flashes were noted, but there is clearly a larger flash that extends out into the anvil area. This is quite the distance from the core of the storms, and thus would have impacts on DSS based services and potential lightning strikes to outdoor events.
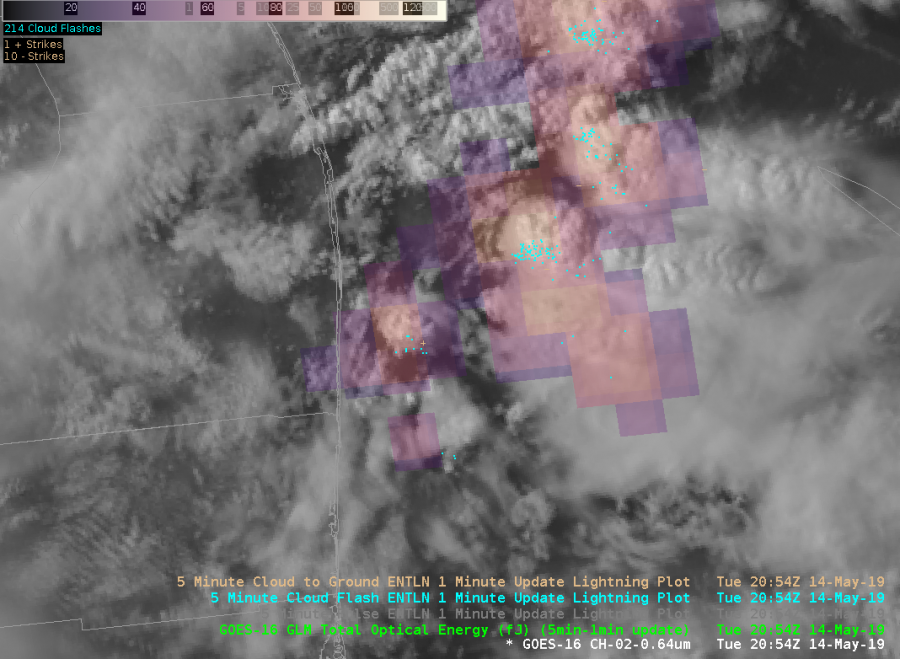
ProbTor reliable? Lightning says no, MRMS says maybe.
There is difficulty with having confidence of the ProbTor portion of the ProbSevere product due to an instance where it is estimating higher tor rates (8%) when a storm has no identified lightning (GLM, NLDN, and ENTI) along the coast of Florida. To be fair, the storm previously did indicate some lightning with it. I investigated the TOE, FED, and Min Flash Area in the vicinity of this storm, as well as usual point lightning data in 5 and 1 min updating intervals, and it has me confused as to what the ProbSevere is “seeing” for its lightning data (it is indicating ENTI lightning within its circle). Below is the image example of ProbSevere loaded alongside lightning data including GLM’s Min Flash Area:
I also pulled up the lowest level rotation tracks from MRMS data, and it did indicate a slightly higher maximum within the ProbTor circle, so I believe the ProbTor is locking on to that feature. – shearluck
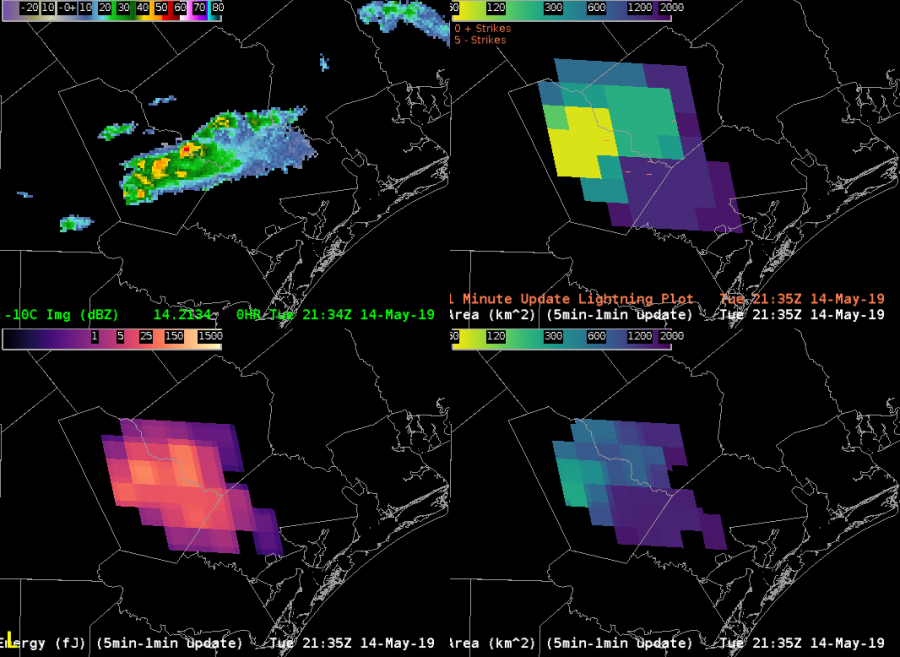
Wrappin’ my head around some other GLM stuff
Upper Left: 1-minute visible with 5 minute cloud flash (1-min update)
Upper Right: Total Optical Energy
Lower Left: GLM Average Group Area
Lower Right: Event Density
Bright yellow/orange colors on lower left depict a smaller average group area associated with a tighter concentration of flashes. We are intermittently seeing greater concentrations at the southern extent in an area otherwise associated with little activity.
Now taking a look at a specific time below…
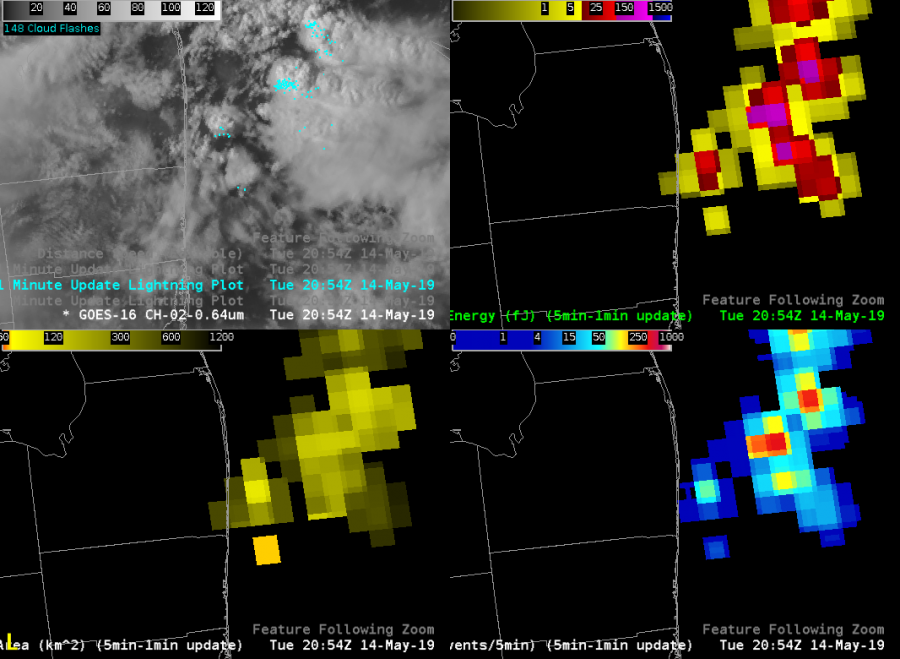
We see a single pixel of orange (lower part of lower left panel) corresponding with a small group area. This appears to be associated with two fairly isolated ENTLN flashes (upper left). Total Optical Energy (upper right) and Event Density values (lower right) are not overly impressive, which is not surprising, given the limited activity.
Now for something else that’s rather striking (ha ha) in the eastern half of this area. ENTLN cloud flashes depict two active areas in the northeast corner but little if any activity to the southeast beyond that. Shown another way…
 So, we see good connectivity in probable electrification from northwest to southeast that is not otherwise apparent in the flash data. So, I’m slowly coming around to the idea that this can be helpful for IDSS applications when lightning is a concern with multi-cell clusters featuring extensive anvil coverage.
#MarfaFront
GLM – Florida Coast
Convection off the coast of Florida developed into a few organized strong to severe storms over marine zones. GLM Flash Extent Density (upper left) was far and away the most useful of the GLM products available for warning operations. The strongest storms were the most evident on this product compared to the others, and rapid lightning increases were most easily noted. This allows for quick use of the lightning data for situational awareness and setting priorities when there are numerous storms to interrogate. The other GLM products generally washed out any signal of which storms were the strongest, and didn’t provide as much information about overall storm trends.
The rapid 1-minute update times that can be linked with 1-minute meso sector satellite imagery and 2-minute MRMS data can allow for more rapid warning decisions (and thus more lead time) when all considered together with base radar data.
Compared to ENTLN 1km total flash data, there wasn’t much difference in warning utility between the two products. The same information can be derived from each product in terms of storm intensity and picking out the strongest updrafts. I would give a slight edge to the ENTLN in terms of product display as the smaller grid allows for better viewing of the background satellite imagery. However, the spatial extent aspect of the GLM has advantages for public safety messaging. So overall a very even match between the two products.
— warmbias —
Fun 30 minutes of storms in Florida
There was a nice area of convection moving off the east coast of Florida with storms forming off an apparent outflow boundary moving to the south. As the storms moved off the coast they increased intensity exponentially. Focusing on these storms as they moved over water reflectivity showed max dBzs in the low to mid 60s with tops 45-50k ft high. GOES-16 Event density (5min-1min update) showed a value of 247 suggesting a nice updraft, which AzShear seems to further support with a bright white color and value of .007s^-1 exactly where the max dBzs/echo tops/GLM data is. In addition,prob severe did a good job of tracking the storms…but with the storms moving off the coast it is impossible to get any storm reports to verify its accuracy.
Utilizing all of this data I would most definitely want to issue a localized small craft or some sort of marine advisory or warning…if there was one for this are. -Desmond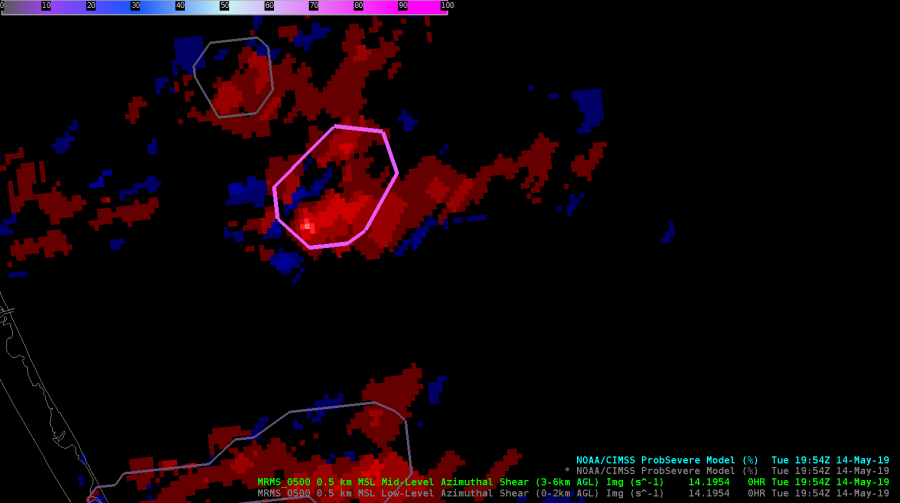
AzShear .007s^-1
GOES-16 Event density (5min-1min update)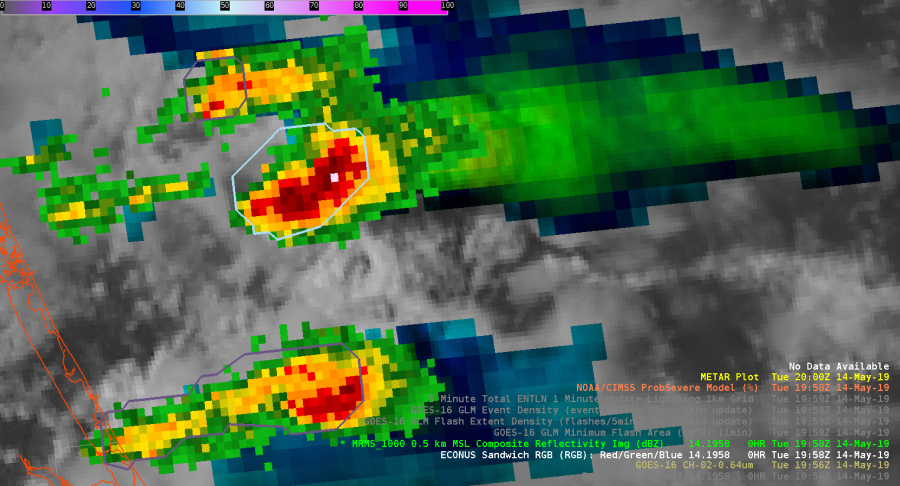
Max dBzs in the low to mid 60s