

This is an 80 minute loop (in 1-minute increments). The visible imagery with an experimental GLM RGB overlayed shows a splitting supercell over SW TX on the afternoon of 5/25/23. -Champion
Category: GLM
PHS and GLM Data for Tampa Florida this Afternoon and Evening
General Risk for Thunderstorms in Florida this Afternoon and Evening
The Tampa CWA is in a general risk for thunderstorms this afternoon and evening per the SPC.

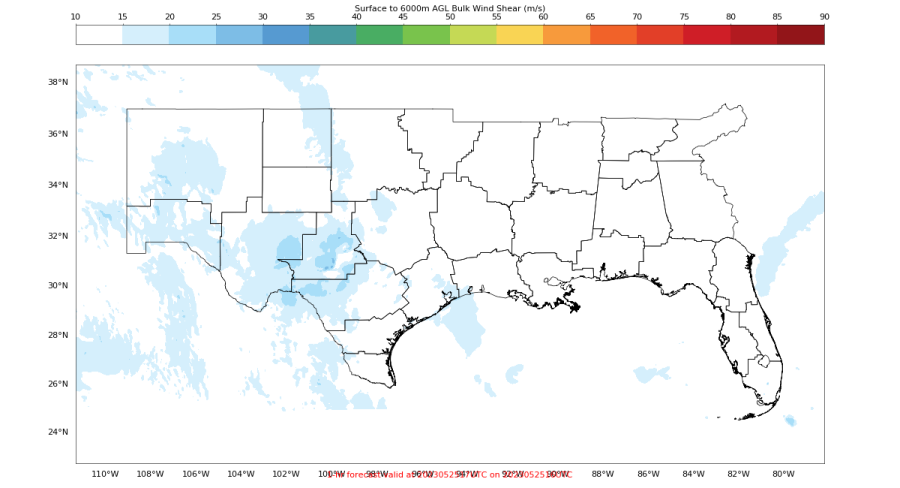
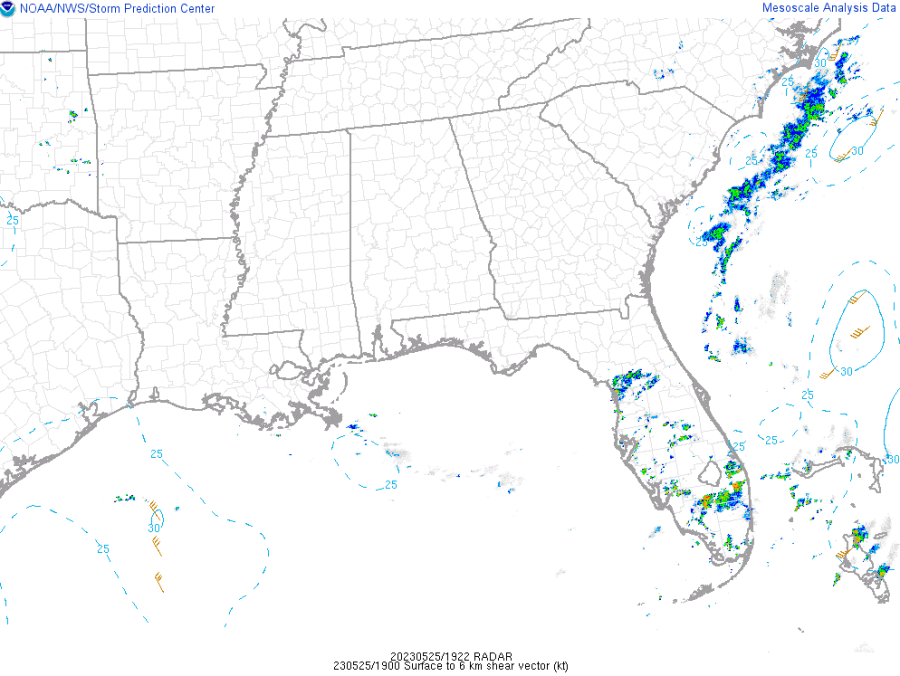
The main potential impacts are frequent lightning, heavy rainfall, and gusty winds thanks to decent amounts of SBCAPE. Localized flooding also remains possible, especially in urban areas, due to slow storm motion as PHS shows no 0-6 km Bulk Shear over Florida. This matches well with the latest SPC Mesoanalysis which also shows no 0-6 km Bulk Shear shear over the region.
NUCAPS showing SBCAPE values at 21Z. Values are highest across the central and southern portions of the Tampa CWA. Areas in green had values around 1600-1700 J/kg. Areas in teal show values ranging from 800-1400 J/kg. Areas in purple range from 200-300 J/kg. 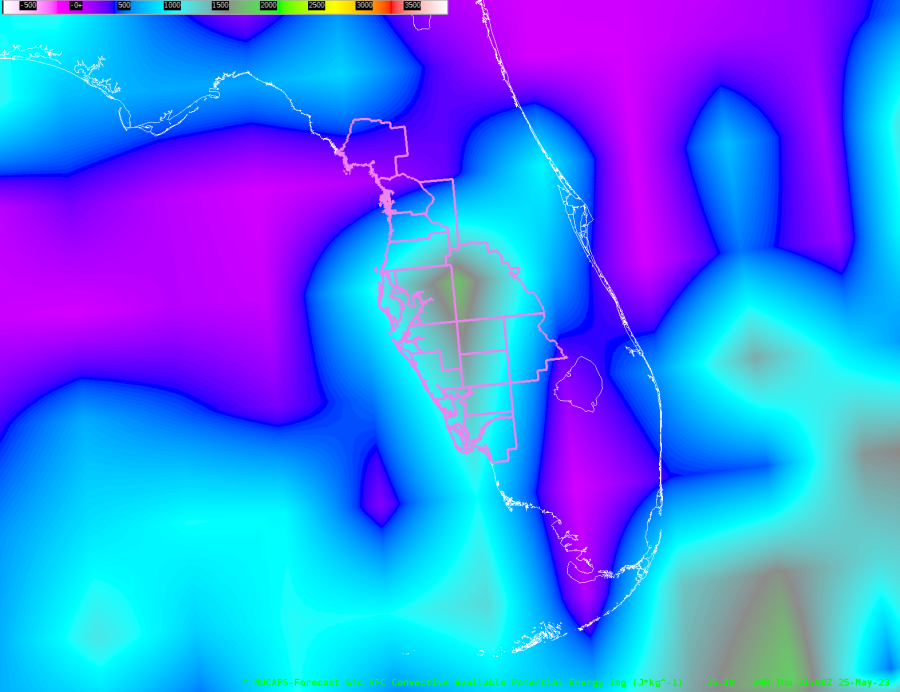 PHS shows a similar trend to NUCAPs with higher areas of SBCAPE across the central and southern CWA with lower values across the northern half of the CWA. However, the color scale on the online version of PHS is difficult to interpret as the gradient ramps up from light red to dark red. So, you cannot really pinpoint specific values of SBCAPE. However, you are able to see areas of lower SBCAPE and areas of higher SBCAPE at a glance.
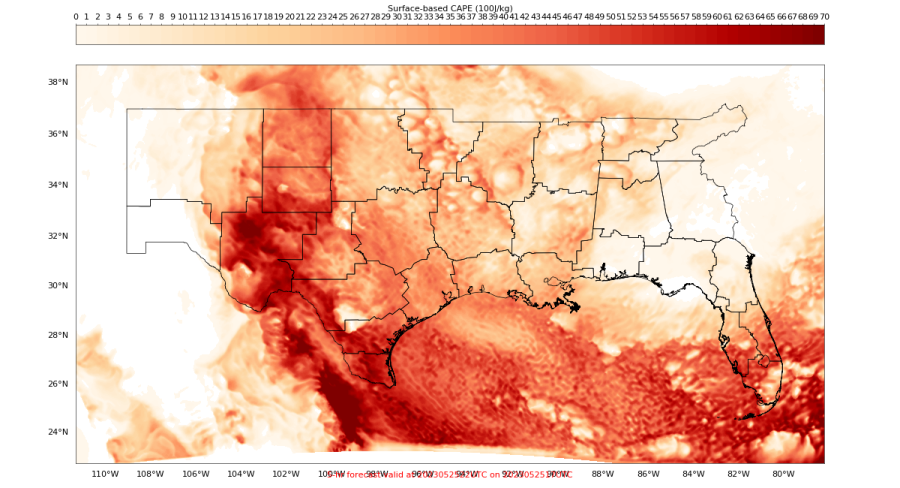
ProbSevere version 3 increases our confidence that storms will remain generally sub-severe as ProbSevere values are below 10% across the Tampa CWA as of 1930Z.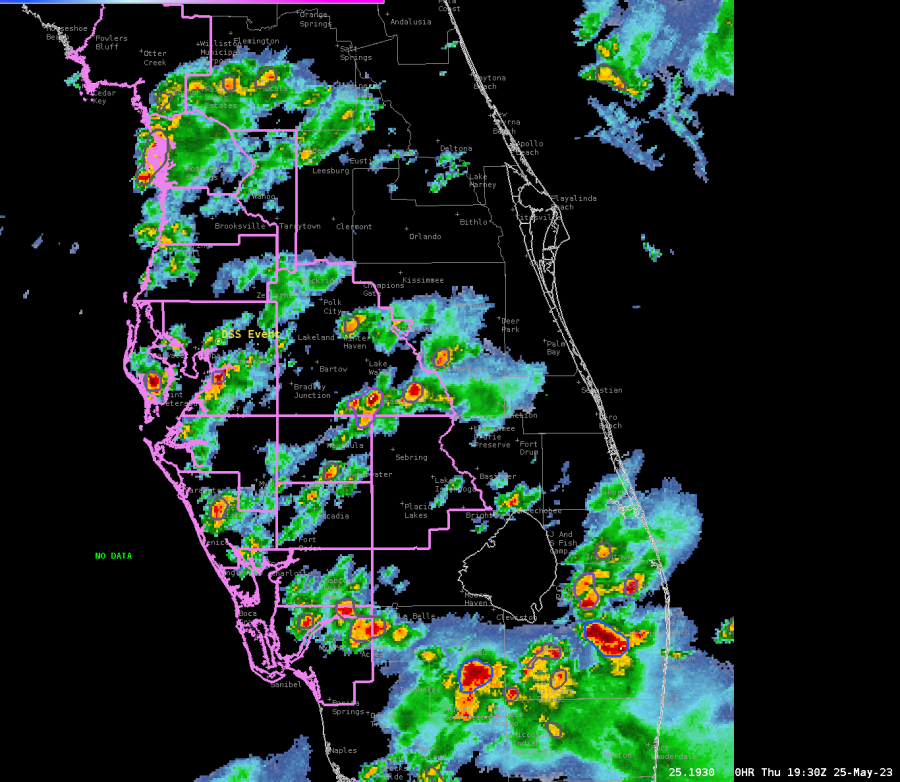 The Octane Speed Sandwich product further confirms that storms are remaining below severe limits as the strongest storms are noted over southeastern Florida this afternoon as of 1930Z. Not only do these products help us pinpoint areas of potential severe weather, but they also help us pinpoint areas of sub-severe weather.
  GLM shows lightning activity increasing across the Tampa CWA early this afternoon, and activity is expected to gradually increase in coverage as more thunderstorms develop through the late afternoon and early evening hours.
  Lightning Cast around 1930Z shows lightning probabilities increasing across the Tampa CWA over the next hour. Pink contours represent a 75% chance of lightning in the next hour. Green represents a 50% chance, teal a 20% chance, and dark blue a10% chance of lightning in the next hour.
 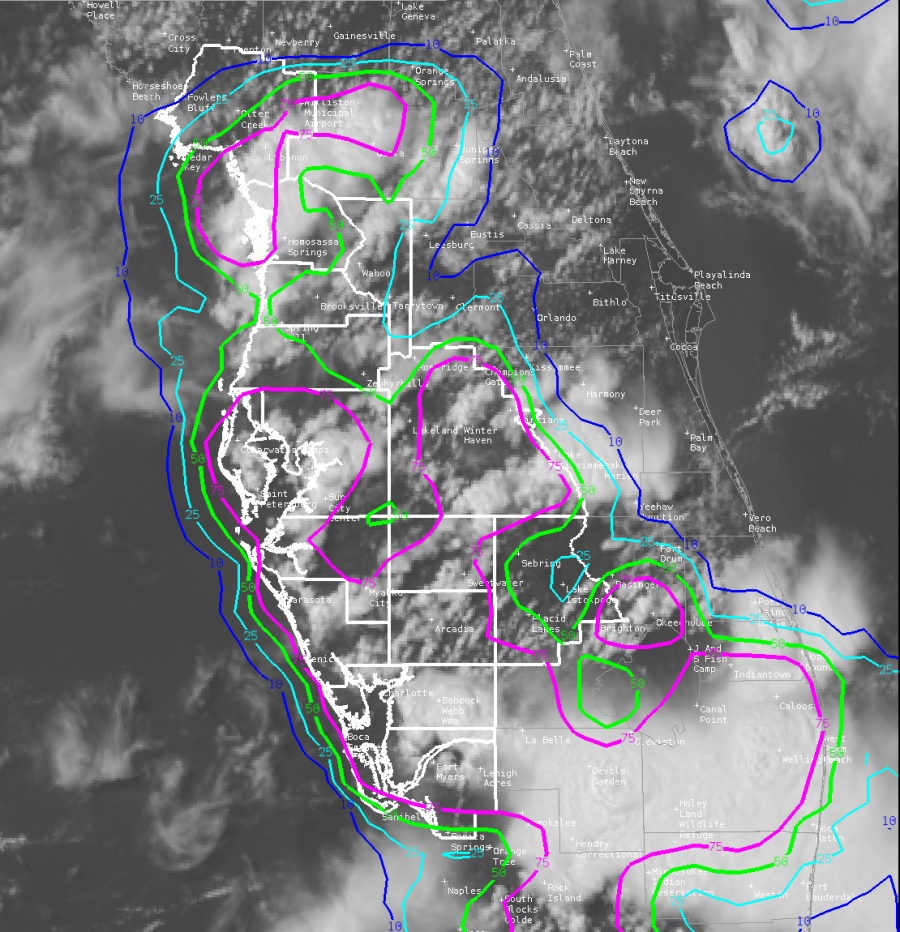 GLM showing lightning activity increasing across Florida from 1930Z through 2016Z across the Tampa CWA. Areas showing more oranges and yellows have shorter flashes and more lightning density. These areas help us know where stronger updrafts are located. The strongest updrafts at the time of this loop remain outside of the Tampa CWA.
  -Dwight Schrute
Using GLM to track thunderstorm life cycles
GLM FED/MFA RGB here shows the rapid thunderstorm life cycles in the weakly sheared but highly unstable Florida atmosphere, as reds to yellows (intensifying convection with lots of short cloud flashes) give way to blues and purples (weakening convection with fewer but longer flashes). The range rings circle today’s DSS event, which also highlights the difficult nature of producing storm by storm headlines or products for public safety as the life span of these thunderstorms are brief. The messaging for today highlights the consistently sporadic lightning threat for anyone on the coast or at the DSS site while storms build and collapse over a matter of minutes. 
-Joaq
Using GLM to decide to issue an SPS
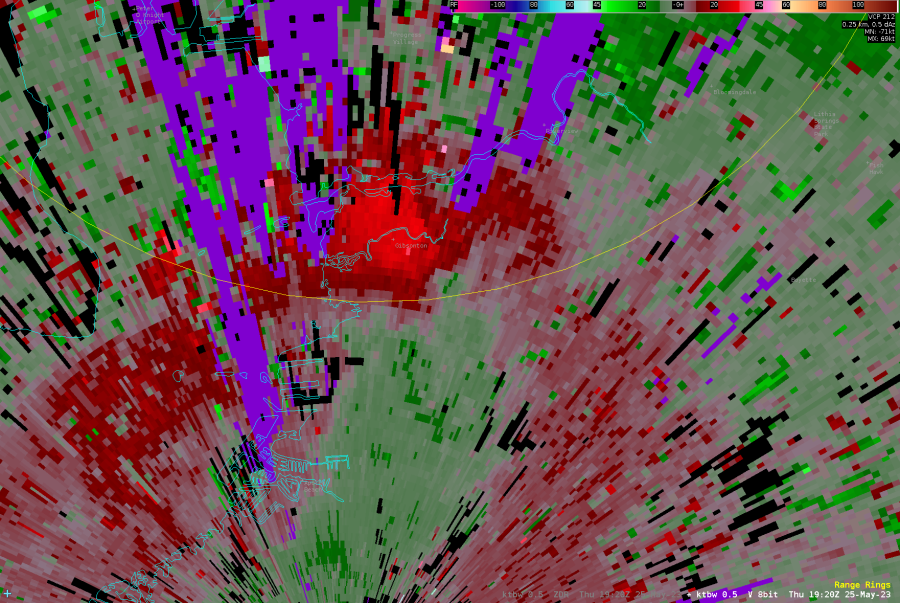
GLM RGB showed the progression of a developing storm near the TBW DSS site this afternoon. Not only was lightning a threat communicated to the DSS site, but KTBW radar depicted a downburst signature as shown below, which prompted us to issue an SPS for wind to around 40 mph, frequent lightning, and heavy rain. 
 track a developing storm near the Florida State Fair
-Joaq
Using Octane, GLM, and ProbSev for Warning Operations with Very Little Radar
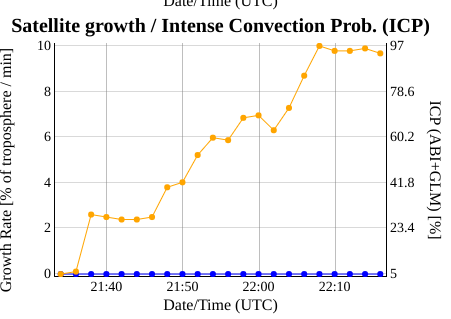
A severe thunderstorm warning decision in eastern New Mexico was a challenge today as it was within a KABX beam blockage and the eastern NM radar, KFDX, was down. The signs of the intensifying storm were found on satellite, GLM, and then slowly ProbSevere as the radar reflectivity heights from KAMA (the nearest valid radar) were very disorganized and slow to respond compared to the trends depicted by satellite and GLM trends. An above anvil cirrus plume, IR thermal couplet, consistent GLM FED/MFE signature, and cloud top divergence depicted by the Octane Speed/Direction product showed signs of strong convection developing. While reflectivity below showed just a minimal 50 dbz core and no 60 dbz core. As ProbSevere V3 gradually increased to around 35%, the ProbSevere Satellite Growth/Intense Convection Prob. quickly increased. The satellite growth/Intense Convection is not weighted as high in V2 and because of that ProbSevere was much lower at the same time. While the radar reflectivity core was still missing, we decided to issue a warning for the storm given the other satellite based signatures. ProbSevere V3 began to show strong chances for severe weather approximately 13 minutes after the warning was issued, and a strong 60 dbz core developed on the KAMA radar shortly after with MESH getting as high as 3.5 inches.
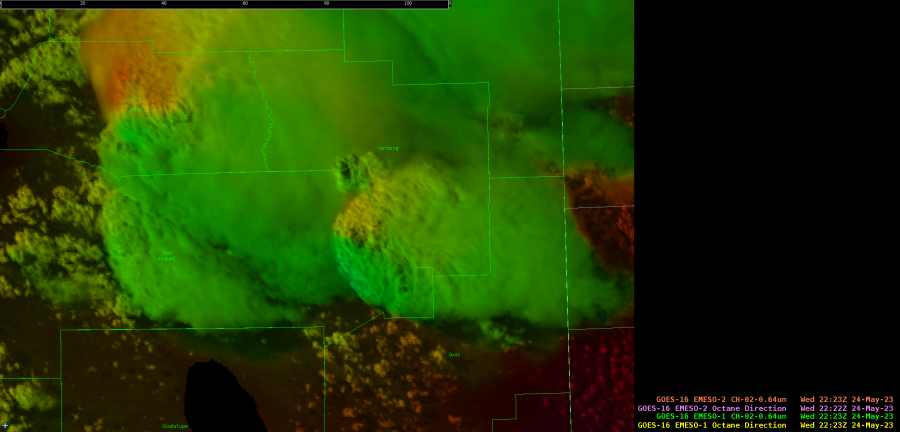 GOES-16 Octane Direction.
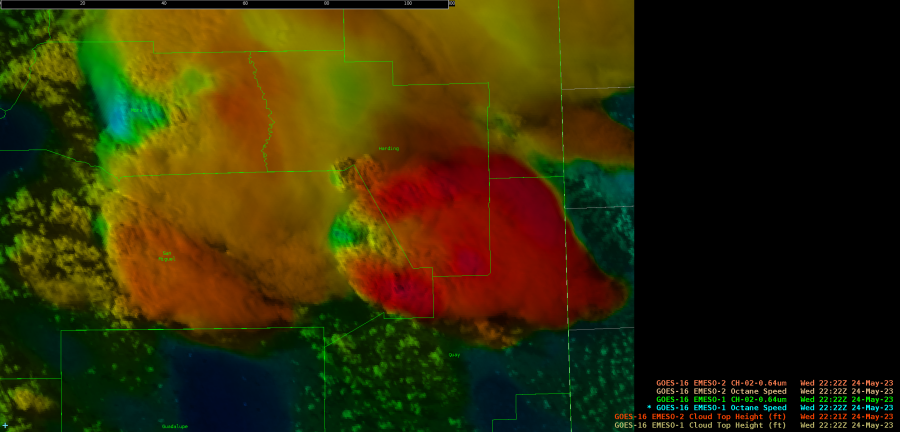
GOES-16 Octane Speed.
GOES-16 GLM RGB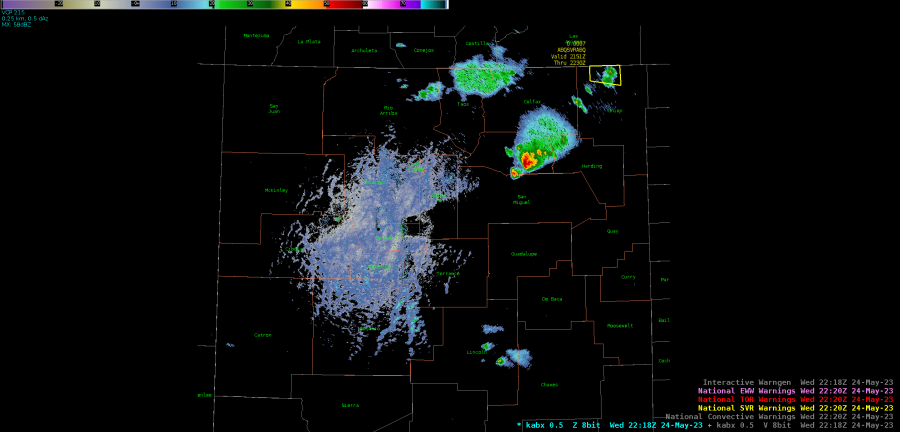
KABX 0.5 degree reflectivity.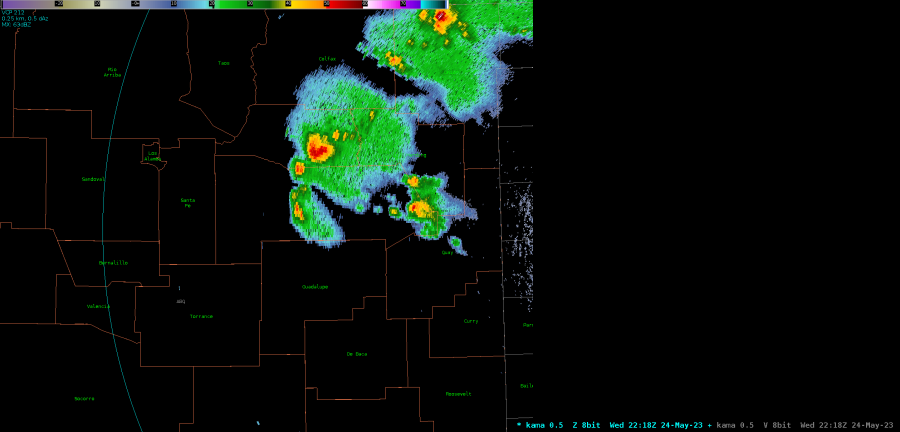
KAMA 0.5 degree reflectivity.
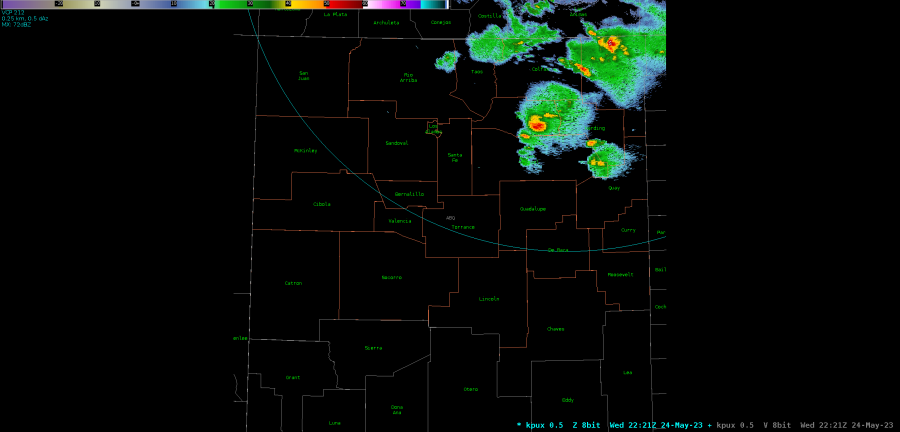 KPUX 0.5 degree reflectivity.

 _
_
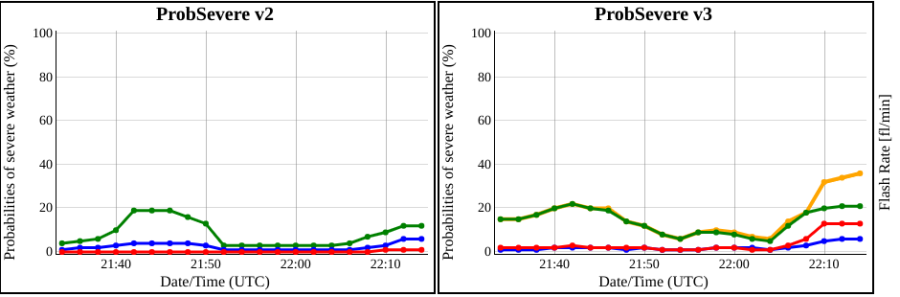
ProbSevere probability charts.
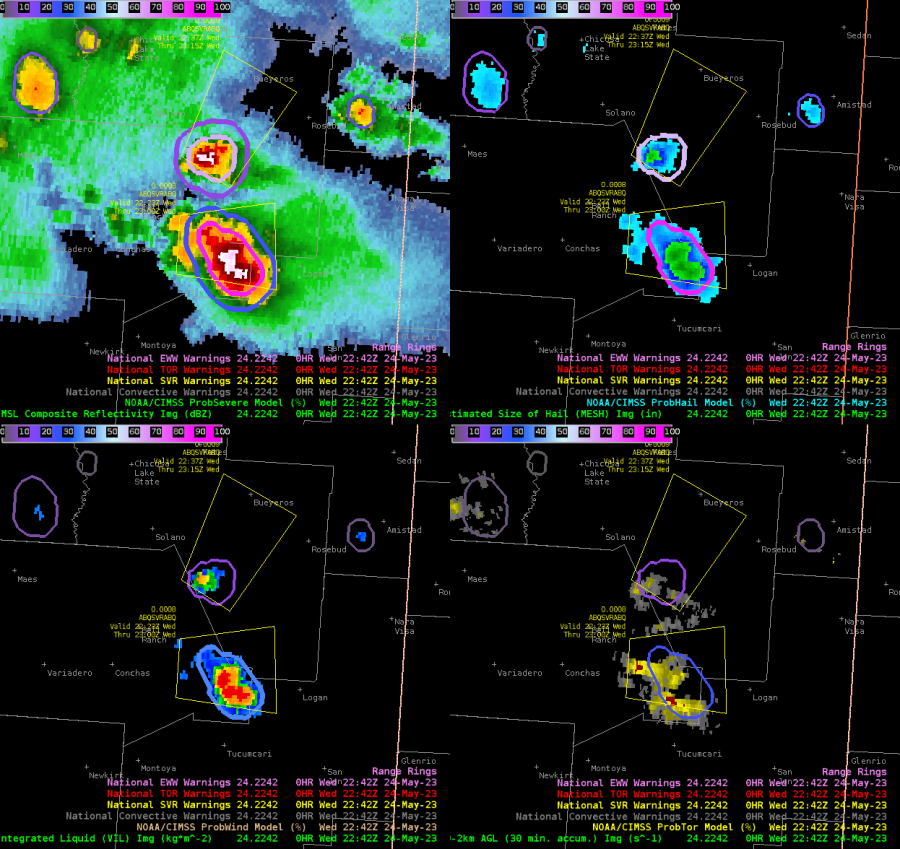
MRMS output showing radar data approximately 20 minutes after warning issuance.
-Thunderstruck
– Joaq
Satellite HWT Day 3 Carl
Wednesday Satellite HWT Thoughts
PHS Model Comparisons and Thoughts
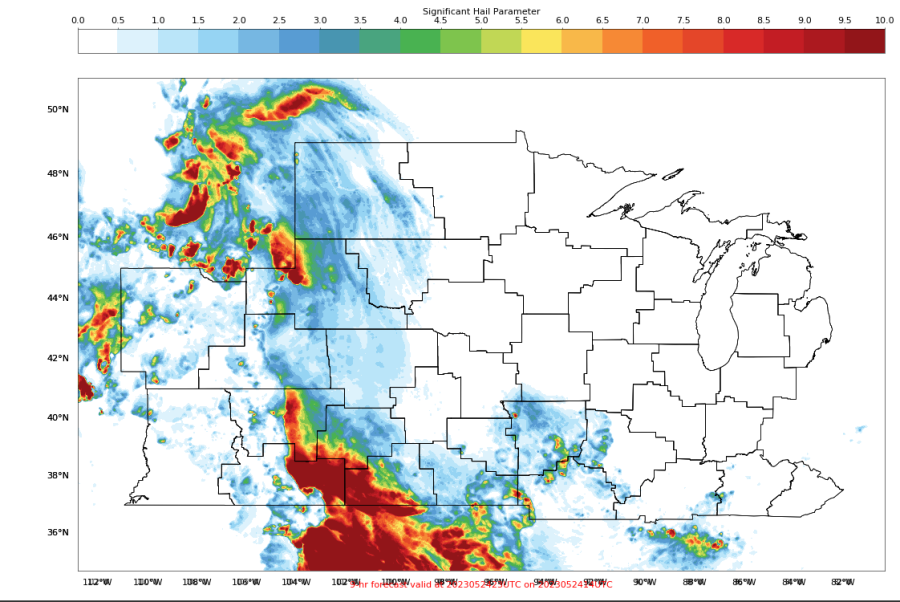
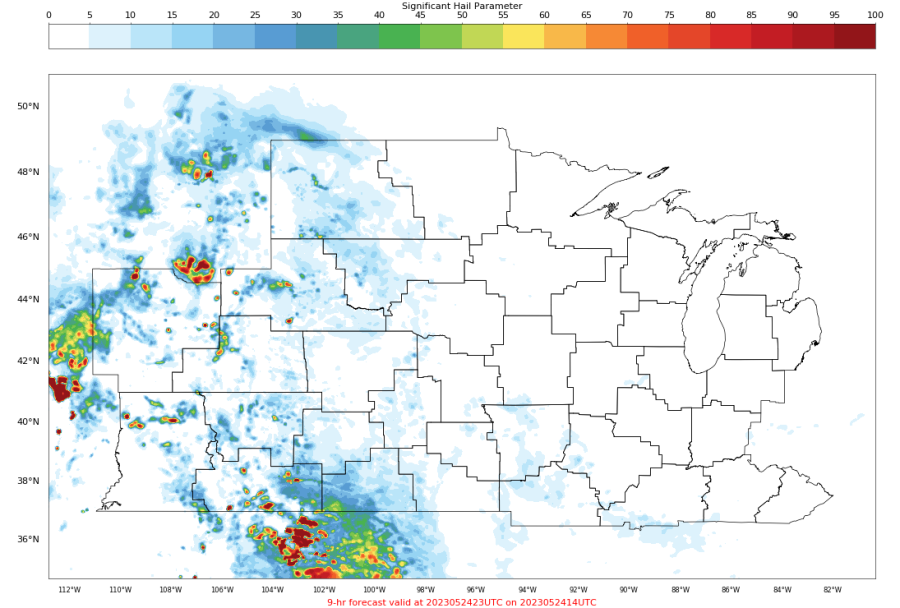
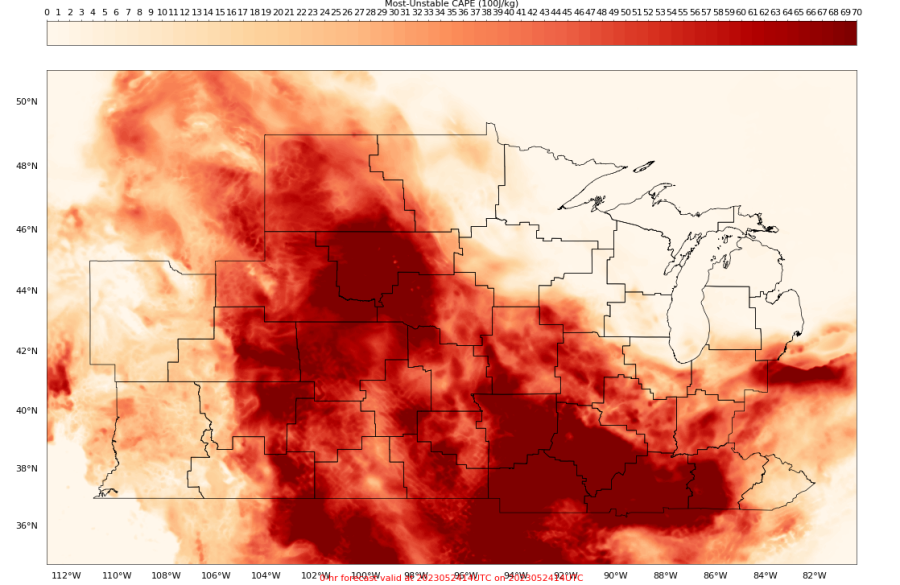
Above: Top is HRRR SHIP parameter, bottom is PHS SHIP parameter.
Looking at some of the convective parameters and indices around the CWA I was working with today (PUB), one thing that really stood out to me was how “splotchy” many of the parameters were when compared with the HRRR model. It’s very hard to believe that the model, especially at a 3 km resolution, is able to obtain that level of accuracy with regards to these parameters, or at the very least having gradients this sharp in many of these parameters doesn’t make much sense. Wondering if some of it is being driven by the extreme CAPE gradients that do show up later on, which are certainly going to be drivers in many of the severe indices.
Another thing I noticed is what looks to be a wave-like numerical instability within the first hour of the model – this could be having some big impacts on the model forecast, as you can see these reflected in the base fields (T, u, v, etc) and then having impacts on many of the other derived parameters that last through the forecast period, as shown in the image below:
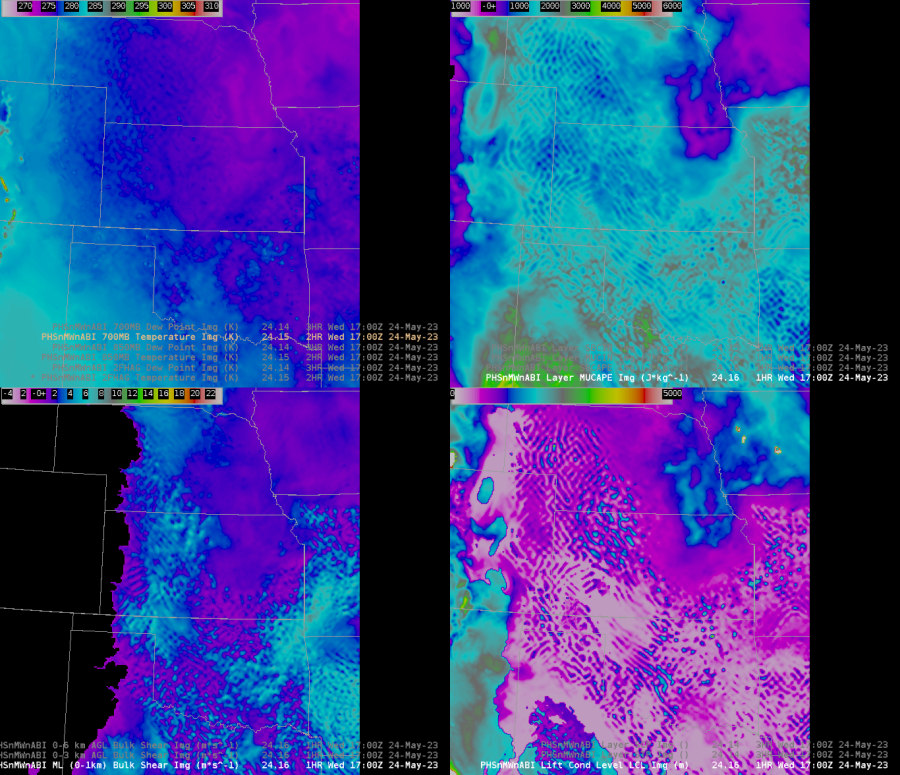
CAPE also seems to initialize really high, then “jump” down to a lower value at the first hour. This is quite a large “adjustment” from the initial conditions that the model seems to start with. Shown below are hour 0 of the 14Z run and hour 1 of the 14Z run from Wednesday 5/24.
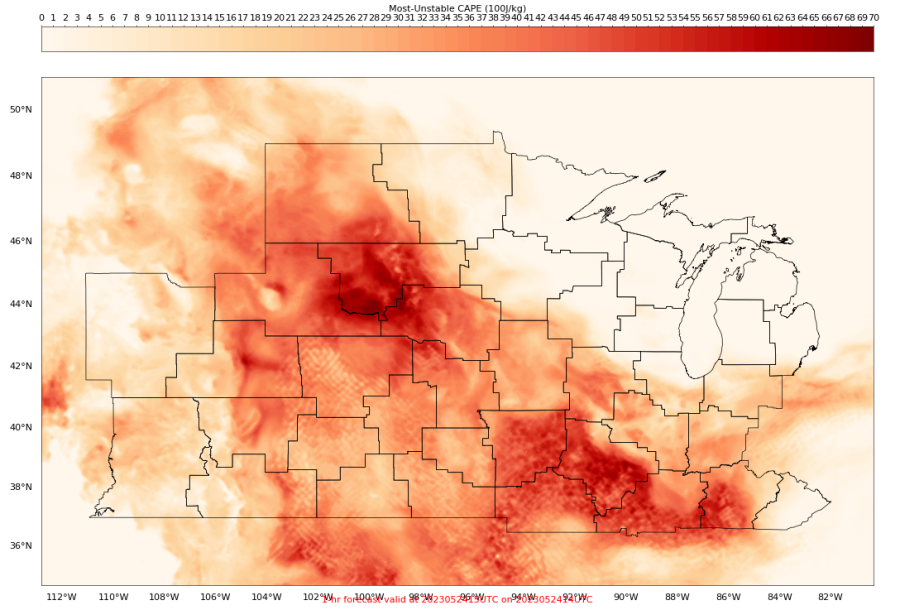
You can also see the numerical instability within this field that is in place across a large portion of the domain.
OCTANE
Octane was able to capture an interesting view of the Above Anvil Cirrus Plume on a very powerful storm along the New Mexico/Colorado border during the afternoon hours. The cirrus is a bit slower than the surrounding clouds within the sheared environment, providing that “V” type shape that we’ve come to associate with some of the strongest updrafts:
Another good example of using Octane for surveillance of storms – the direction product really highlighted another storm that quickly grew on the flank of another severe warned storm. Big value especially in areas where radar coverage might be limited by mountains, such as in the CWA I was working in today (PUB):
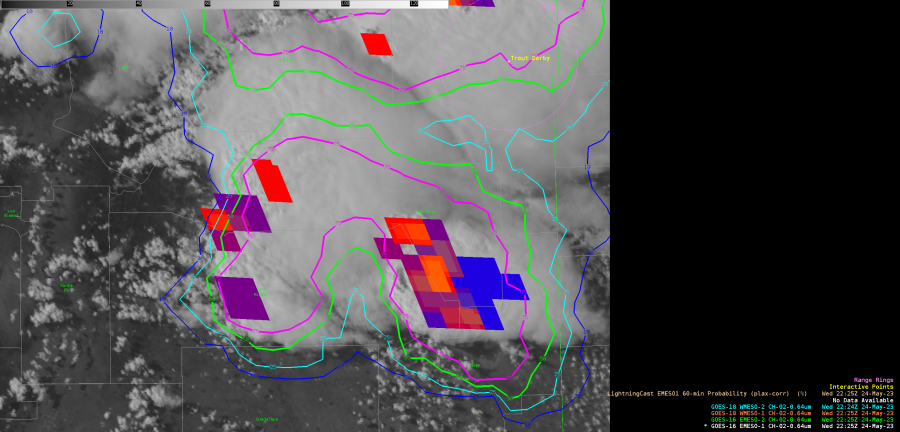
LightningCast
Used the LightningCast product extensively for DSS purposes today. We had a pretend outdoor event located in Pueblo, Colorado. A very strong thunderstorm (MESH estimated nearly 3″ or larger hail at one point) which passed within a few miles to the south and east of the city. I used the LightningCast probabilities in AWIPS overlaid with satellite data to provide multiple updates to Emergency Management, using it to confidently state that probabilities of lightning were increasing as storms approached from the south. Lead time for action would have been within the 45 min to 1 hour range. Was able to confidently say they would see lightning within the 10 mile range a good 15-30 minutes before the first strike occurred within the range per the ENTLN network data. Below is the LightningCast time series as output on the webpage for the KPUB airport, which is very close to where the DSS event was taking place:
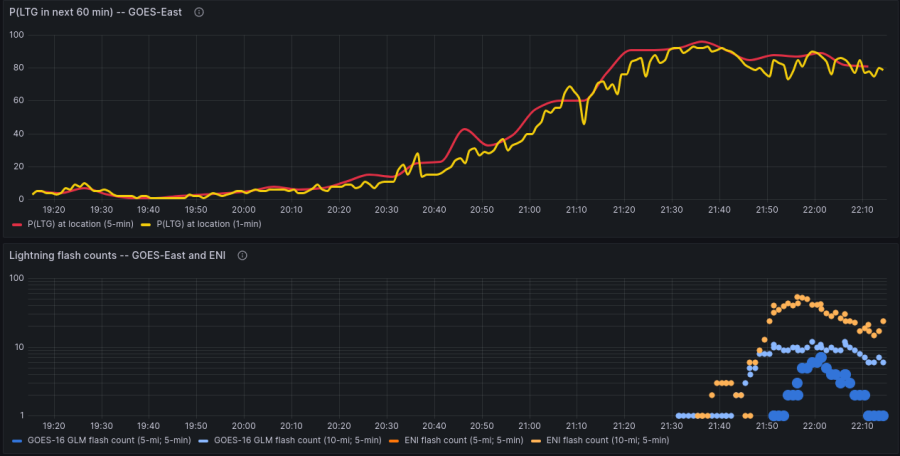
There is definitely some very actionable lead time here. As a forecaster, having this type of data available to me outside of AWIPS is a game changer. I know it may be challenging, but being able to click on a point like this and get this type of information would be huge for briefings and emails with decision makers. Right now we are limited to airports. Even a relatively coarse mesh that would allow me to pick a close point would be extremely useful if these images can’t be generated on the fly. Other possible ideas include only generating points within a certain LightningCast threshold (say 10%), or generating them on the fly based on a click query. That all said, even in its current form I will be using it going forward, and making a point to share it with my office and WCM for DSS.
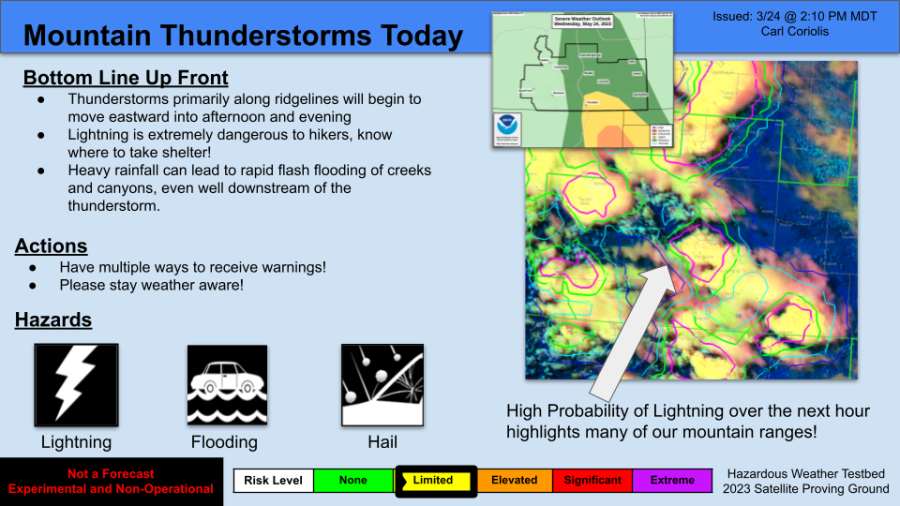
I also made a social media type graphic using the LightningCast product for hikers, given the large number of mountains within the CWA. Perhaps would have been a bit more meaningful to have sent this as storms were beginning to form, but they were already cooking once we got spun up and started. Highest probabilities were hugging the mountains where storms were forming. If I were formally posting to social media, I may have added some lightning safety graphics or something to that effect as part of the post (twitter thread, multiple images in Facebook post).
GLM RGB
This product does a great job in my opinion combining information from the FED and MFA. I found it useful for detecting lightning jumps within storms while still maintaining information about the overall coverage of lighting. Would happily use this as my primary GLM viewing option in AWIPS.
-Carl Coriolis
Octane Speed and GLM Act as Nudgers for west central Elko County Severe Warning
Octane Speed and GLM Act as Nudgers for west central Elko County Severe Warning
The Octane speed sandwich product highlighted a minimum in velocity in a rapidly developing thunderstorm across west central Elko County, NV, an indicator of strong outflow in the anvil on upwind side of the developing cell. An analysis of 1-minute GLM data also indicated a rapid increase in flashes for the same storm. These indicators acted as strong nudgers for the severe thunderstorm warning decision making process.
Octane Speed Sandwich indicates explosive convective development in west central Elko County. 2027Z to 2054Z
Visible satellite imagery coupled with 1-minute GLM depict rapid increase in lightning in west central Elko County. 2012Z to 2054Z
– Rain-Free Bass Guitar
GLM and Lightning Cast
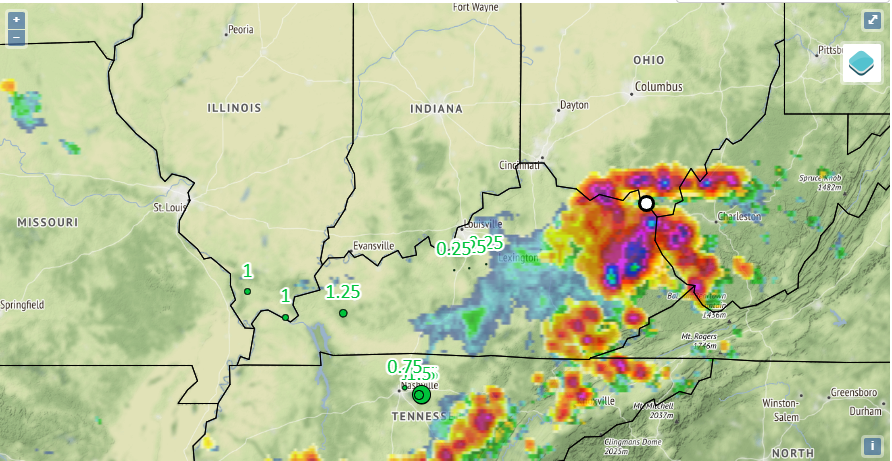
The GLM parallax showed up again Thursday, June 16th, over the PBZ area. This was even more evident than yesterday’s event in WI that was written about in a blog post. Figure 1 has ProbSevere, LightningCast, GLM Flash Extent Density, and ENTLN data overlaid in a 4-panel. This case was fairly simple to “self correct” the parallax as the GLM was clearly displaced to the north of ProbSevere (as well as the base reflectivity). Really once you get a few cases under your belt recognizing the parallax, it’s not too challenging to keep that “self correct” in the back of your mind. One interesting thing to note about Figure 1 is the storm just outside the PBZ CWA just south of Mount Veron, Ohio (See bottom left in Figure 1). The ProbSevere and GLM FED are lined up perfectly and this is a great example of utilizing the lower threshold in the colormap. The bullseye shows up much nicer than the larger thresholds in the top two images.
Figure 1: GLM with ProbSevere and LightningCast
– Podium
Observations from BUF on Thursday June 16th
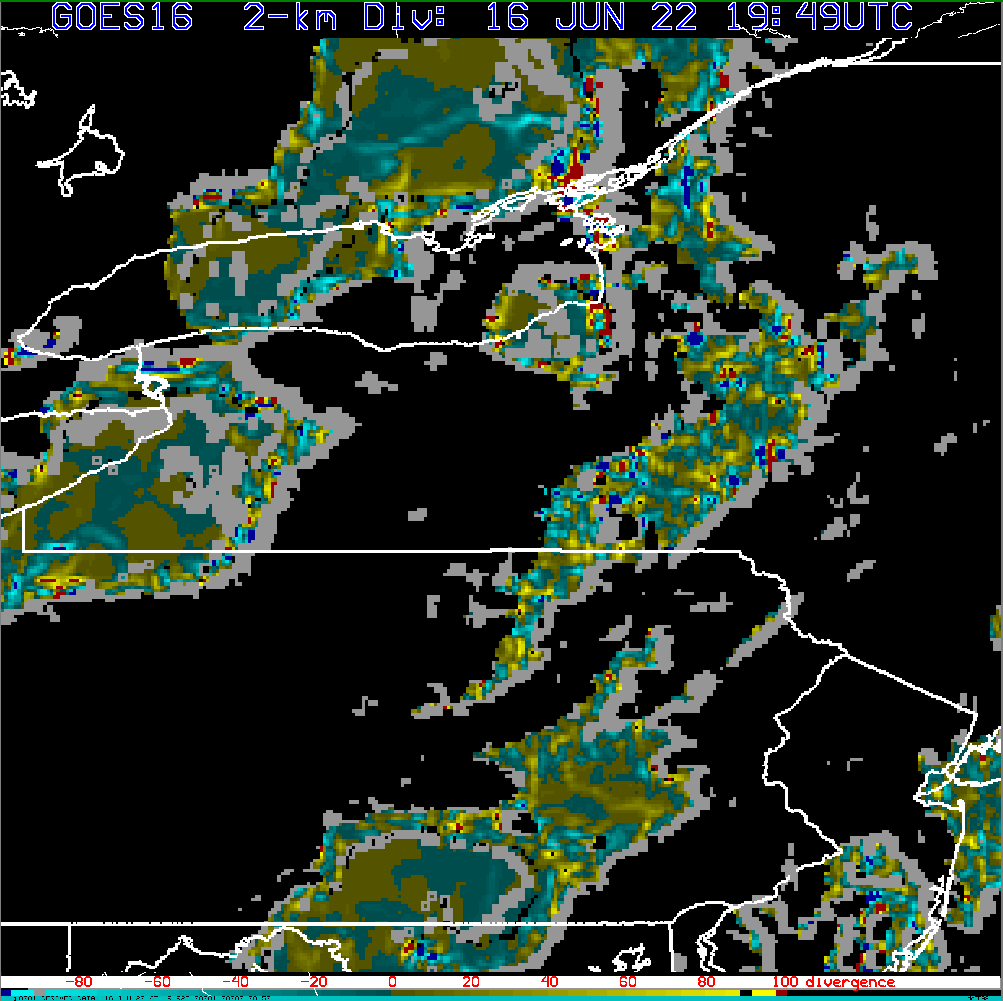
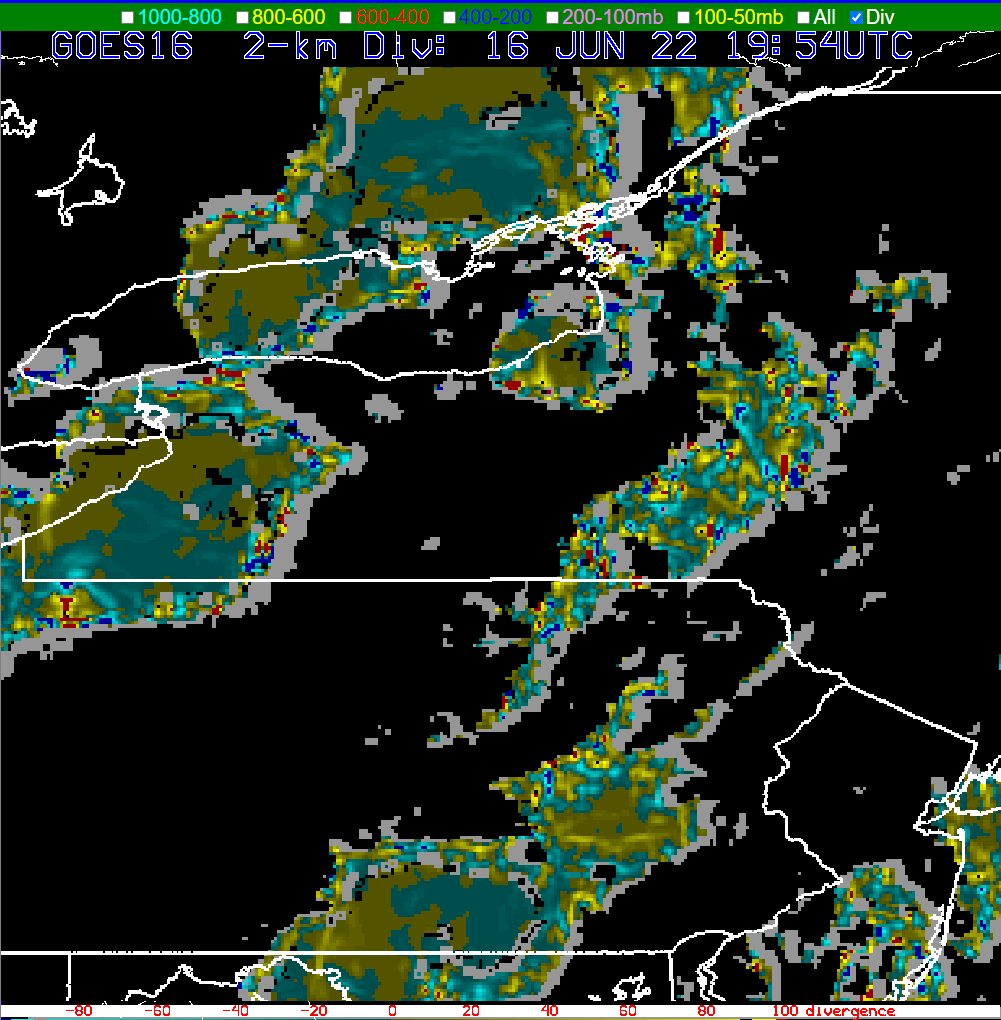
Optical Flow Wind Storm Top Divergence Can Aid in Warning Operations
The storm of the day produced a 2.5” hail stone near Cato, NY.
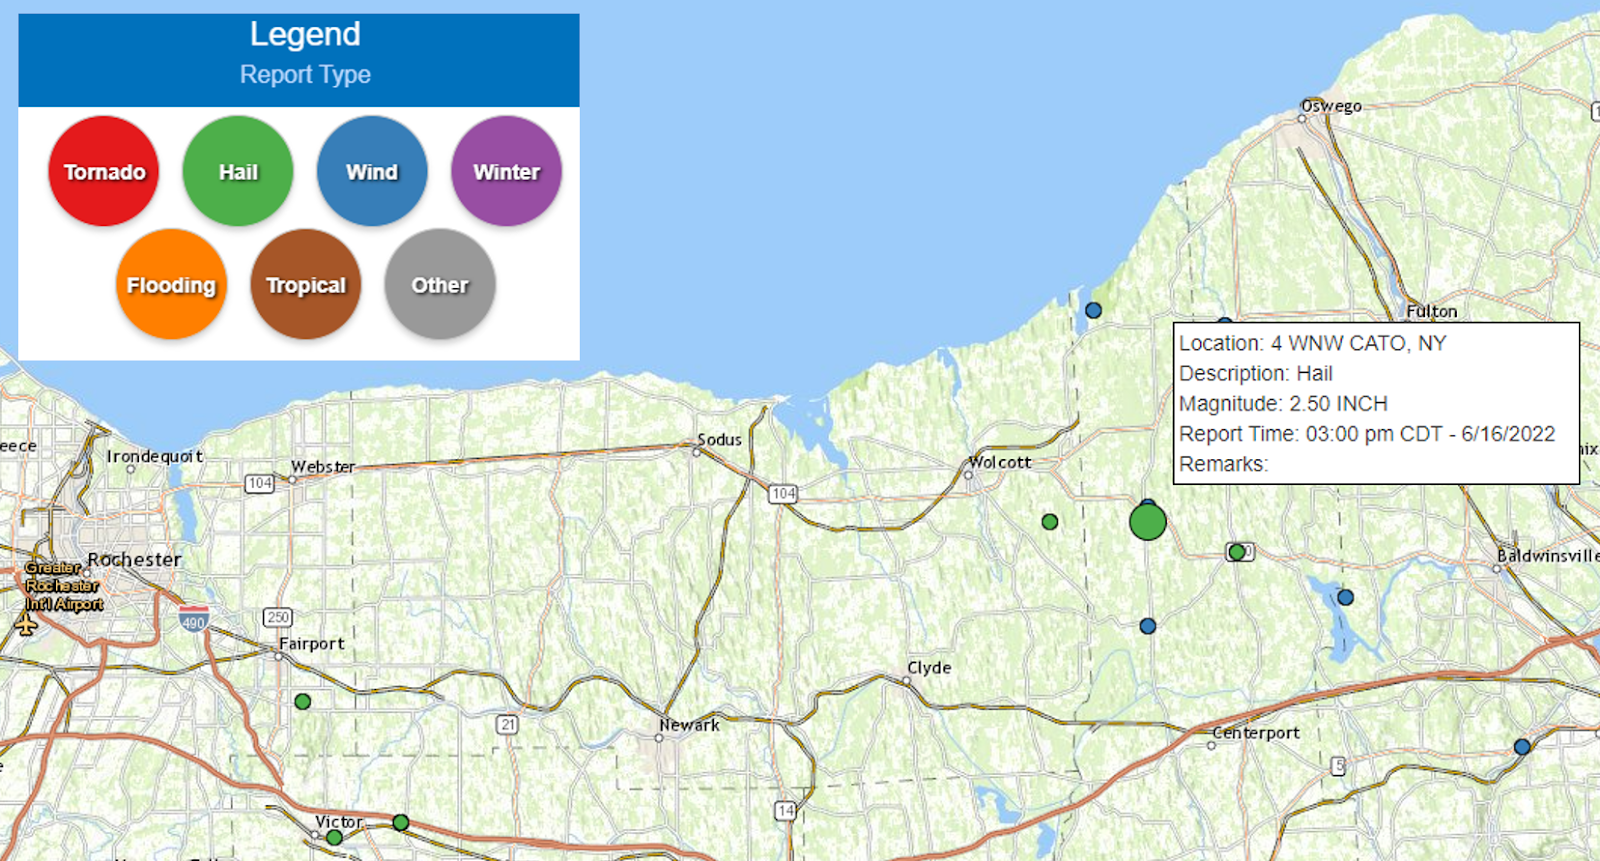
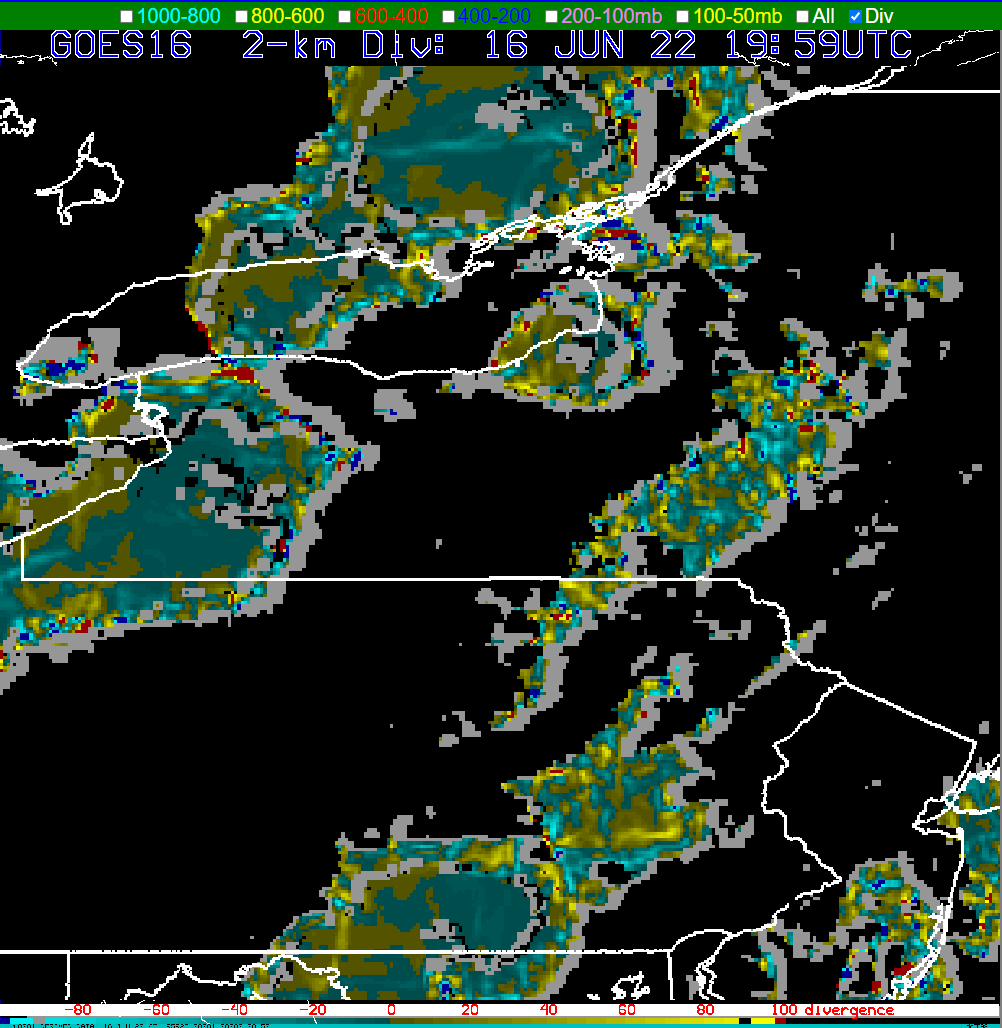
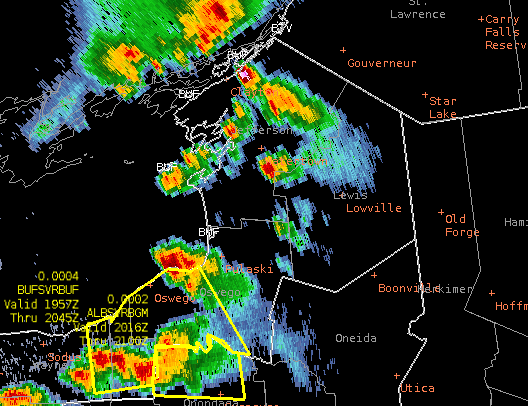
Strong storm top divergence signals an intense or intensifying thunderstorm. Matched with upper level radar scans, satellite interrogation (clean IR), and ProbSevere, optical flow wind products may be another tool to aid the warning forecaster and/or storm scale mesoanalysis, Below are the corresponding optical flow wind storm top divergence images approaching 4 PM EDT (3 PM CDT) when the sig severe hail was reported. The thunderstorm of interest is centered just south of eastern Lake Ontario.
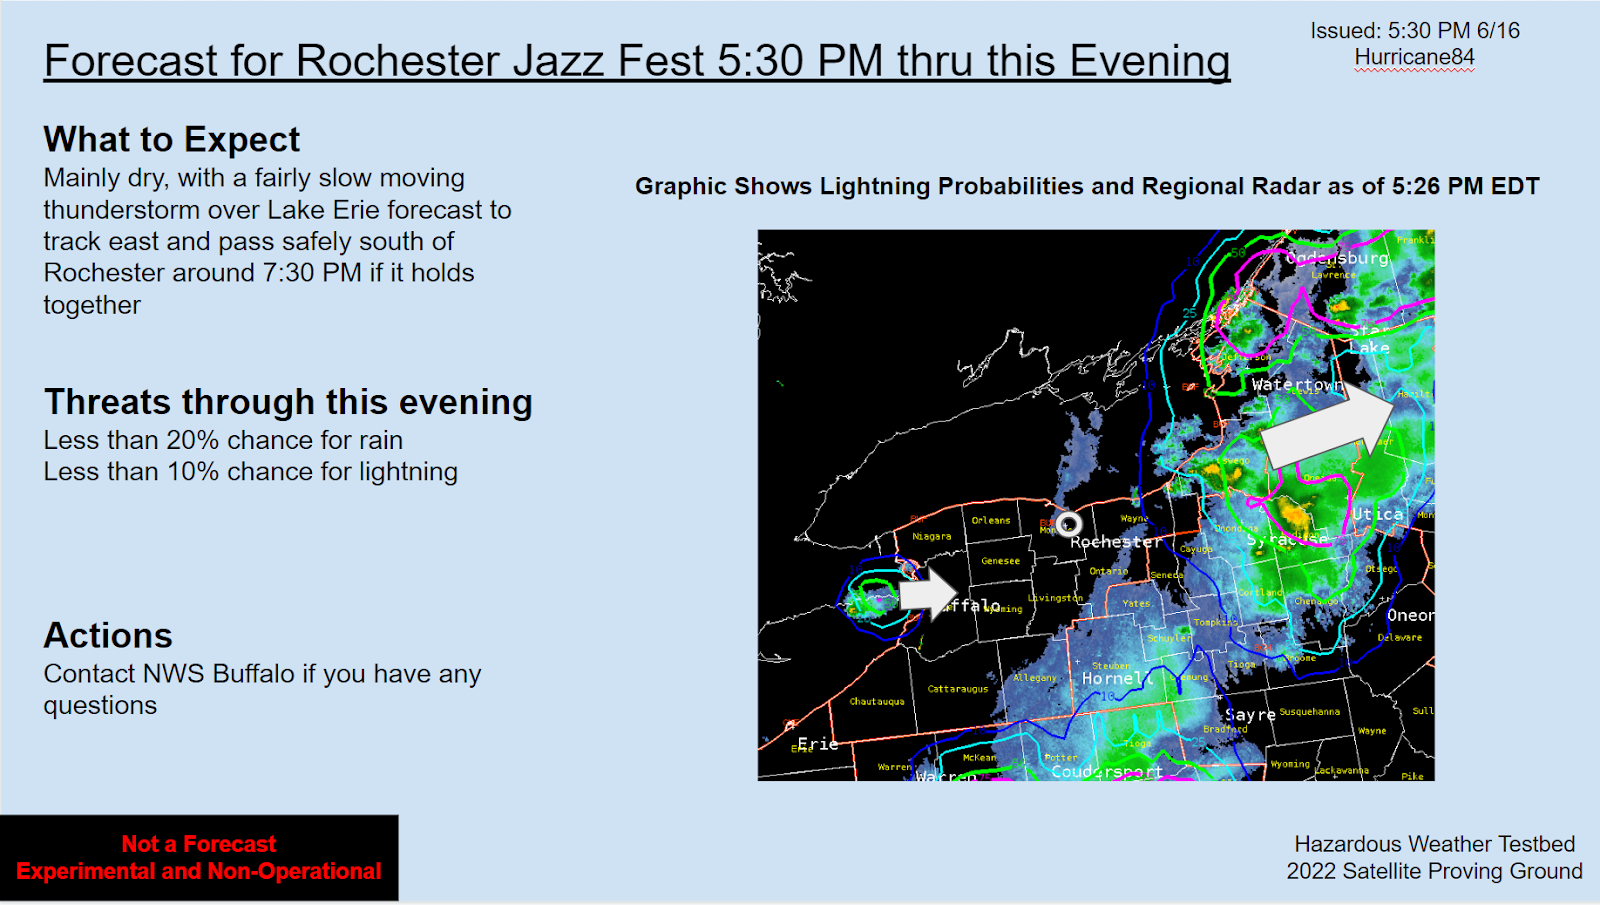
LightningCast as Graphical Messaging/IDSS Tool
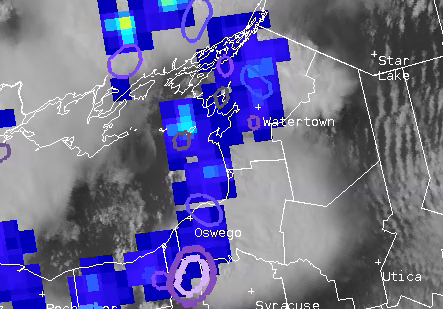
As the DSS and graphics person for BUF, I took the opportunity to highlight the utility of LightningCast for Graphical NowCasts and DSS graphics. The fairly broad brushed nature of the lightning probability contours at the timesteps utilized for graphics I think is a positive for a few reasons: they show actionable probabilities (10+, 25+, 50+, 75+) that users can understand; the contours are akin to annotations on a radar graphic, so would be a time saver; and finally, broad brushed is a way to prompt users and partners to seek out more information, like real time zoomed in radar data, perhaps calling or sending us a chat on NWSChat, or even simply keeping an eye on the sky and listening for thunder. The parallax corrected product in the images below I feel would be more useful for graphics of the nature shown below. Ultimately, for operational use, there would probably need to be some work done to ensure they are not confusing to the user and aesthetically pleasing.

Graphical NowCasts for our websites and social media

Graphic for IDSS Event
A Case for the Sharpened GLM FED Color Scale Used this Week
Over the course of satellite product interrogation this week, the GLM FED stood out as one of the most useful products. Below are examples from in/near the BUF CWA at 2043z and 2047z. Note that the top of the color scale was set to 128 flashes/5 min over the grid point vs. the default 256 flashes/5 min in AWIPS. The FED also paired well with the MFA and TOE on this 4-pane procedure.

The color curve used this week really popped and correlated well with frequent ENTLN detections. Another example below from shortly after 6 PM EDT (2202 and 2207z) shows that there will be instances where perhaps an even small color bar range would be useful.
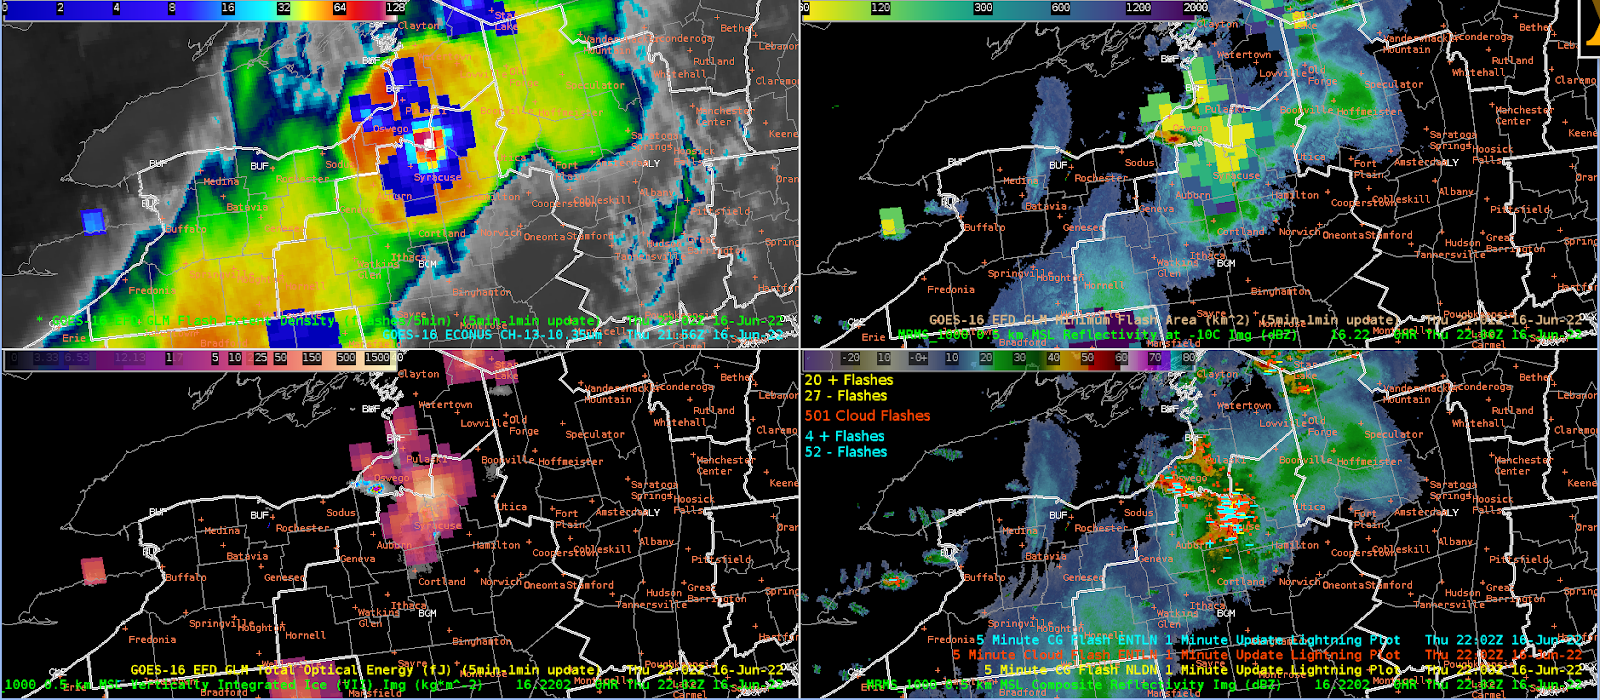

While the strongest storm at this time still showed up well on the AWIPS default color bar range, the 128 flashes/5 min top end of the range (top right) helped it pop even more and corresponded well conceptually with the ENTLN cloud flash detections. Furthermore, the thunderstorms to the north of the strongest thunderstorm showed up better from an SA perspective, if you have been focusing on the strongest storm for warning ops. The smallest color bar range on the bottom left further enhances the above described effect.
Addendum: GLM Flashes and a more smoothed FED
The excellent COD NexLab Satellite and Radar page added within the past year the GLM flash centroids to their GOES derived overlays. From an apples to apples perspective with respect to the ground based lightning detection network displays, this may be a useful product to add into AWIPS.
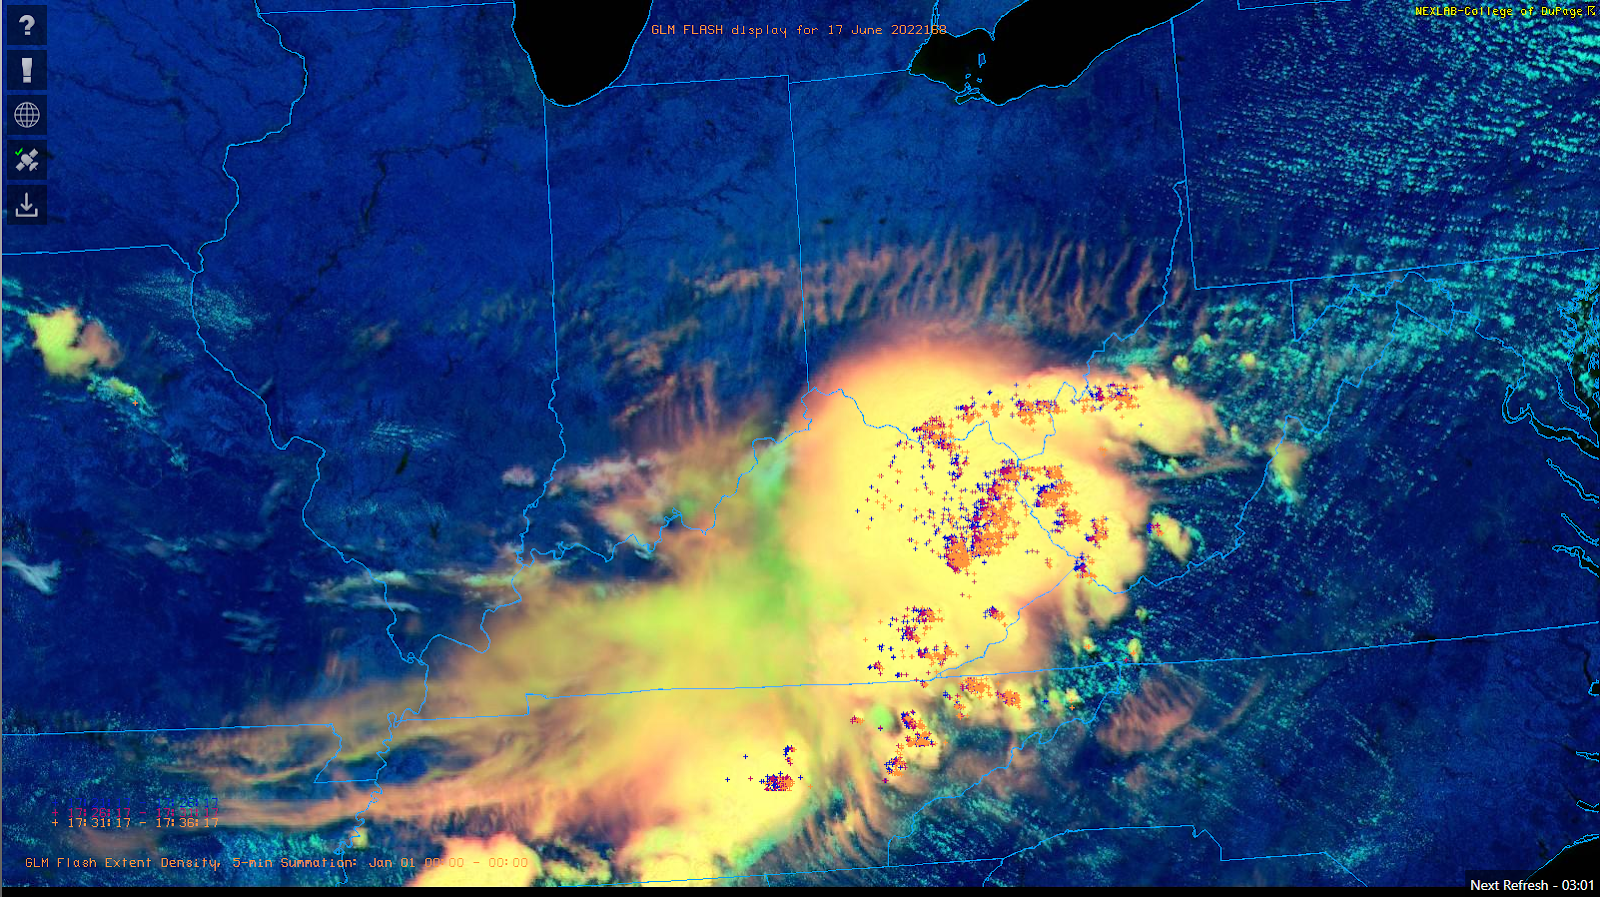 \
\Addendum 2: Would a more smoothed FED be preferable?
Below are a few web based examples of FED displays.

A case can be made that these smoothed FED examples would be somewhat less obtrusive than the default AWIPS FED display, especially for storm scale interrogation by the warning operator or storm scale mesoanalyst.
– Hurricane84
GLM & Prob Severe in Low Radar Coverage
With the Buffalo CWA being a long and narrow forecast area, there are areas where the Buffalo Radar doesn’t provide good coverage. On a day like today where their second radar (KTYX) isn’t providing any data, the entire eastern half of the CWA has the Buffalo radar hitting storms at 20 kft or higher. This meant that we had to more heavily rely on Satellite data for warning operations.
Looking at the northeast corner of the CWA we had convection popping for a few hours along a frontal boundary. Being able to look at spikes in the GLM over time and Prob Severe time scales and just instances in the Prob Severe were very helpful with determining what was going on in the lower levels that weren’t visible on radar. As one storm over the lake begins to move inland there is a jump in the GLM and Prob Severe.
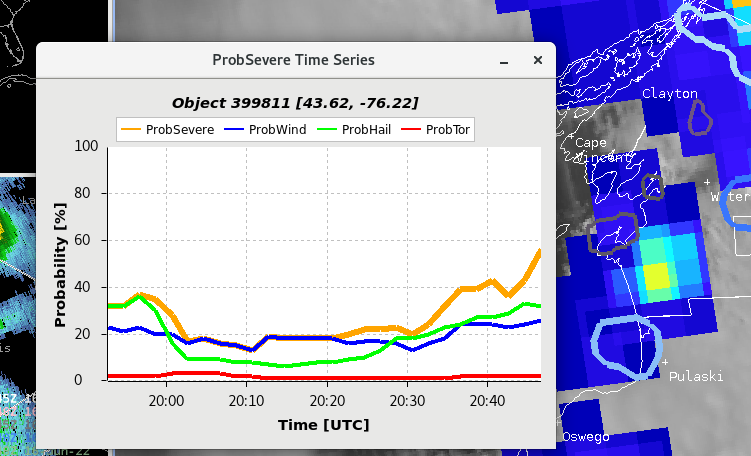
Being able to see the upward trends in time with the prob severe over time and then the increasing GLM was a big confidence boost to put out a warning.
-Cirrus Fields