
With a busy day still underway across Wisconsin, the use of the Optical Flow Winds, GLM, Prob Severe, and NUCAPS soundings were a big help in looking at the pre-convective storm environment and in warning operations.
When it came to looking at sounding data we had a NOAA-20, and AQUA pass for the polar orbiting satellites, that we could then compare to the special observed sounding from GRB.
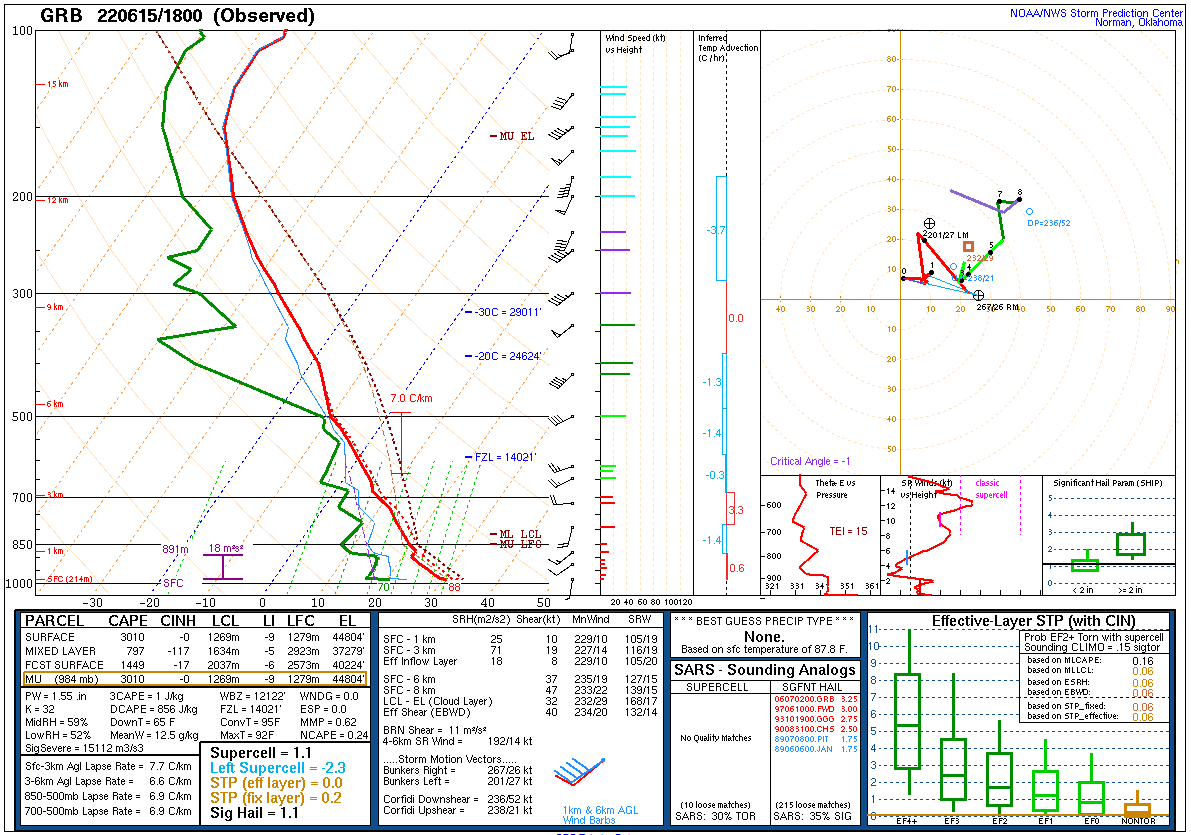
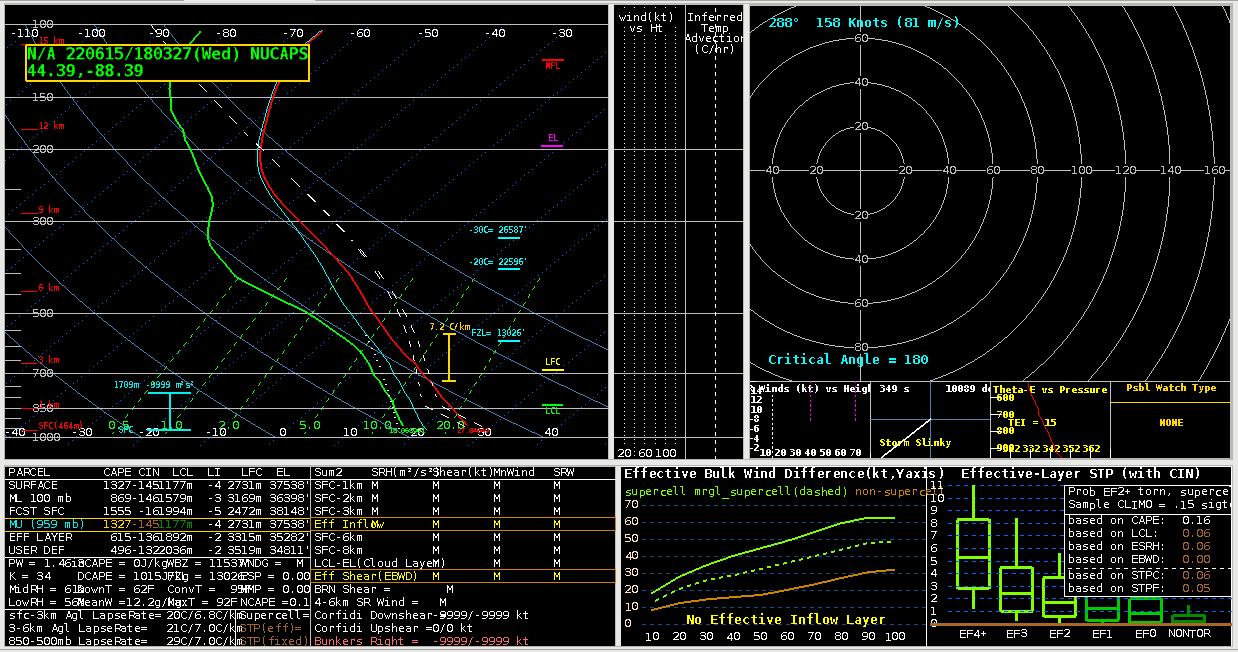
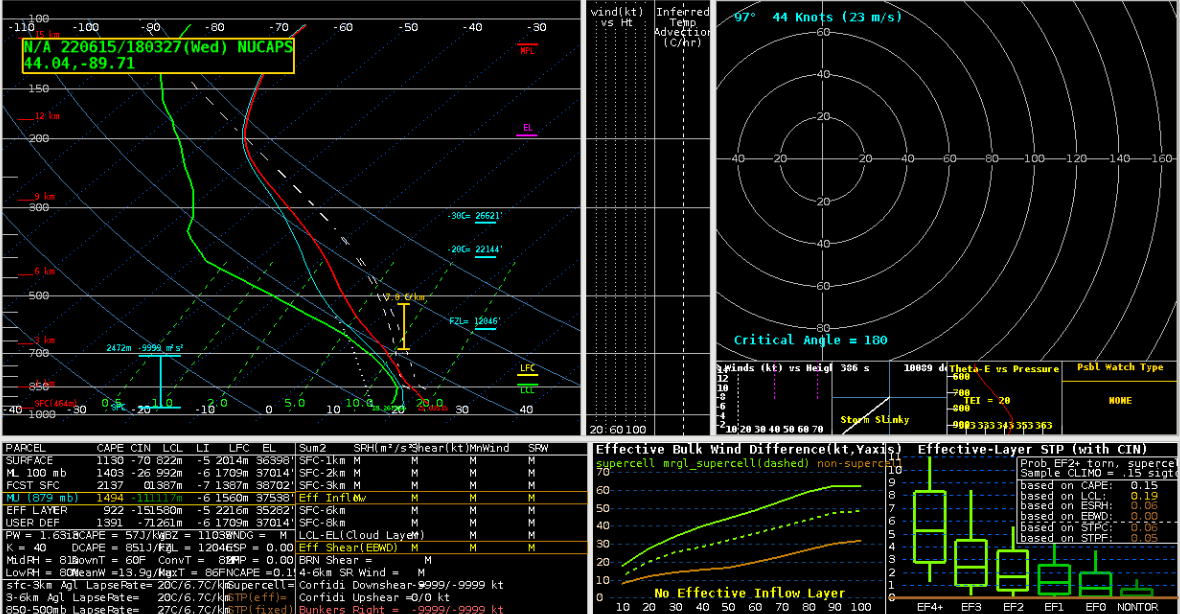
There are some spatial differences in the locations since each satellite doesn’t pass over the exact location and the observed sounding came from the GRB office. I ended up grabbing NUCAPS soundings from west of the office where I thought the better storm environment would be. Regardless of this they do show great information over a temporal and spatial scale.
Just between Aqua (bottom image) and NOAA-20 (middle image) you can see that the environment becomes much more moist over time (AQUA came around 19Z and NOAA-20 came around 18Z). The increase in temperatures and dew points in the low levels between the two NUCAPS soundings show that there was increasing low level lapse rates and increasing CAPE through time. Then compare both of these to the special sounding sent out by GRB, you can see AQUAs vast improvement in the low level over NOAA-20. The one caveat seems to be the smoothing of the values in the mid levels. Smoothing seems to have decreased the values almost too much for both satellite soundings. It is fairly within reason given that there is a dry layer in the mid levels on the observed, but the smoothing looks to have slightly overdone it.
Moving on to the GLM, it was very helpful when boosting confidence in the warning operations. There were lightning spikes collocated with increasing rotation and reflectivity. The one things worth mentioning is to have a reminder or maybe even have offices lower/change the color curves for FED prior to the start of an event. It could even be a permanent change that some offices make.
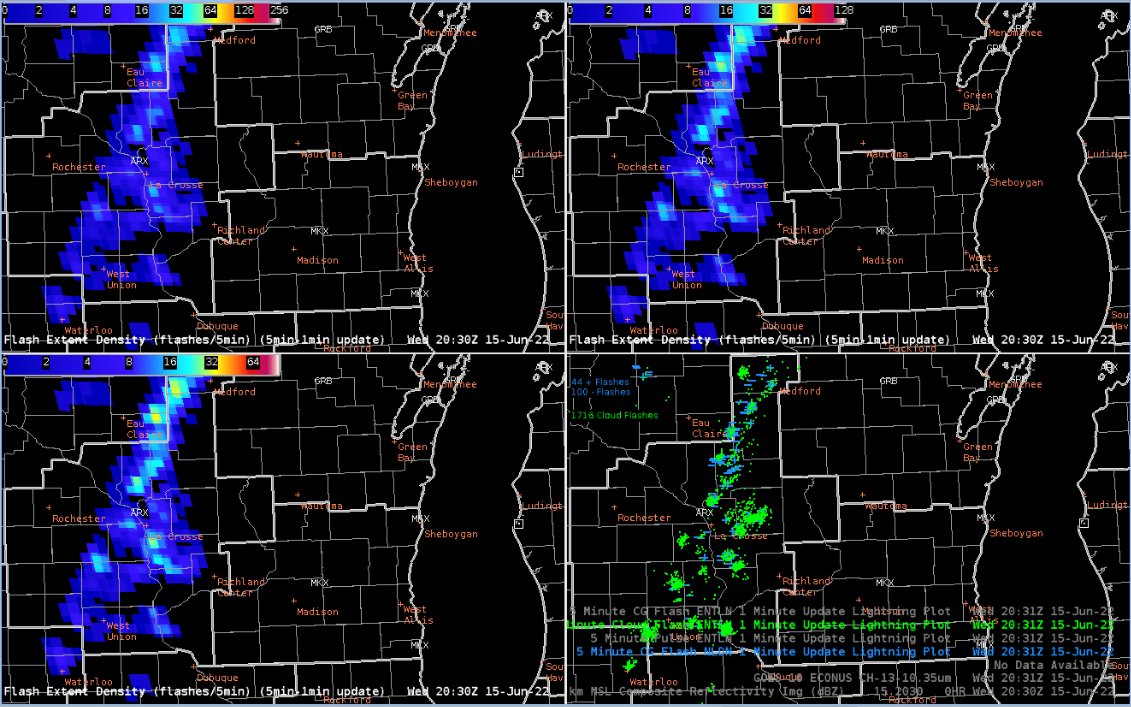
Since I was the only one in the group to check, compare, and lower the FED color curve accordingly it was much easier to pick out lightning jumps. From the graphic above alone, 0-65 was much more informative than 0-128 or 0-260.
The last thing worth mentioning for the day was the Optical Flow Winds. While this was helpful in a warning environment to look at storm top divergence and speed of the winds at the tops of clouds, I was able to find another great use for it. In the pre convective environment I had pulled up the Optical Flow Winds and noticed that it was tracking winds and speeds of clouds over Lake Michigan. In an area where any wind information and observation data can be very sparse to near non-existent. The optical flow winds could be very helpful for open waters forecasting.
-Cirrus Fields