

Not in this event – but would be interesting to note the trends in Inst AzShear for Sig Hail producing storms – e.g. mid-level mesocyclones.
Category: AzShear
KMXX – Inst AzShear
Using a combination of Z, Zdr, inst AzShear from KMXX – can see development of low level mesocyclone quicker than V/SRM alone. Can see the “white” > 0.01 s1 show up as early as 2000 UTC on the main TOR- while Z/SRM shows mainly a convergent signature.
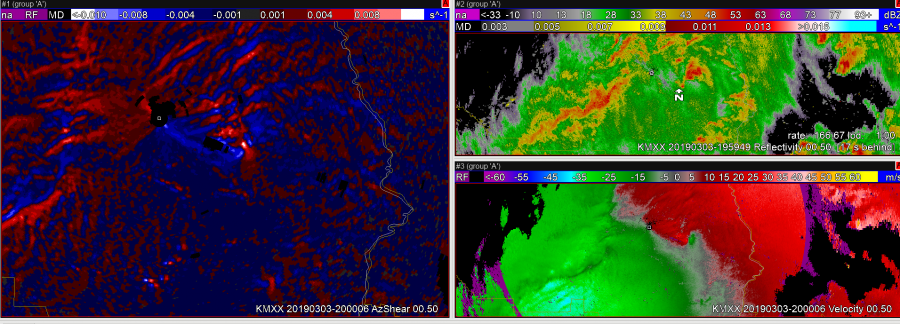
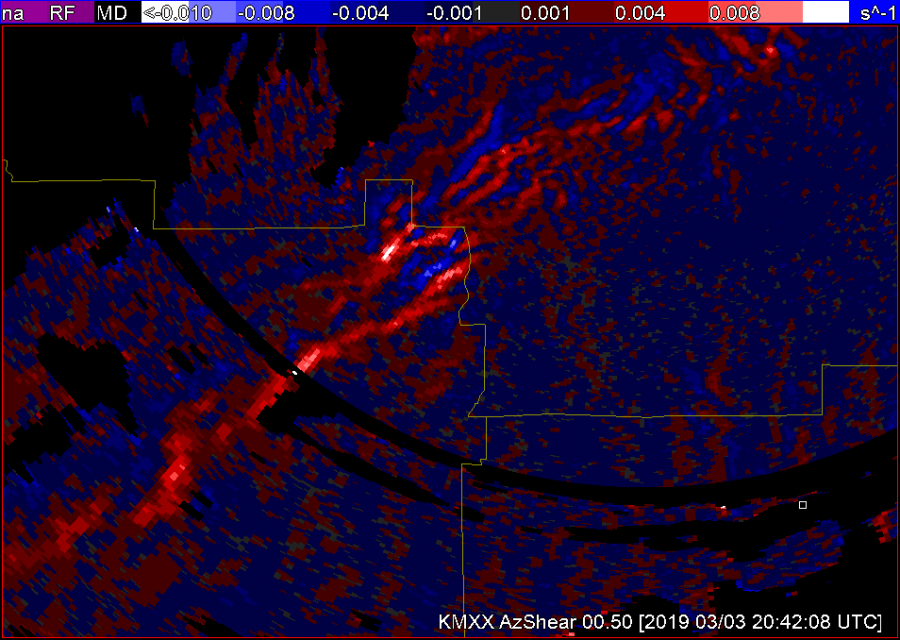
Looking down the convective line – south of KMXX – examining the Azshear around 2040 UTC. Area near the county border does trigger above 0.01 – whereas areas further south are slightly weaker (see image). Would be interesting to know which of these produced tornadoes. Reminder – plotting the tracks would be great!
AzShear Case Assessment
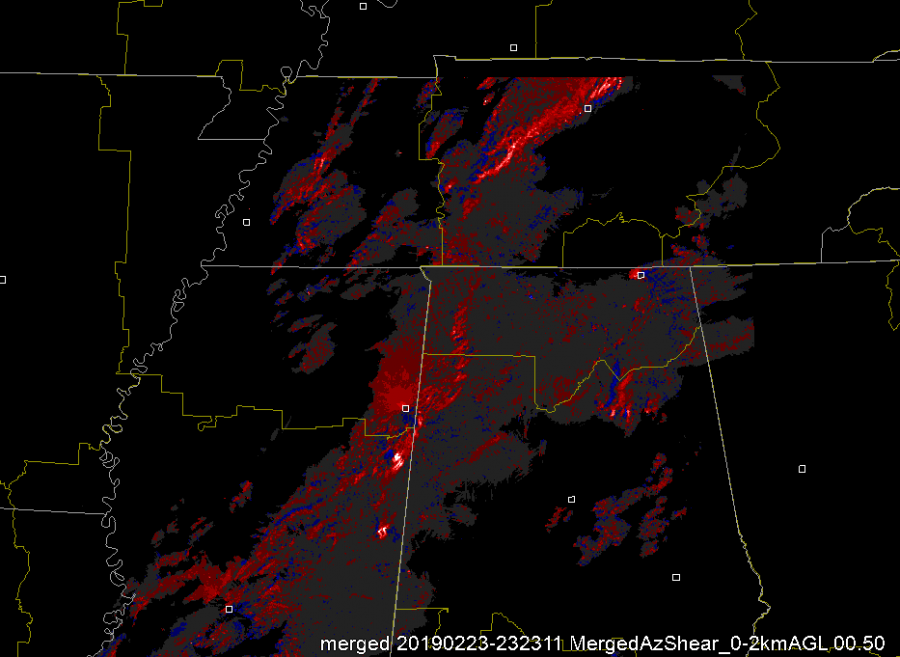
First time looking at these products (Single Radar AzShear, Merged AzShear 0-2km, and Merged AzShear 3-6km) and I’m already liking how quick it is to pull my eyes to areas I should be paying close attention to. The most obvious feature is the circulation well to the SW of the radar site (close to 115km out), but what I find to be even more useful is watching mid-level rotation tighten into a low-level circulation closer to the radar site (around 51km away). In the first screen capture below, the Single Radar AzShear product highlighted the RFD bulging out, which is very useful in being able to fully diagnose the developing case. In an operational setting, having the full suite of AzShear products available to supplement traditional radar products could raise confidence when making a warning decision. Both of the merged products increase my confidence in the vertical depth of the circulation, but is also useful when diagnosing shallow circulations, at least in this one case I’ve been looking at. I’ll be interested to see how these products perform in other cases, particularly ones that involve the more shallow QLCS TOR-scenario.
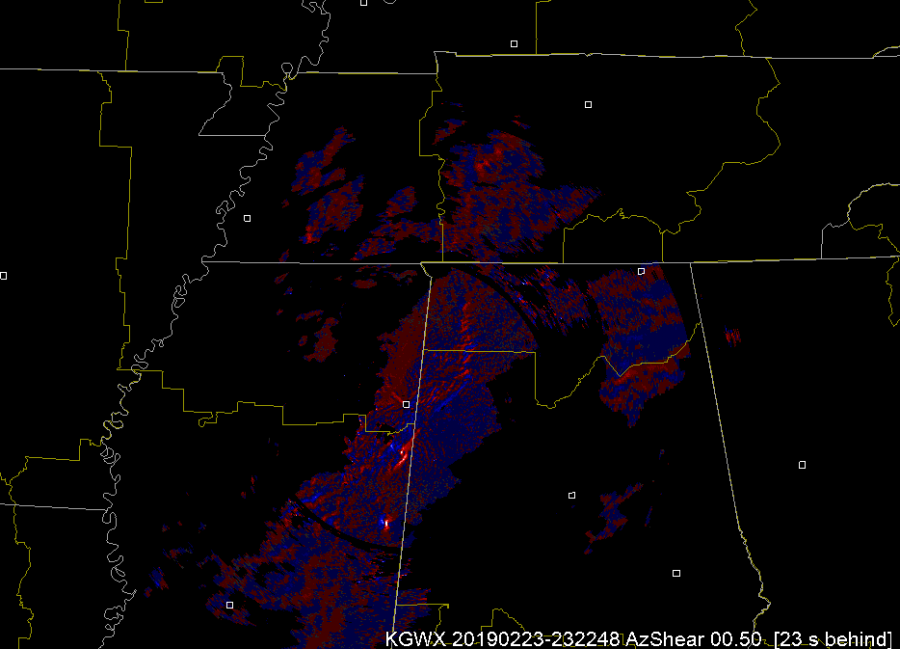
All that said, I will say that there are enough false positives appearing in the AzShear product suite, particularly the Single Radar one, that caution should be taken if using solo, without reference to the traditional radar products. In an even more active scenario, I could potentially see false positives taking the warning forecaster’s attention away from features that need closer attention.
~Gritty
Storm Structure More Evident with AzShear
The AzShear products seem to accentuate features such as the RFD which could allow for a better assessment of RFD strength and the potential for new tornado genesis in cycling supercells.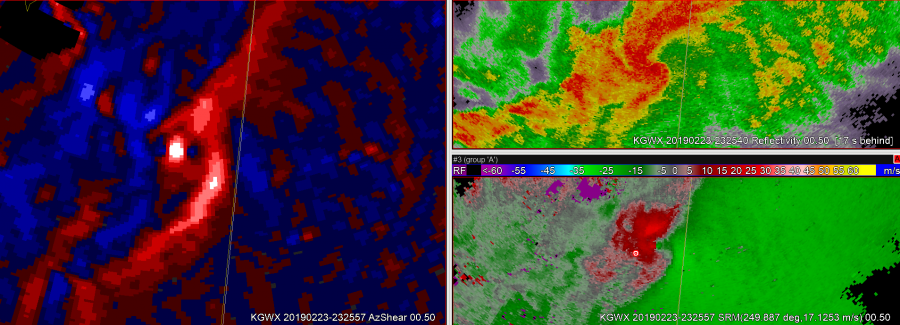
In this specific example the initial tornado weakens or dissipates, and when faced with a decision whether to continue or re-issue a warning, the enhanced RFD signature would have prompted me to continue the warning. Sure enough, several scans later a new circulation developed that would have prompted a new tornado warning on its own.
— FLGatorDon
AzShear and the Leading Edge
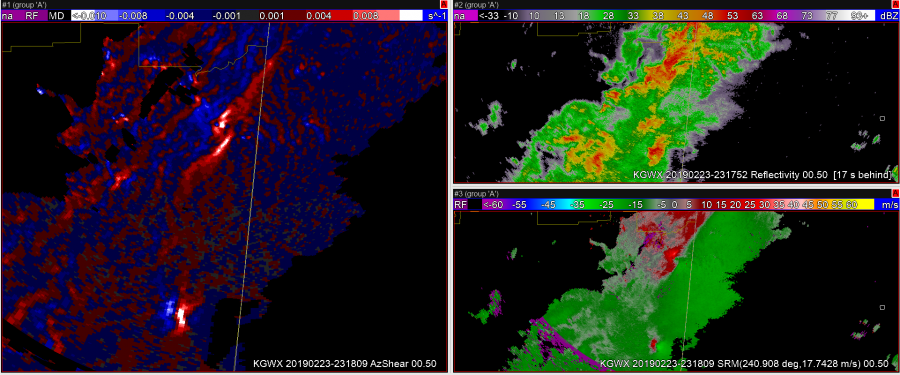
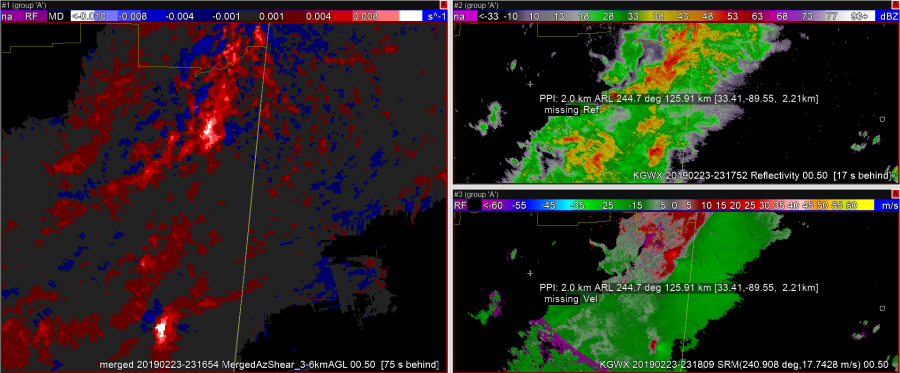
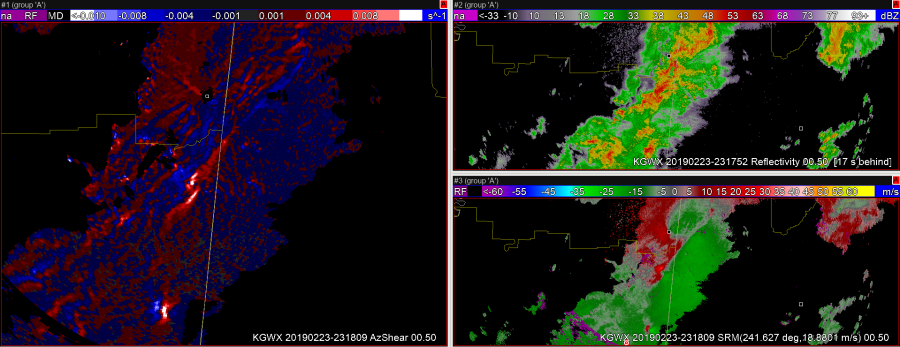
Spectrum Width is (I feel) a seldom used and/or misunderstood product, but one of the uses of it is to view the leading edge of a gust front with messy reflectivity. I think the Az Shear product, especially the single radar version, adds an additional layer to this boundary identification. A forecaster would need to be aware where the radar is with respect to the leading edge as the Az Shear flips whether you are north or south of the radar, but putting the Velocity, SW, and Az Shear together makes that leading edge ID easy. This is important when doing DSS for events for example, identifying and timing out right where the leading edge winds begin. Below are two screenshots one with AzShear, Reflectivity, and SW, and another with AzShear, SW, and Velocity. You can see where the leading edge is in the most norther part of the line in reflectivity (tight gradient that lines up well with SW). In the middle of the reflectivity though it gets messy. While details of the leading edge are still visible in SW, they stand out well in the AzShear, including where a kink the line and a new circulation is developing.
You can see this leading edge of the line in Storm Relative velocity as well (see above). Whether it is for tornadic circulation identification (which SW can also play a role in – high values of Spectrum Width = high turbulence like you’d see around a tight couplet) or for identification of the leading edge of the winds I think a 4 Panel of Reflectivity, Spectrum Width, Velocity, and Single Radar AzShear would be useful and valuable.
-Alexander T.
Single vs Merged AzShear as SAD Tool
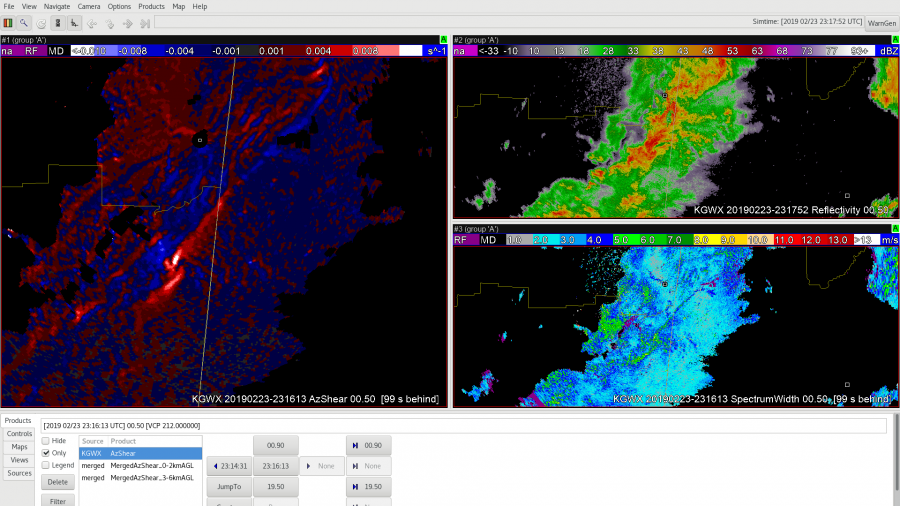
In a zoomed out view the AzShear products can draw your attention to small gate-to-gate signatures in velocity data that would be harder to see without zooming in. In the image below it’s hard to see the gate-to-gate, but the AzShear product is standing out for the northernmost couplet.
Now reference the zoomed in velocity:
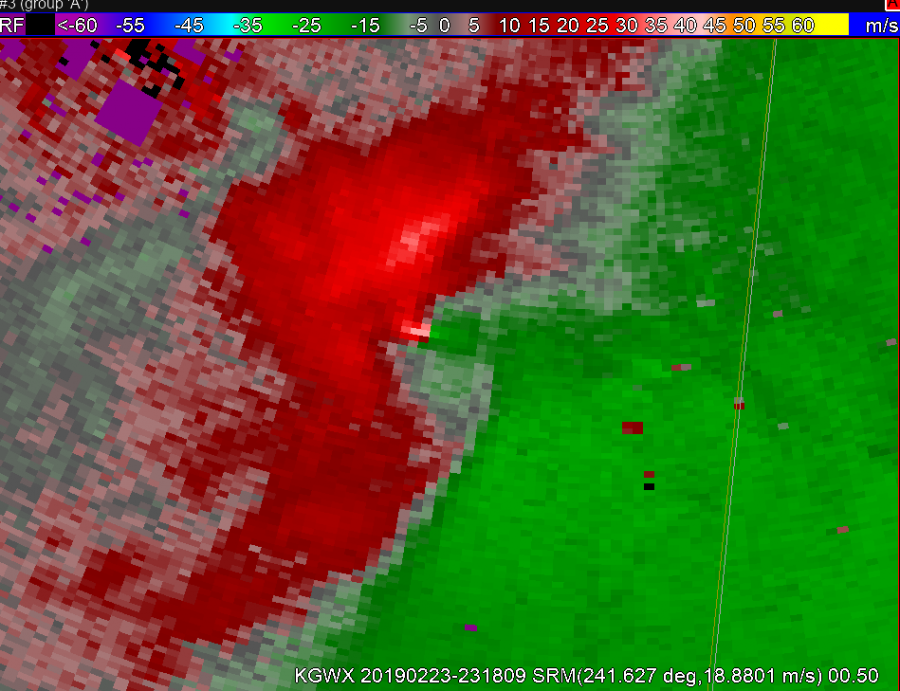
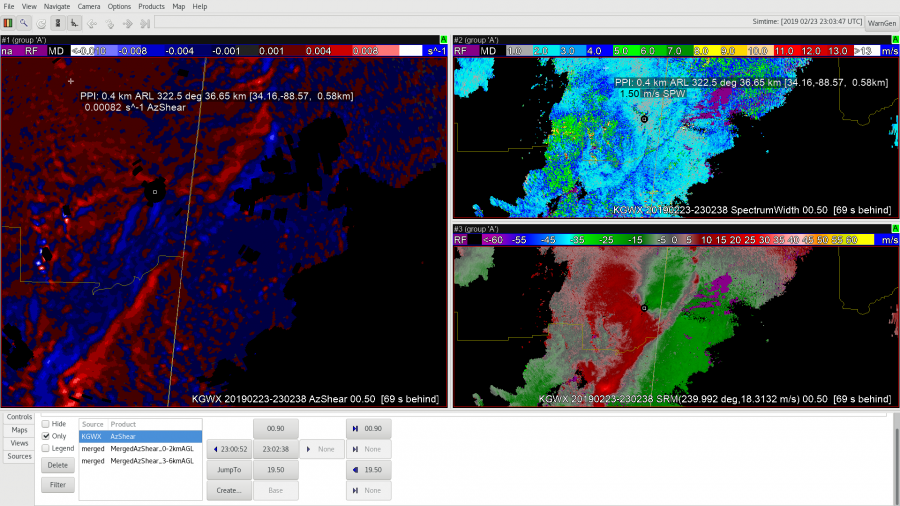
Additionally, the MergedAzShear products can alert you to couplets that are occurring at low-levels nearer to other radars than are currently being viewed. For example, in CWAs with multiple radars and with limited screen real-estate due to performance and monitor limitations, it is impossible to view all radars at once. Thus you find yourself switching tabs a lot. Utilizing the MergedAzShear can tell you when you need to look at a different radar and which radar you need to look at so you can triage a storm as fast as possible. See merged product:
vs. a single RDA AzShear product:
And note the detail you can see in northern AL and western TN. After addressing the storms in eastern MS, I know I need to switch and look at nrn AL.
— FLGatorDon
Single Radar AzShear Showing FFD and RFD?
Single radar AzShear appears to do a nice job of highlighting the FFD and especially the RFD right before and during what looks like a fairly significant tornado.
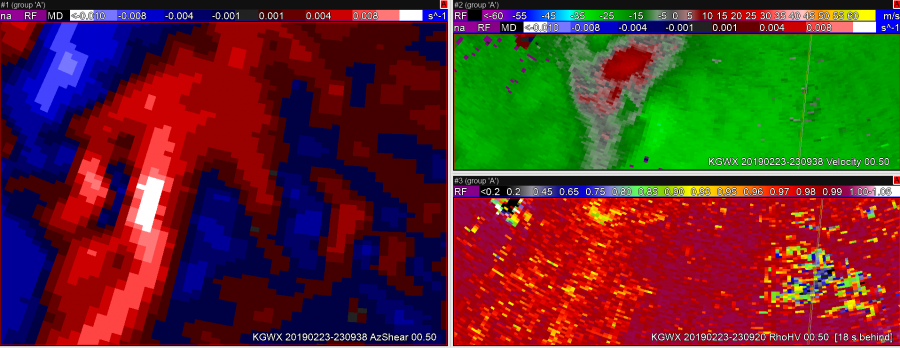 In this first image, the updraft-downdraft convergence zone appears to be a continuous line in AzShear.
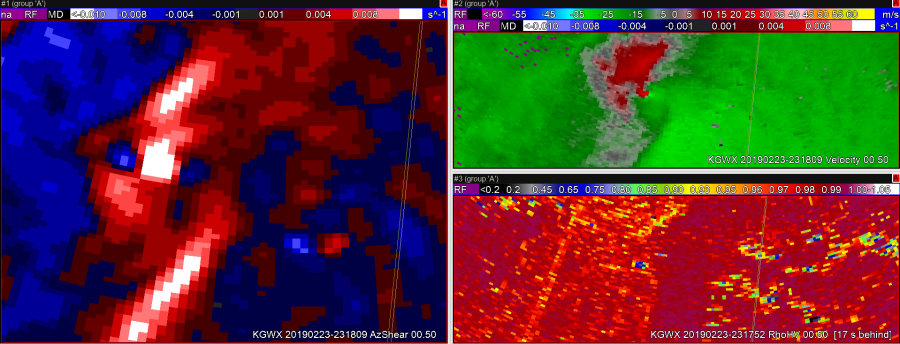 In the second image, you can see the RFD kicking out ahead of the storm right as the velocity couplet intensifies and a TDS appears.
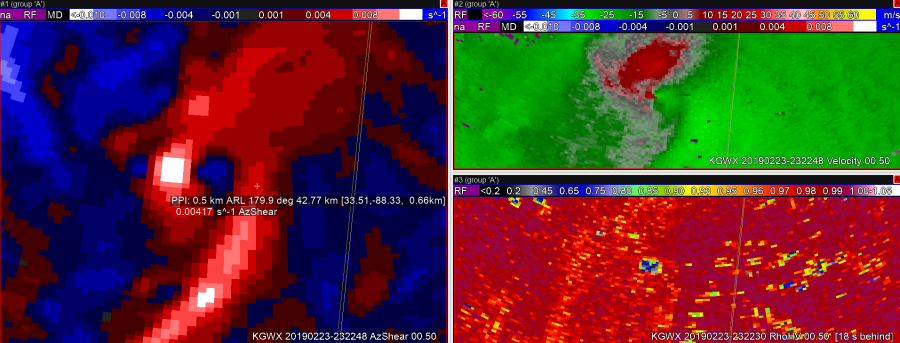 In image 3, it looks like the RFD has pushed well ahead of the tornado, perhaps hinting that the tornado may soon dissipate.
 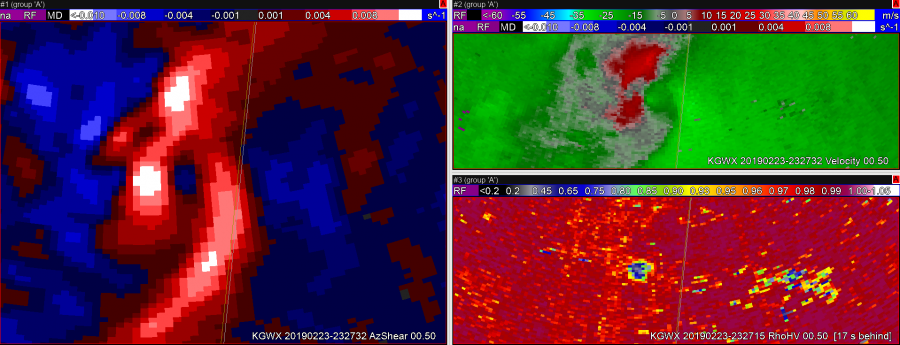 The TDS lingers in this image, but the velocity couplet has weakened.
 Still have a TDS, but velocity couplet has become very weak.
Sandor Clegane
Single Radar AzShear
Cellular vs Linear capabilities: Analysis of 20190223
A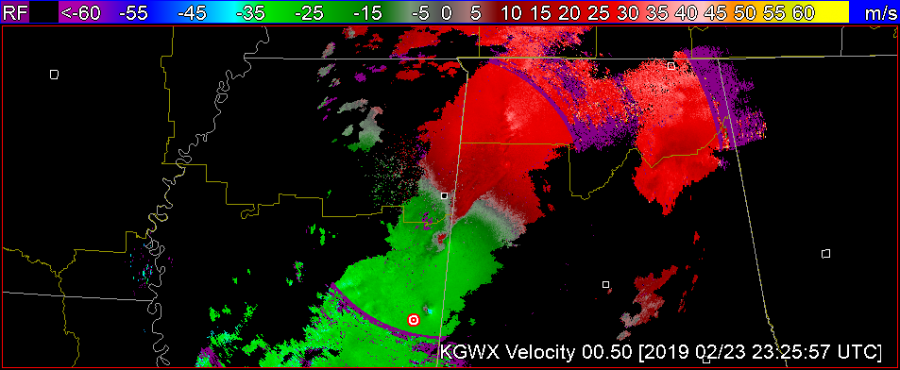 B
B 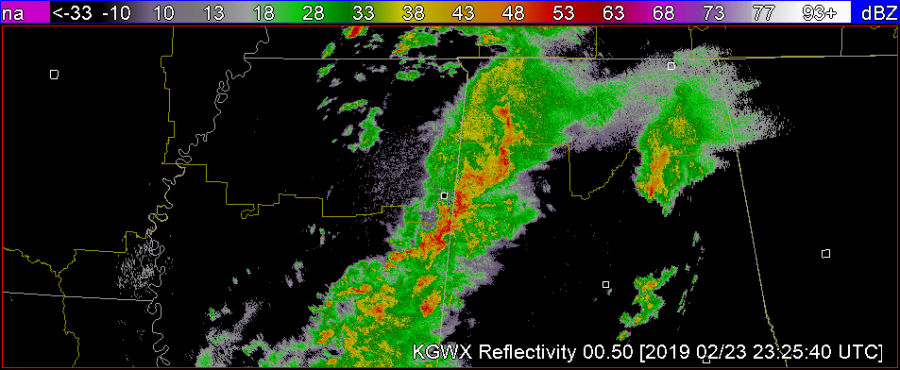 C
C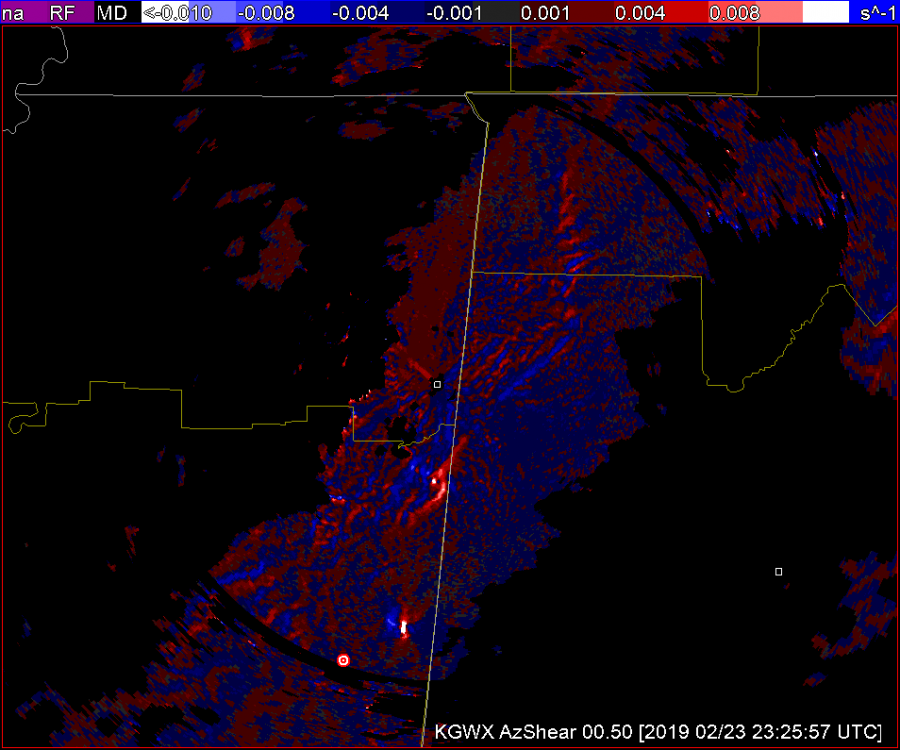
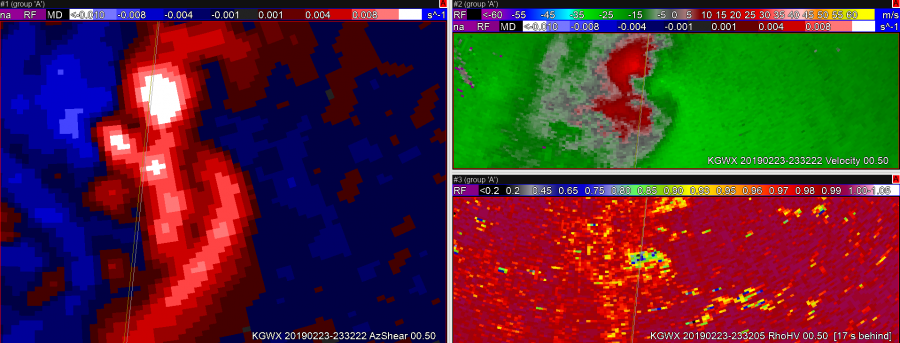
AzShear draws the eye very nicely to cellular areas of concern. That, compared to the velocity pictured above in A narrows your attention to the two couplets located in the southern portion of the picture. The issue I see here is the AzShear pictured in C provides a bright spot in the couplet second from the bottom that catches my attention but also lends a broadness to the picture that is a little more difficult to read than the Velocity picture in A. (TDS embedded within.) This may be due to the color table. In totality it’s helpful to rely on the velocity picture that has gradient smoothing to make it more clear what you’re looking at.
-lakeeffect
Single Radar AzShear
The GOOD
1) can make detection of the updraft/downdraft convergence zone (UDCZ) quite clear. By overlaying things like 0-3km shear, could use this to highlight areas of mesovort development.
2) Storms with strongest rotation “pop”. I would use this in my typical volumetric interpretation – likely into a 6 or 9pnl display with other base and dual pol variables. Could also compare to the integrated 0-2km rotation tracks.
The NOT SO GOOD
- Not surprising, the single radar azshear data can be “noisy” – but most of this is in areas that you would not be as concerned about – e.g. well behind the leading line. But forecasters will need to adjust.
- Forecasters will need to “calibrate” values. Exactly what does 0.008 s-1 mean? How does this change by range? What about by tilt?
- Is the color scale idea? Features appear to stand out – but could others be developed to highlight things even better.
 6
6
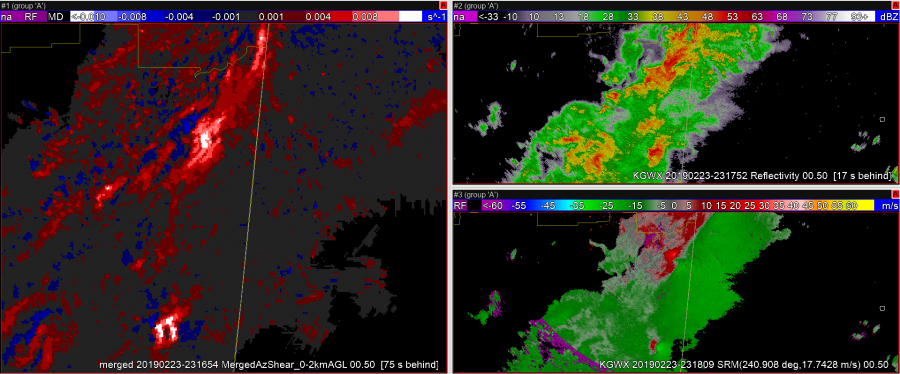
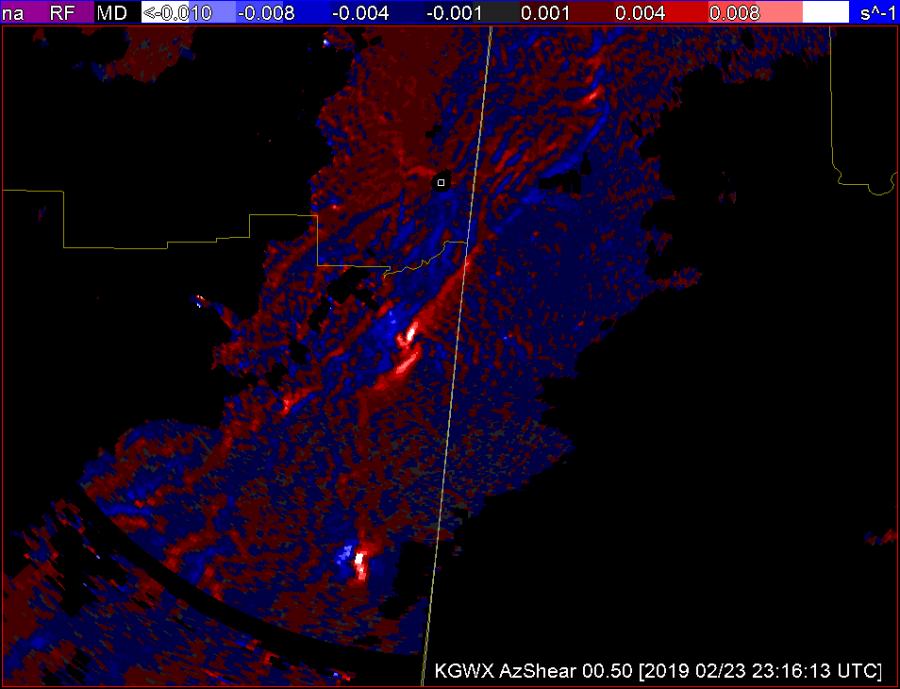
Single Radar AzShear Highlighting Areas For MesoVort Genesis
With a 0-3km shear vector roughly SSW to NNE at 37kts (per 18z JAN sounding), I would expect to see mesovortex genesis along portions of the updraft-downdraft convergence zone oriented roughly E to W. There are 2 such portions along this QLCS, and the single radar AzShear does a nice job of highlighting these areas.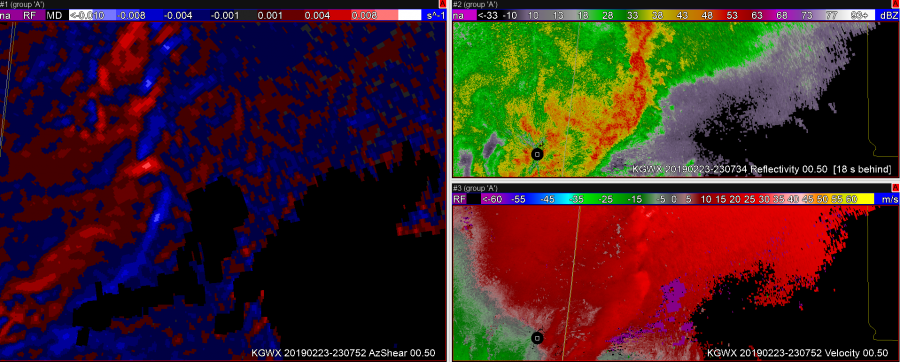
Sandor Clegane