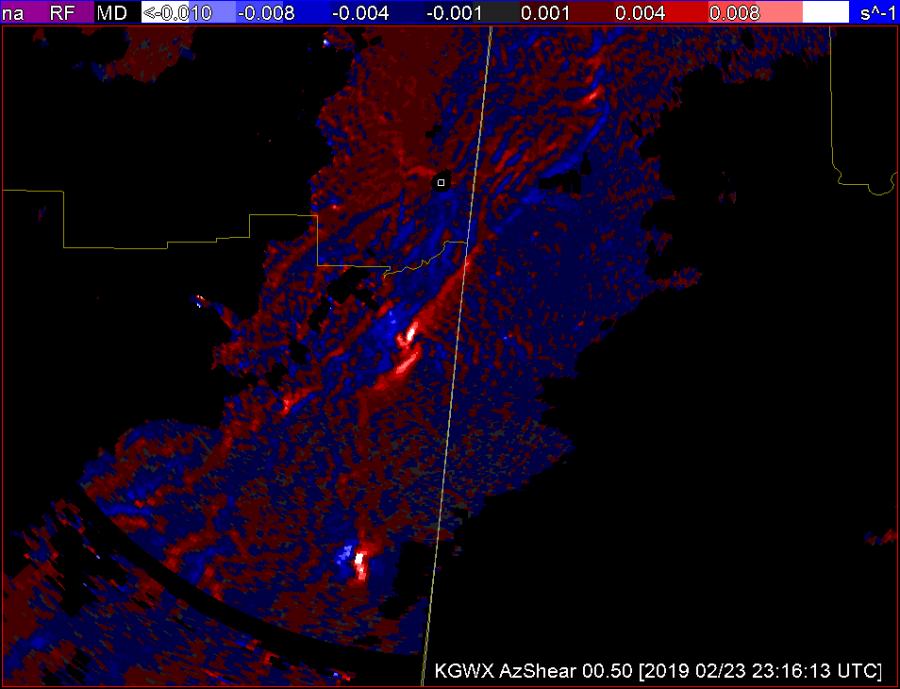
The GOOD
1) can make detection of the updraft/downdraft convergence zone (UDCZ) quite clear. By overlaying things like 0-3km shear, could use this to highlight areas of mesovort development.
2) Storms with strongest rotation “pop”. I would use this in my typical volumetric interpretation – likely into a 6 or 9pnl display with other base and dual pol variables. Could also compare to the integrated 0-2km rotation tracks.
The NOT SO GOOD
- Not surprising, the single radar azshear data can be “noisy” – but most of this is in areas that you would not be as concerned about – e.g. well behind the leading line. But forecasters will need to adjust.
- Forecasters will need to “calibrate” values. Exactly what does 0.008 s-1 mean? How does this change by range? What about by tilt?
- Is the color scale idea? Features appear to stand out – but could others be developed to highlight things even better.
 6
6
