Warning vs DSS – “WFO DMX”

It was interesting when comparing the Warning side of the house today versus the DSS side. When we (Cumulus and Kadic) were discussing this and picked two of the tools we used the most, there were similarities and differences:

For Warning Ops: OCTANE and LightningCast

OCTANE proved very useful in interrogating convection. LightningCast was also a helpful diagnostic tool in highlighting the potential for and track of intense convection when used with ProbSevere.

OCTANE:

Here’s a look at 2 particular instances from OCTANE:

A combination of cloud top cooling in OCTANE and subsequent divergence aloft was a helpful clue in assessing the potential of a storm that was distant from the radar. It was caught a little later in analysis, but OCTANE proved helpful in diagnosing the storm and deciding to pull the trigger.


This next instance was a warning that was issued solely using OCTANE and seeing how well it lined up with radar. The warning targeted the center of where the maximum storm top divergence was taking place, and then stretched down towards the south to account for parallax. The warning decision was made for the impressive cloud top cooling and pronounced divergence that appeared in the scans leading up to the warning. The panel on the top left shows the OCTANE speed, and it transitioned to a blue color leading up to the event.


LightningCast and Radar:

As the line shifted east into the area, ProbSevere stood out, while the LightningCast steadily increased. The left hand panel depicts GREMLIN, and it properly highlights the southernmost storm as being the most intense. Unfortunately, not every storm that we issued warnings for got a specific screenshot, but when looking at LightningCast, areas that were likely to experience 10 or more flashes with a 70% probability seemed to correspond well with ProbSevere values would support issuing warnings.

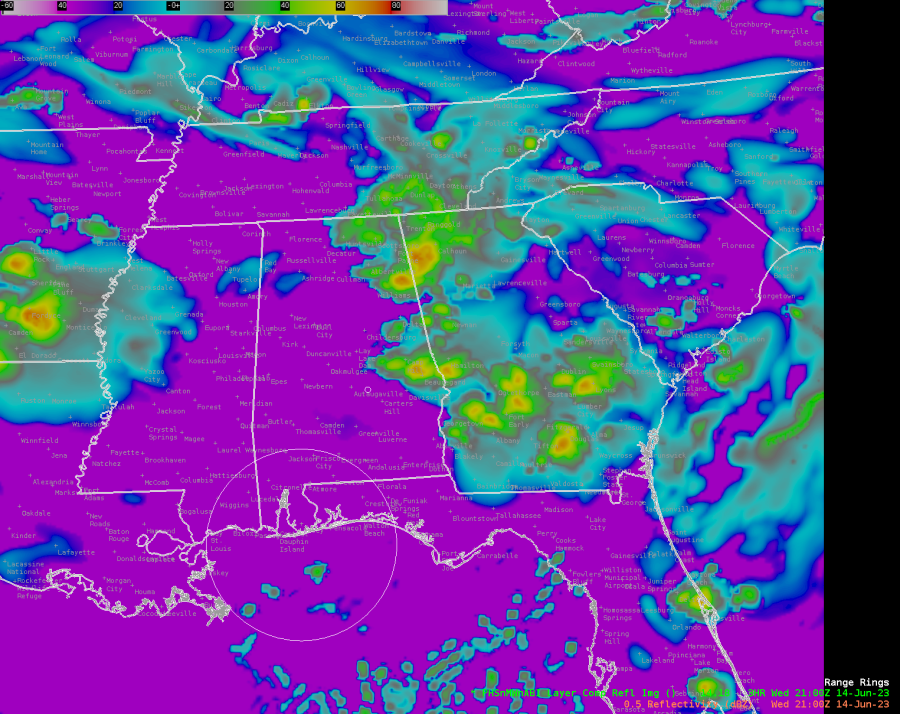
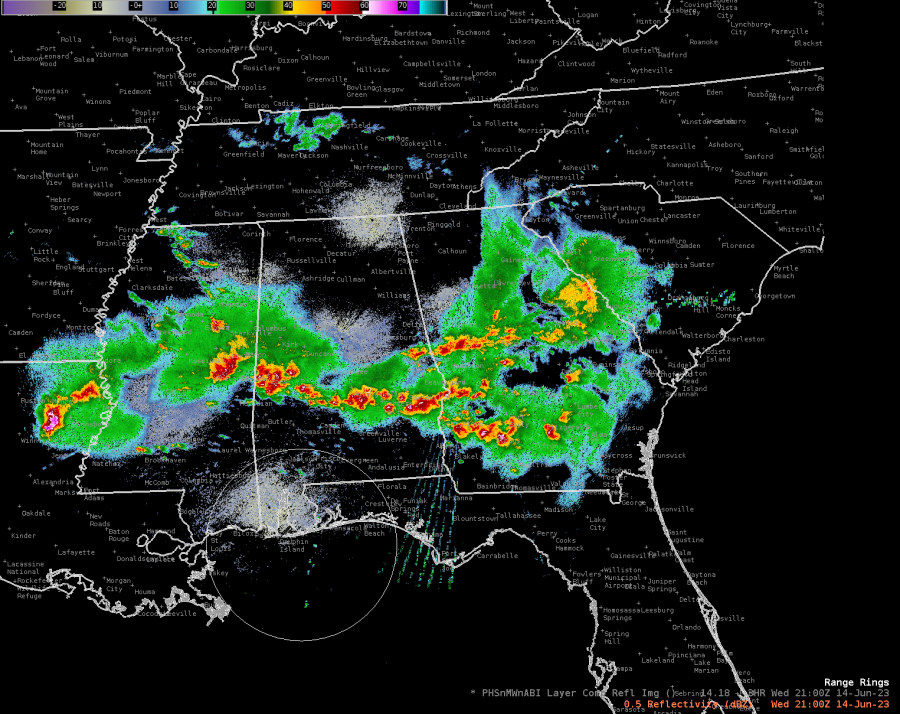
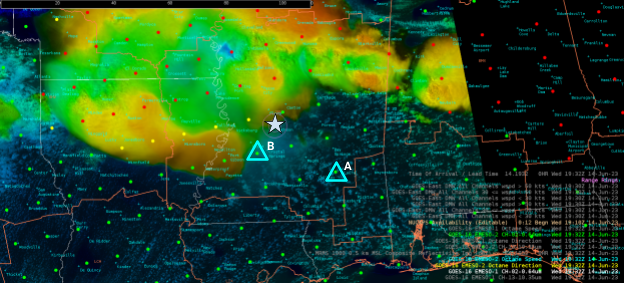
Below is the example of what MRMS looked like the moment DMXSVR005 was issued solely based on OCTANE. Much of the SVR encompassed the highest LightningCast values with a probability of 10 flashes of 70% in yellow and the various ProbSevere contours. Again, this highlights how useful these tools can be in performing storm interrogation. However, when thunderstorms are numerous, this may be a lot to run through. They are definitely useful tools in the tool belt, though.

For DSS: LightingCast (especially the Dashboard) and GREMLIN/GLM.

– LightingCast: I REALLY like the form and Dashboard. It helps focus on the DSS site specifically and organizes the data really well to where I would feel comfortable explaining/showing an EM the graph of   lightning probabilities. Honestly, I could bring this back to my home WFO right now and use this for DSS events this summer. A couple things that could be added to make it even more awesome: adding more options for ranges (right now there is only 10 miles, perhaps adding 15 and/or 20 miles). Folks could then choose which to display in the graph. The other thing (fairly minor), perhaps reversing the size of the bubbles for the GLM data (smaller range, smaller bubble). But, this is personal preference – maybe if this could be customized by the user like the colors?

– GREMLIN/GLM: GREMLIN followed the storms a lot better today (seems to do better with more intense storms versus run of the mill/sub-severe ones). I used a two panel display with GREMLIN on the left and MRMS on the right with GLM and LightningCast and compared the two. I used time of arrival for the storms to 10 miles outside the DSS event and also at the site itself. GREMLIN was able to keep up with MRMS really well! I am becoming more and more convinced that this could be a really great product to help if a radar goes down or there is a radar hole (in data).

Overall, it seems as though OCTANE was used more for warning ops versus DSS, but LightningCast was used by both the warning operator and DSS forecaster.

Forecasters Cumulus and Kadic

Tags: None

Using GREMLIN and LightningCast for Warning Ops and DSS

GREMLIN continues to perform well with regards to the overall picture of precipitation and convection. In fact, in the example below, GREMLIN seems to be catching on to the northern extent of the line breaking apart and the southern portion becoming more intense. However, it seems to be a bit slower than the MRMS data.

LightningCast could be more useful in this case if the thresholds were modified (25 flashes versus 10) to better identify and focus on the more intense convection.

LightningCast overlayed on GREMLIN emulated radar (left) and MRMS Composite Reflectivity (right)

Looking at the LightningCast dashboard for our DSS event, probabilities of lightning are increasing. I found that this is actually an easier way of being able to communicate lightning probabilities for a site (or a range around the site) versus using the map (seen above). This would allow me to let an EM or site official know that probability of lightning is near 80% for 10 miles form the site (within the next hour) and 50% at the site itself.


LightningCast Dashboard for Belin Quartet Summer Concert Series (Des Moines, IA)

We provided valuable support. A message was sent nearly 45 minutes ahead of time following the issuance of a Severe Thunderstorm Warning to the west.

If our partners are simply looking to delay, LightningCast may also prove helpful in giving the all clear if you don’t see anything upstream on radar. The values react well as convection clears the site. This is also great in helping you know for sure when the last lightning flash took place, and it can help us give better information.


Forecasters Cumulus and Kadic

Tags: None

LightningCast and DSS

Viewing CI and LightningCast (LC). LC probabilities on the SW portion of the storm (in the center) at 1958Z ranged between 70-75%. Just before GLM signatures pop up at 2007Z, LC probabilities jump up to around 82%. Not included in the animation, but at 1951Z, LC probabilities were around 50%. The overall trend upward would give me confidence that I can use this product to tell an emergency manager the potential for lightning is medium to high within the next 10-20 minutes (using this case, hypothetically starting at 1951Z).

Lightning Cast product overlaid on Cloud Phase Distinction on the left and radar reflectivity on the right. 20 May 2024

Forecaster Cumulus

Tags: None

Columbia SC: Trucks with Food

Protecting the Foodies

A Severe Thunderstorm watch that covered most of Columbia’s CWA was where we concentrated our forecasting efforts today. We found ourselves with no radar and were forced to make decisions on warnings with satellite only. As a result we made some modifications and combined the power of GREMLIN and OCTANE. Here’s what that love child looks like:


One of the issues we had in making decisions based on GREMLIN data was the lack of information it provided. GREMLIN provides a radar emulation and given that it’s a satellite based product it would be nice to see more information in the sample tool of what’s being shown. Values like temperature at highest reflectivity and echotops could be inferred by GREMLIN to help forecasters make better decisions if radar wasn’t available. The other issue we had with GREMLIN was the latency. Products were running anywhere from 15-20 minutes behind the rest of the satellite products that we were using.

A few minutes later we issued our first SVR warning for the eastern edge of CAE CWA for winds over 60MPH and nickle sized hail (sub severe).


As our storm moved out of the CWA we allowed the SVR to expire and took a look at the PHS Forecast model and compared it to the HRRR to prepare for the next round of thunderstorms. But both models seemed to agree that more TSRA was unlikely:


Storms in GSP came together and eventually created a good line of thunderstorms from GREMLIN’s point of view. GREMLIN was picking up some areas of higher DBZ and a lightning jump through the line was consistent with what we’d expect to see on radar for a SVR. A warning was issued on a line of storms:


The line started to fall apart as soon as it hit the CWA border. We allowed the warning to expire without feeling the need to re-issue downstream. After that, storms no loner had access to some of the peak daytime heating that allowed them to become sub-severe during the afternoon.
-Charmander
Tags: None

LightningCast Good For A DSS Heads Up…Dashboard Needs Some Work

Storms off the the west in New Mexico approaching our DSS location in far NW Texas were a great way to test the LightningCast and the associated LightningCast Dashboard. Our DSS location was focused on the “Rita Fire” that was along Hwy 385 between Dalhart, TX and Boise City, OK and partners wanted notice of a 50% probability of lightning within one hour within a 25 nm radius around the fire. Convection was ongoing across NE New Mexico one storm showing deviant motion. This storm was warned on at 2043Z for 1.5″ hail and winds of 60 mph based primarily on radar; however, Octane was being used to monitor the storm as it tracked southeastwards towards the CWA boundary. Octane showed consistent divergent signatures in the direction product and good speed decreases on the upshear side of the updraft before being contaminated by an anvil from another storm to the southwest.


    As the supercell dropped southward from NE New Mexico, the LightningCast product probabilities started to increase into the Rita Fire range ring. It was noticed that the LightningCast Dashboard remained at around 10% despite 75% probabilities along the range ring boundary indicating that the dashboard is focused on a point. This is fine if you are only concerned about one point, but most outdoor events need time to evacuate people or move equipment from the location.


While it was nice that the LightningCast Dashboard allows you to choose different time ranges and an auto refresh rate per a drop-down, I think some other options might be more helpful for support of an event. To help provide a head’s up to partners, it would be valuable to have an option to input a specified area that you would like to be alerted for…with the option of inputting those criteria. For example, being able to have a range ring or being able to draw a polygon for the area of interest and then inputting lightning criteria in there to alert you when those values are reached within your range ring or polygon. The criteria provided for the Rita Fire of 50% probability within the range ring would have alerted us on the Dashboard that the threshold had been reached. As far as the LightningCast product overall…it was an excellent resource for monitoring then alerting the Rita Fire partners once their criteria had been reached. A quick screen grab can be sent to partners as well to indicate where the greatest lightning threat probabilities are located.


– Vera Mae

Tags: None

Utility of Parallax Corrected LightningCast Versus Non-Corrected within DDC

June 15, 2023 – Role playing as DDC, I was tasked with providing DSS for a (fictitious) grass fire near Meade, KS.

DSS: Grass fire near Meade, KS

For this DSS, requested information included lightning within 10 miles of the site, any significant changes in wind speed and direction, as well as other hazardous weather that would pose a risk to emergency personnel containing the fire.

Figure 1.

There was ongoing severe convection within the western half of the CWA by the start of my shift, and there was a high likelihood of this convection approaching the DSS site. As shown in Figure 1,  my datasets/tools of choice for tracking severe convection and lightning were as follows: GOES-East Mesosector LightningCast, MRMS Composite Reflectivity, ENTLN intracloud and cloud to ground lightning, surface observations, Time of Arrival Tool, Distance Bearing Tool, and Range Rings Tool.

Ground based lightning observations and LightningCast complimented each other nicely when assessing the potential for lightning at the site. Additionally, LightningCast picked up on additional agitated Cu well ahead of the main line of thunderstorms closer to the DSS Site. Using the Time of Arrival tool to track the main cluster of cloud to ground lightning associated with the severe convection was also very useful in providing information on potential to see most lightning via advection, in the absence of additional convective initiation and/or a rapid change in forward speed in ongoing convection.

Figure 2.

Some consideration was made to not “overwarn” on lightning potential as the main breadth of lightning would likely come from the severe convection still well off to the west. So with this particular scenario, I set an internal threshold of 80% within LightningCast to send a DSS message. The data readout of the parallax corrected LightningCast offered within AWIPS (not shown) was favored over the non-parallax corrected time series (Figure 2), giving higher confidence in the true probability of occurrence used within the DSS message. This gave around a 35 minute lead time before the first strike was detected within 10 miles of the DSS site. Had we used the non-parallax corrected readout values, lead time would have been much shorter, around 10 minutes using 1-minute imagery and less than 10 minutes using 5-minute imagery. This clearly demonstrates the value of using parallax corrected data compared to non-parallax corrected data when performing DSS.

Here was the DSS message sent at around 21:10 UTC:

Severe thunderstorms have developed around 50 miles to your west, and will likely move over your site between 5:15 pm to 6:30 pm CDT. There is a high chance for storms to remain severe by the time they reach your site, bringing very strong winds over 70 mph out of a direction ranging between northerly to westerly, large hail, heavy rainfall, frequent lightning. We still cannot rule out the potential for a brief tornado, although the chance for a tornado is much lower than previous hazards mentioned. Because of the approaching thunderstorms, the chance for lightning to occur within 10 miles of your site within the next hour (5:15 pm CDT) is over 80%.

– 0SMBLSN

Tags: None

Low Probabilities of LightningCast Despite Observed Cloud to Ground Lightning Within Trailing Anvil / Stratiform Region

While providing (fictitious) DSS for a grass fire near Meade, KS on June 15, 2023, LightningCast was utilized in notifying the onset of lightning within 10 miles of the DSS site as a line of severe thunderstorms approached. Additionally, consideration was given to the potential for lightning cessation over the site in an effort to give information on potential for the “all clear.”

Figure 1.

LightningCast within the trailing anvil portion of the squall line steadily dropped off within the trailing stratiform region. However, these probabilities decreased when cloud to ground lightning was still being observed, with even some strikes occurring in probabilities less than 10%. This can be seen in Figure 1 in the far left hand portion of the animation with CG icons occurring within and outside of the lower contours of LightningCast.

This significantly lowered confidence in tracking the lower probability contours to give an estimated time of cessation.

Here was the DSS message sent at around 21:45 UTC:

As of 4:45 pm CDT, severe thunderstorms are 20 miles west of your site, and continue to approach your site. There is a very high chance these storms remain severe by the time they reach your site, currently expected between 5:15 pm and 5:45 pm CDT, bringing very strong winds over 70 mph out of a direction ranging between northerly to westerly, heavy rainfall, and frequent lightning. We still cannot rule out the potential for a brief tornado and large hail, although the chance for a tornado and hail is much lower than previous hazards mentioned.

Because of the approaching thunderstorms, the chance for lightning to occur within 10 miles of your site within the next hour (5:45 pm CDT) is over 99%.

It is worth noting that even after severe hazards associated with this line of thunderstorms have ended, there will remain over 75% chance of lightning over your site for an additional 1-2 hours, along with the potential for continued gusty winds over 20 mph ranging out of the southeast to northeast.

– 0SMBLSN

Tags: None

BMX Severe Thunderstorms

Overall, I used OCTANE, PHS, ProbSevere 3 and LtgCast today. NUCAPS wasn’t really accessible. Worked the DSS event, an Air Show, which was canceled due to severe thunderstorms all afternoon producing tornadoes, large hail and damaging winds. DSS for this event would have been done days ago.

Below is a shot of LtgCast on a radar background and ELN measured lightning, the +/- are positive and negative ground strokes, and the cyan dots are in-cloud. It is interesting how the 75% probs lead out into southwestern Georgia though the showers there are more stratified and lightning isn’t expected, yet it gave about 45 minute notice of lightning strikes; that’s a good thing. But how useful is this? It predicted a few single lightning strikes tens of miles apart scattered across 100 miles which isn’t really useful; would you stop all outdoor activities across ¼ of Georgia for a few stray strikes? Would you clear the baseball field because a lightning strike will hit in the next hour somewhere within 50 miles? Not likely, but knowing there is some chance is valuable information for an event coordinator for risk analysis. If they can make minor changes to activities with little or no impacts, it helps, especially if it’s an area where lightning isn’t expected. What would be a big plus would be an estimate of flash density/frequency expected to go with the probs. That gets back to tracking the convective cells to predict areas of dense lightning. We have radar and ELN’s for that.

PHS composite reflectivity vs radar at 21Z… I find little value in the PHS composite reflectivity product. Below you see PHS composite reflectivity compared to the radar returns at 21Z. It’s not doing too well and I haven’t seen a time when it has done well predicting where the storms will be. The HRRR, NSSL WARF, HRef, NAM Nest and other high res models do much better.

PHS Bulk Shear 0-1 km below on the left and 0-3 km below on the right both show a line between areas of lower and higher shear along the boundary where the severe storms were tracking, but this occurred after the convection started. I don’t see a pre convection signal pointing to where the training storms formed.

The Bulk Shear 0-6 km below shows more promise with the 19Z  frame showing a boundary where the training severe storms formed/tracked (what did it look like at 16Z or 17Z?). I would need to see more of this pre convection to really make a judgment, and would need to see positive validation/verification to have any confidence in it as a tool.

– Super Bolt

Tags: None

PHS Reflectivity Forecast Helping Out with DSS

The Panda Ceremony was held at the Jackson, MS Zoo on the evening of Wednesday, Jun 14, 2023.  Strong to severe storms were forecast throughout the afternoon and evening hours and the event coordinator requested DSS for lightning and any severe weather with as much lead time as possible.  Using the 14.16z initialization of the PHS reflectivity was useful in providing some timing details to the event coordinator (See Figure 1). It suggested a fairly robust storm to roll through the Jackson area by around 00z with the forecast reflectivity ranging from 50-65 dBz directly over the event site.  

The reflectivity forecast did well with depicting a fairly large storm to move across southern Mississippi but was a bit too north on the location.  Overall, the product was very useful in boosting the forecaster’s confidence in the convection timing to impact the event. See Figure 4 for a look a the verification.

Figure 1: Loop of the 14.16z PHS layer reflectivity had a large storm over Jackson, MS, and impact the event (black range ring) by 00z.

Figure 2: A DSS Graphic was issued shortly after 3 p.m. to highlight the timing and potential impacts of the Panda Ceremony.  The original image had the animated GIF above with the PHS reflectivity forecast.

Figure 3: This was the first of 3 graphics created for the event and this graphic highlighted the severe weather threat and timing.  Overlaid is the MRMS reflectivity greater than 35 dBz and OCTANE Winds.

Figure 4:  A loop of MRMS with ProbSevere and LightningCast shows some verification of the PHS reflectivity forecast shown above. This loop ends at 2232z.   

– Podium

Tags: None

Verification of NUCAPS Soundings

Using the 1930z pass of the NUCAPS soundings during an SPC Moderate Risk was quite exciting.  The environment was primed for significant severe weather and having NUCAPS soundings available at the time of convection out of ahead of storms was beneficial. It provided additional confidence in the severity of the environment. 

As you can see from the satellite, soundings were unusable further north due to the ongoing convection and cloud cover. Thankfully clear skies prevailed from Jackson and southeastward providing some impressive sounding data to compare to SPC Mesoanalysis.  Sounding A was well in the warm sector and sunny skies and thus had the highest CAPE values and lapse rates. Sounding B was just to the southwest of the DSS event and was beginning to see some anvil over that location, but it still provided reasonable data and compared well with SPC mesoanalysis.    

Figure 1: Location of the NUCAP Soundings chosen to view and compare to SPC mesoanalysis. For reference, the range rings outline the 5 and 10-mile radius around a DSS event in Jackson, MS. 

Figure 2: Sounding A with a surface-based CAPE of 6004!

Figure 3: Sounding B with a modest 4079 surface-based CAPE.

Figure 4: SPC mesoanalysis Surface-Based CAPE and CIN at 20z on June 14, 2023.  The star is the DSS event location and the two dots are the estimated location of the soundings analyzed.

Figure 5: SPC Mesoanalysis 0-3km lapse rate (C/km) depicted lapse rates from 7.0-8.0. Once again, both soundings matched up well with SPS data.

– Podium

Tags: None