
Using the 1930z pass of the NUCAPS soundings during an SPC Moderate Risk was quite exciting. The environment was primed for significant severe weather and having NUCAPS soundings available at the time of convection out of ahead of storms was beneficial. It provided additional confidence in the severity of the environment.
As you can see from the satellite, soundings were unusable further north due to the ongoing convection and cloud cover. Thankfully clear skies prevailed from Jackson and southeastward providing some impressive sounding data to compare to SPC Mesoanalysis. Sounding A was well in the warm sector and sunny skies and thus had the highest CAPE values and lapse rates. Sounding B was just to the southwest of the DSS event and was beginning to see some anvil over that location, but it still provided reasonable data and compared well with SPC mesoanalysis.
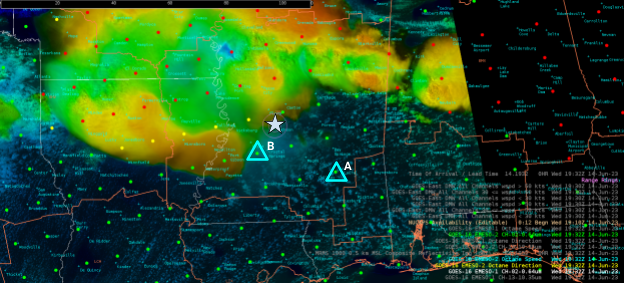
Figure 1: Location of the NUCAP Soundings chosen to view and compare to SPC mesoanalysis. For reference, the range rings outline the 5 and 10-mile radius around a DSS event in Jackson, MS.
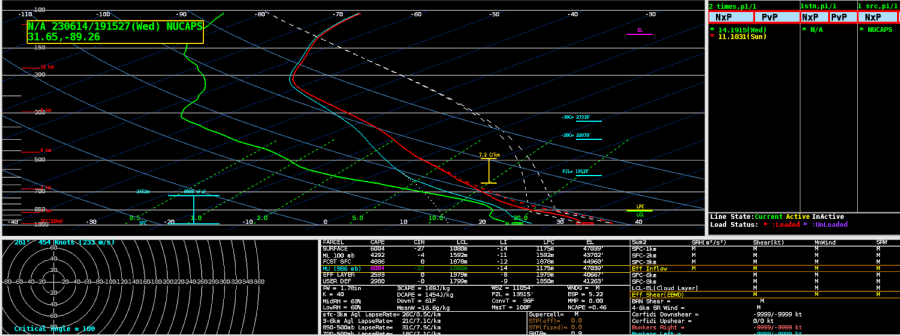
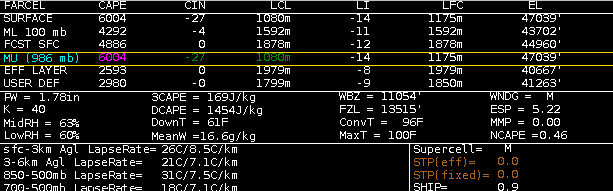
Figure 2: Sounding A with a surface-based CAPE of 6004!
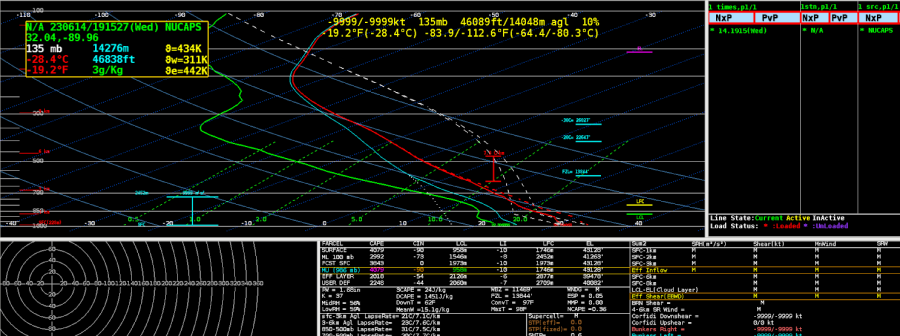
Figure 3: Sounding B with a modest 4079 surface-based CAPE.
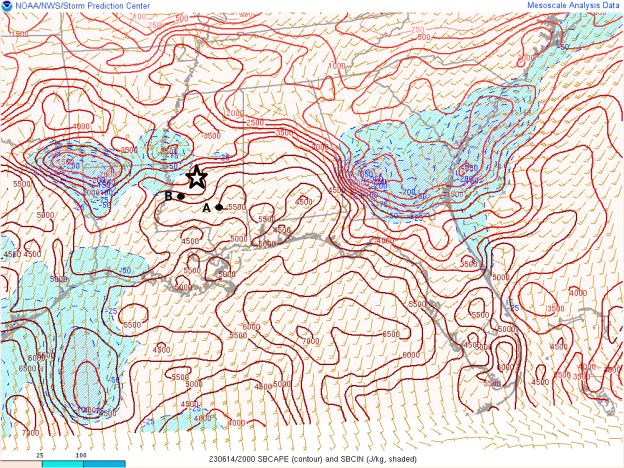
Figure 4: SPC mesoanalysis Surface-Based CAPE and CIN at 20z on June 14, 2023. The star is the DSS event location and the two dots are the estimated location of the soundings analyzed.
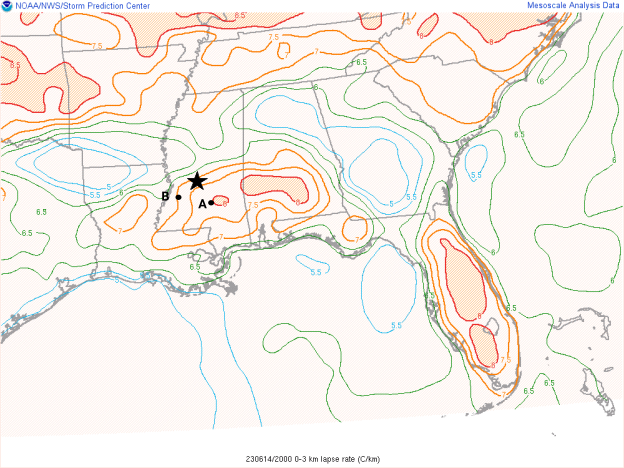
Figure 5: SPC Mesoanalysis 0-3km lapse rate (C/km) depicted lapse rates from 7.0-8.0. Once again, both soundings matched up well with SPS data.
– Podium