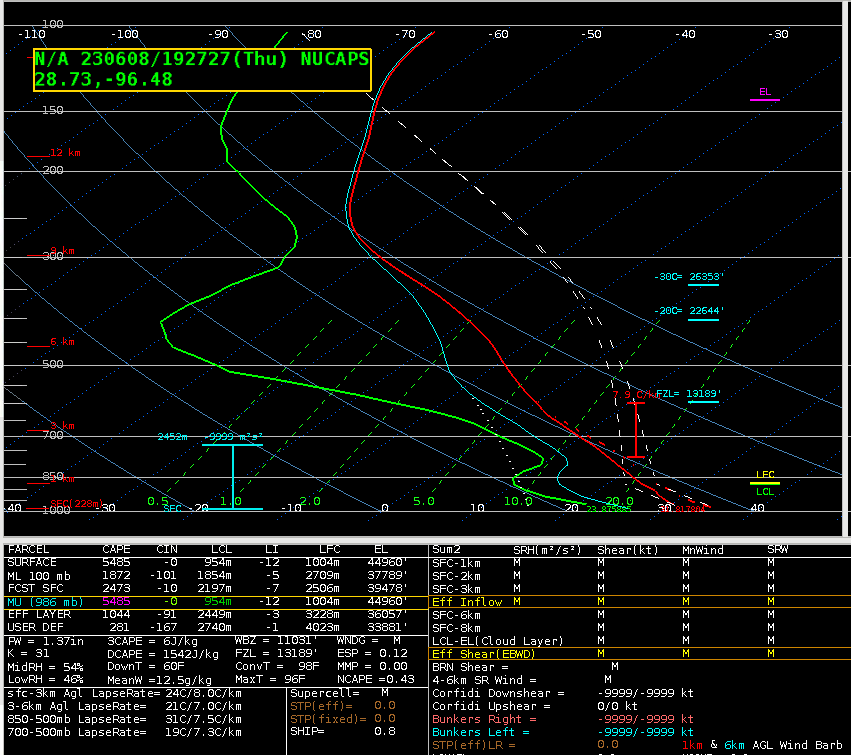
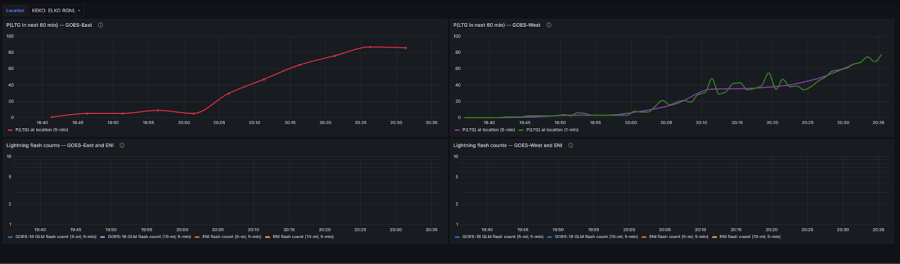
PHS today was interesting given some of the local convective parameters. The main one that caught my attention was the lesser 0-6km bulk shear that it was giving just ahead of an incoming storm in the Oklahoma Panhandle. The PHS was around 20-30 knots whereas other guidance and SPC Mesoanalysis was showing 50+ knots. I did look at other parameters such as MUCAPE and SBCAPE for example and they were in the ballpark of other guidance including SPC Mesoanalysis. If the PHS was correct then the storm mode would feature more multicell with some organization vs more of a discrete supercell mode so it was going to be interesting to see what would occur.
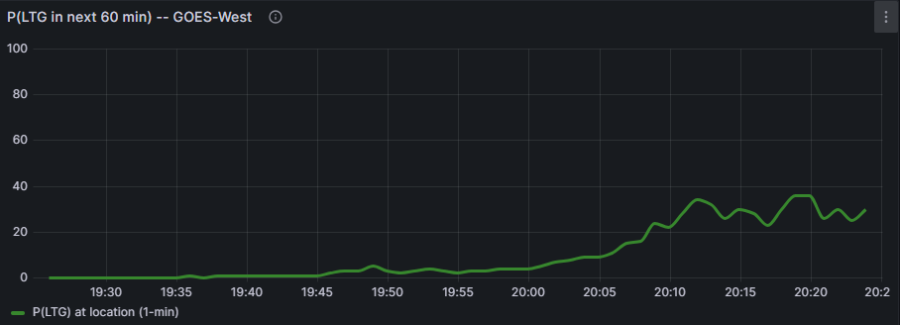
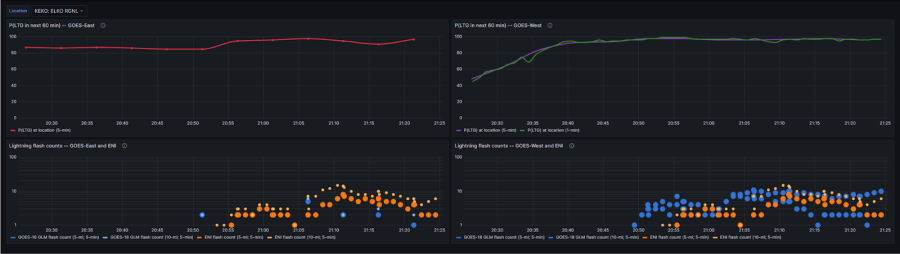
What wound up occurring was a persistent long track supercell along with other convection which was anticipated given the PHS wind shear. Overall, I was impressed with the PHS wind shear forecast as that tailored away any thinking that there may be additional supercells as additional updrafts would interfere with the intensification of other cells. The PHS however was around 1-2 hours slow with convection moving into the AMA CWA, however the composite reflectivity forecast did show more of a cluster of storms developing. The PHS was also showing a corridor of stronger 0-3 and 0-1 SRH which in reality the intense cell did move through and actually wound up producing a few tornadoes. The ProbTor was also showing tornado potential as high as 40% as it was moving through this corridor. Overall, I was impressed with the PHS today and think that it could create good DSS messaging opportunities along with being skillful in Mesoanalysis.
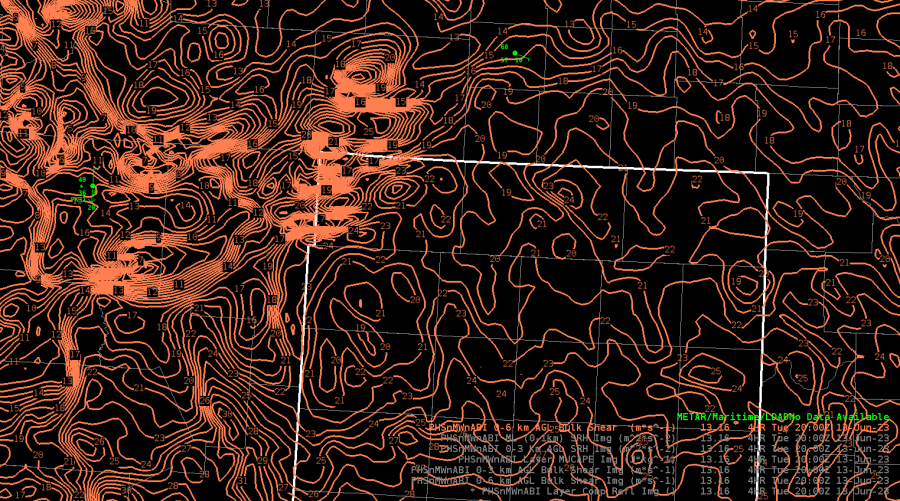
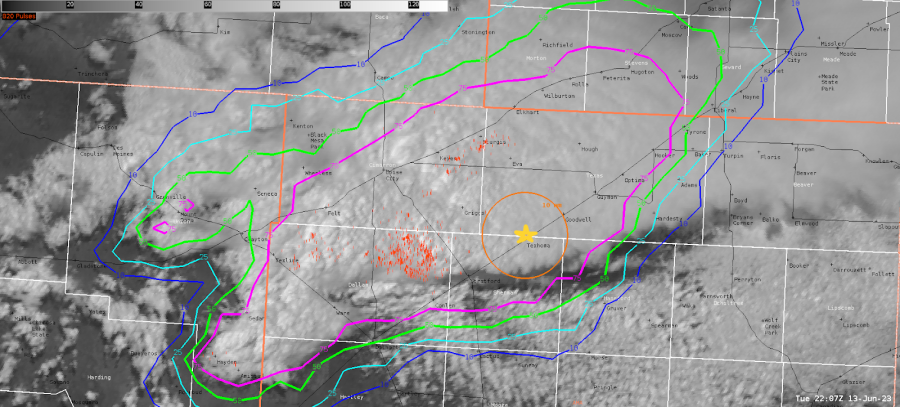
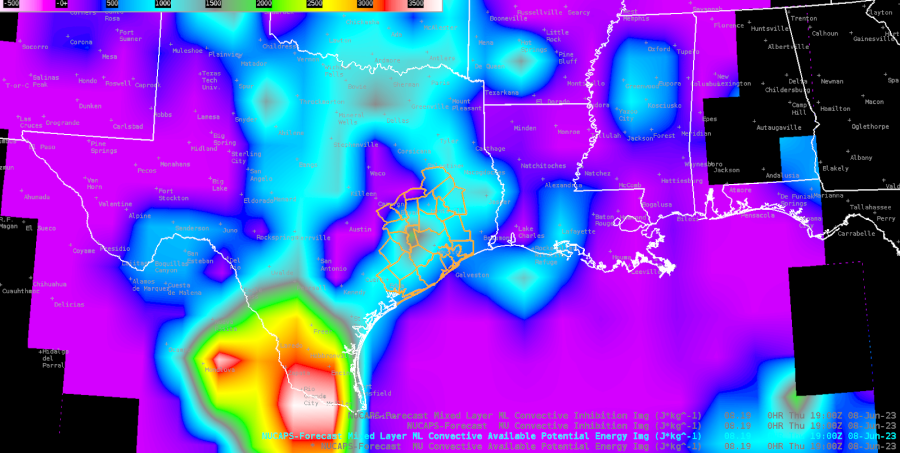
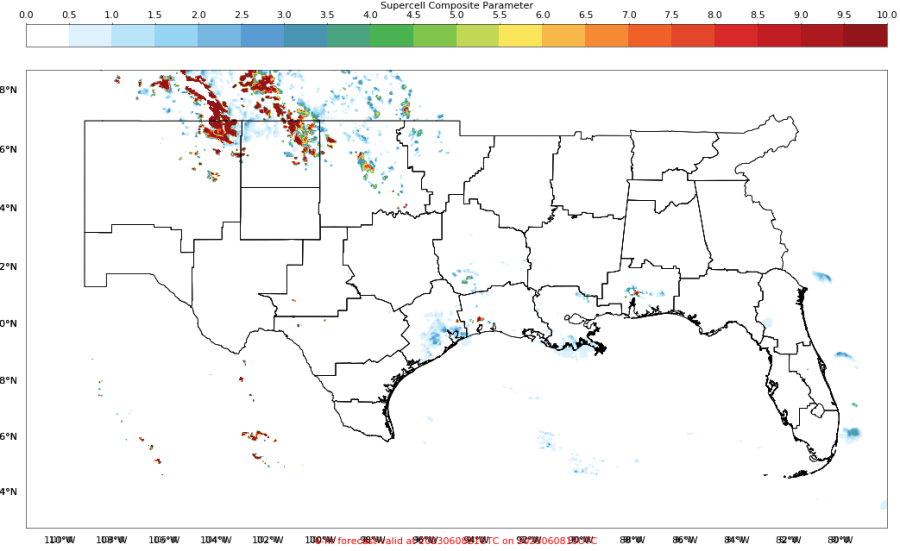
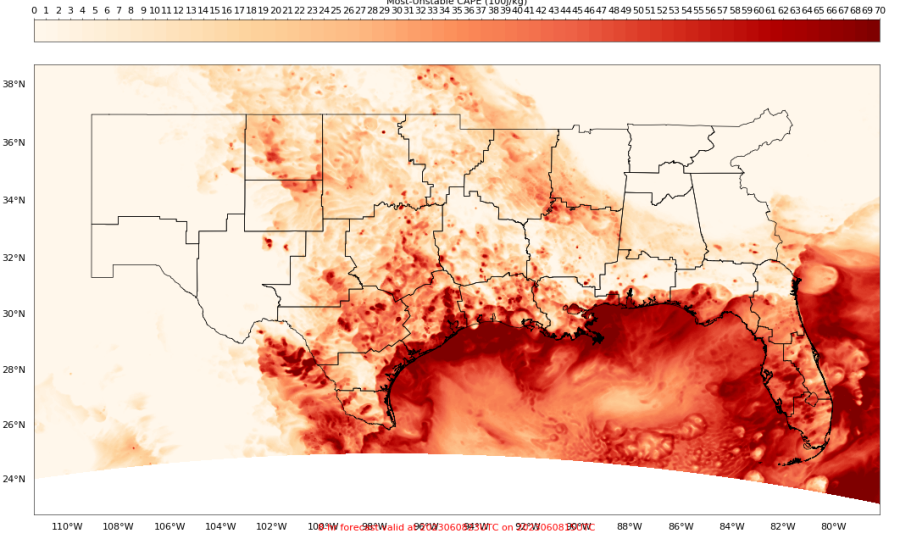
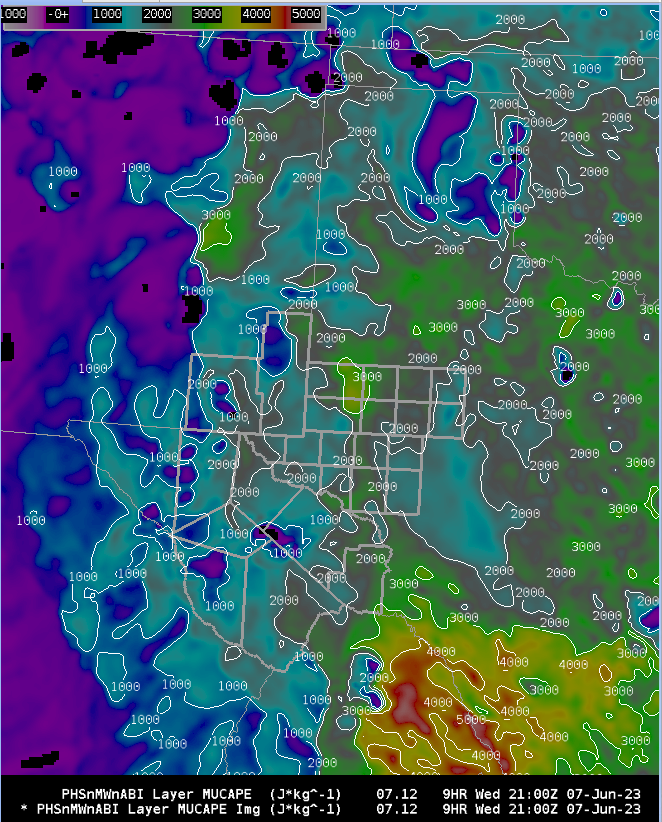
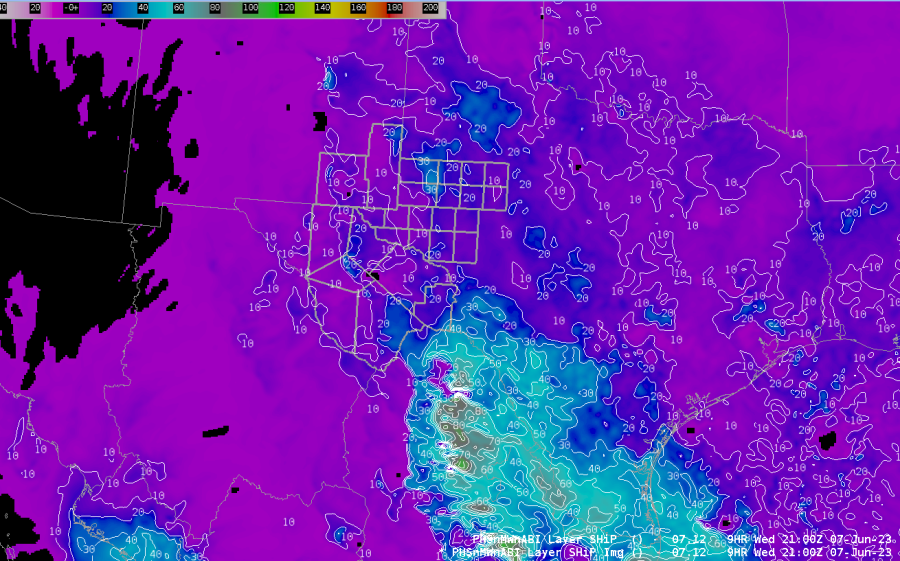
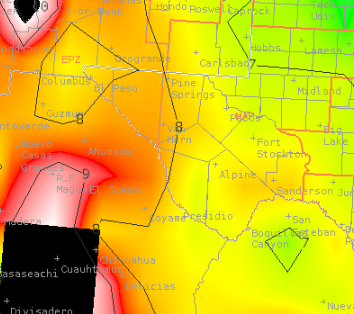
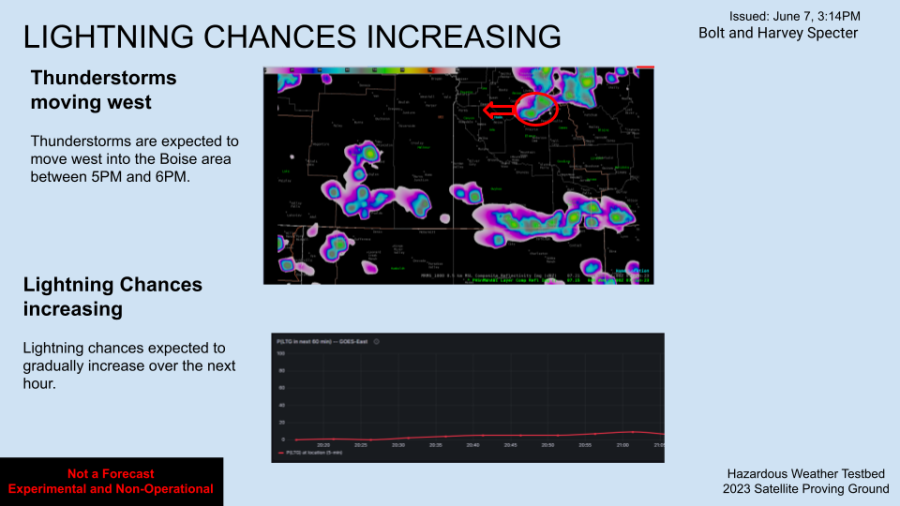
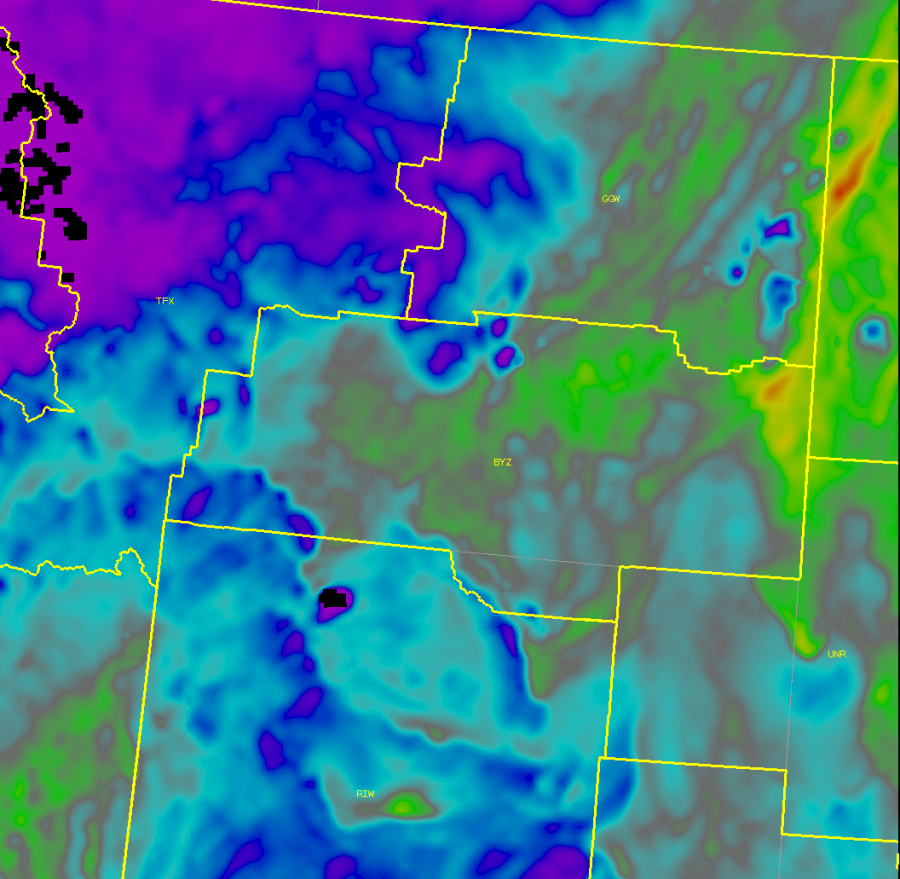
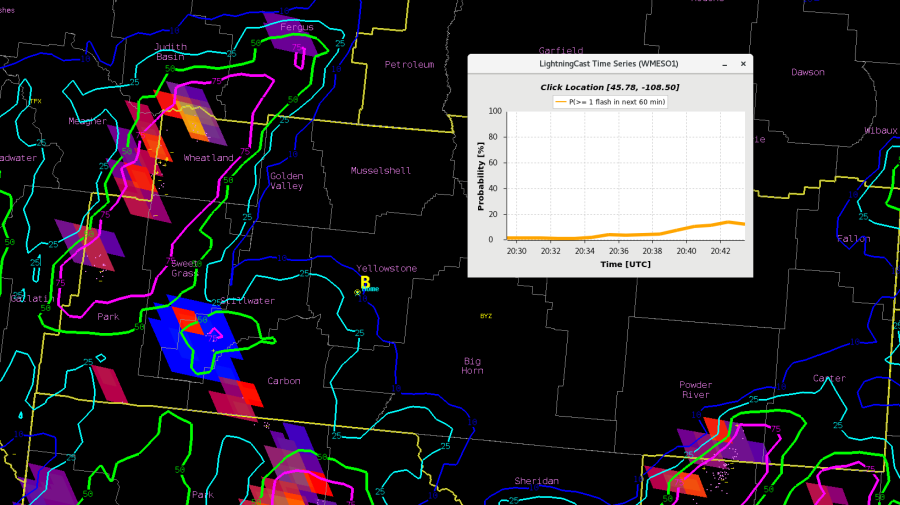
PHS showing the lesser values of 0-6 bulk shear in contoured form
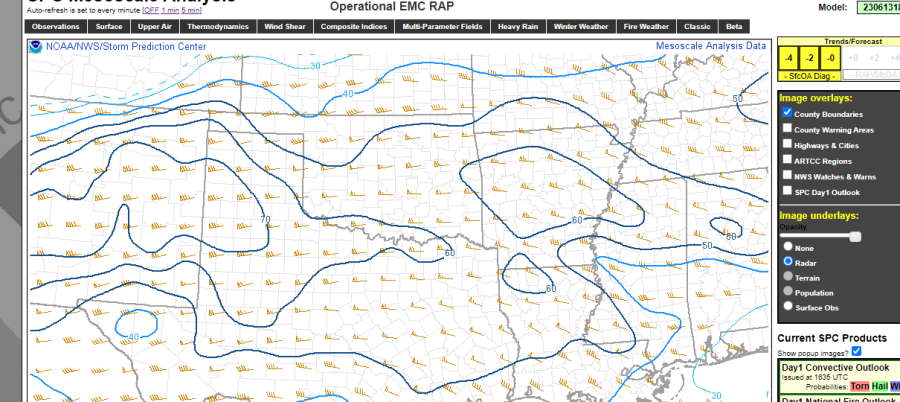
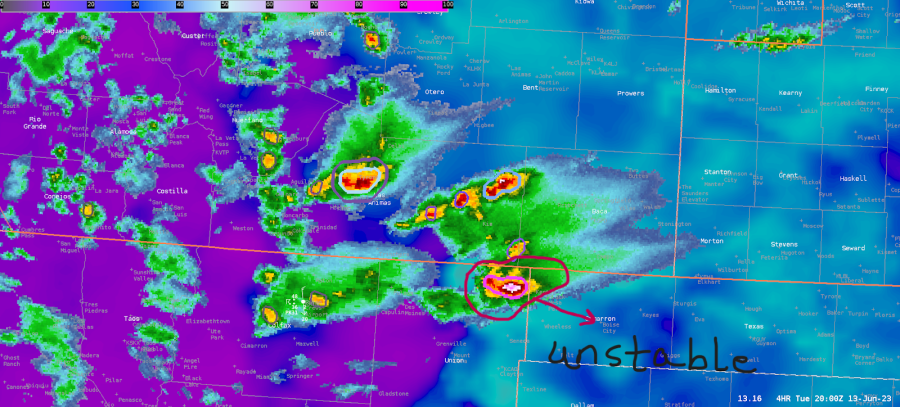
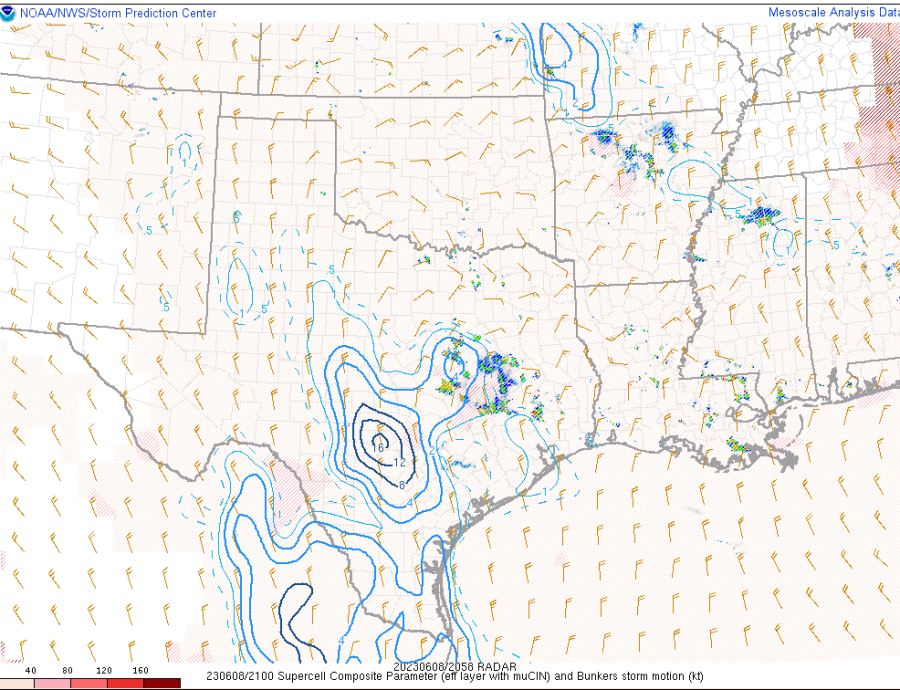
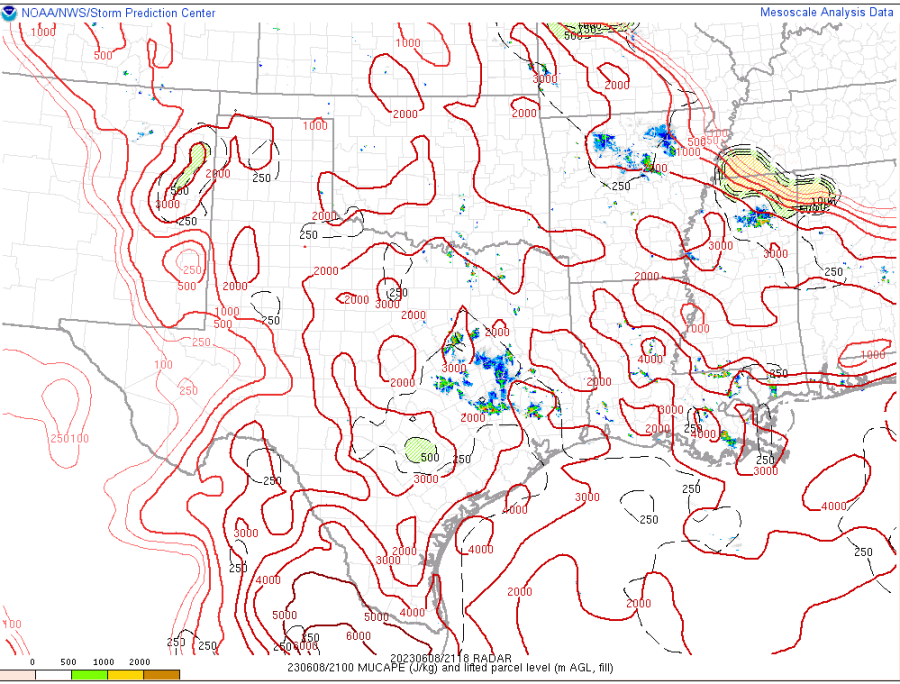
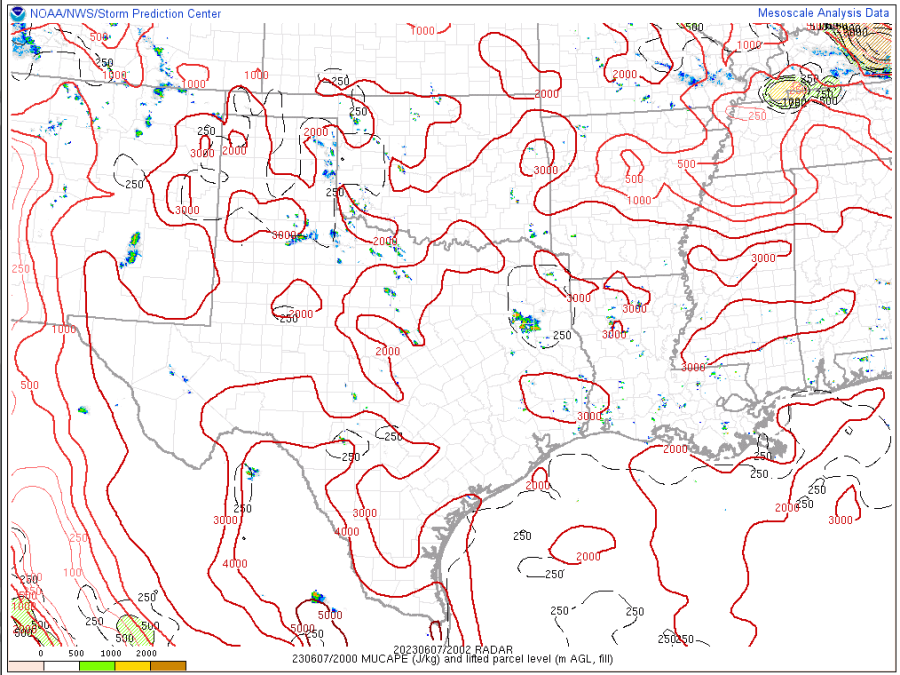
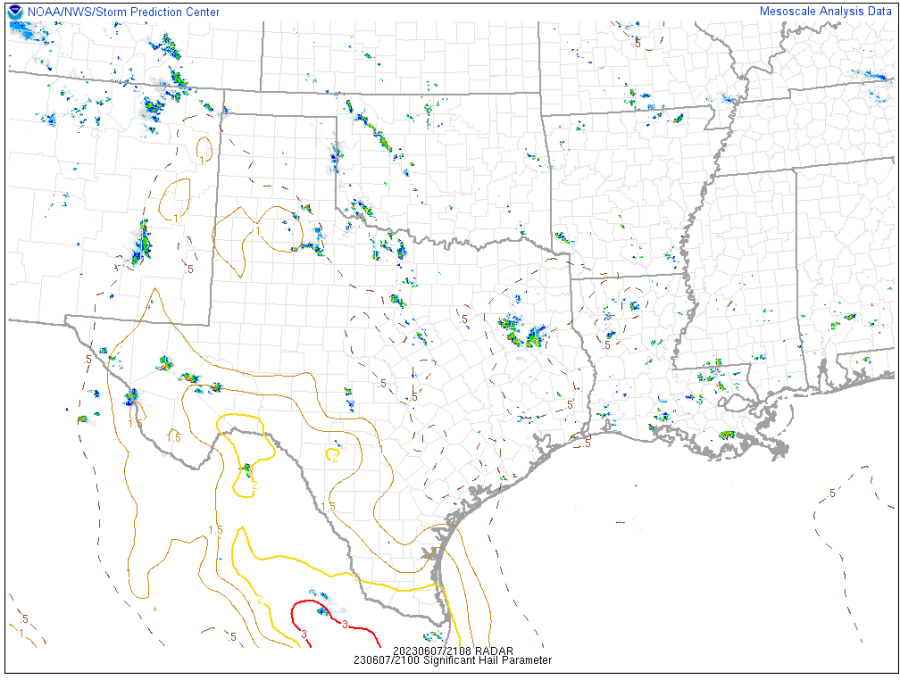
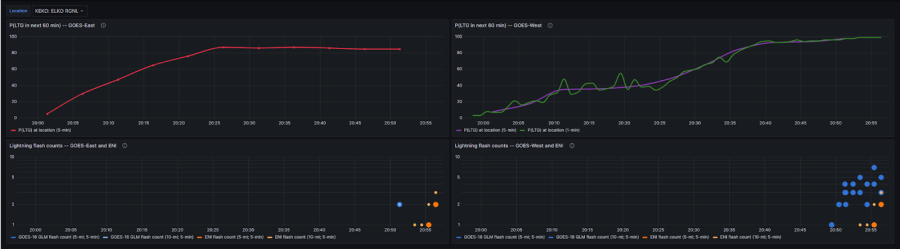
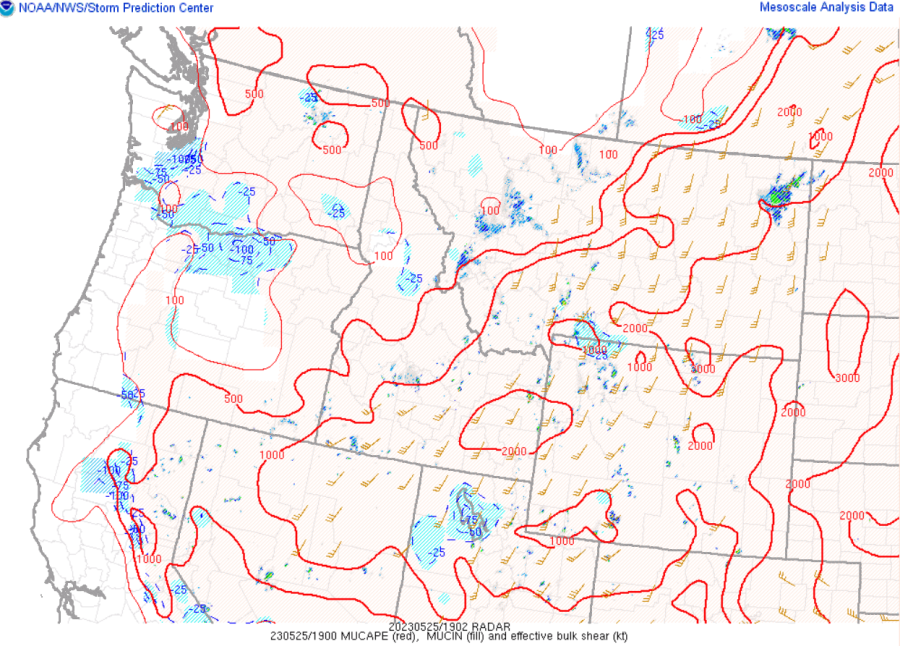
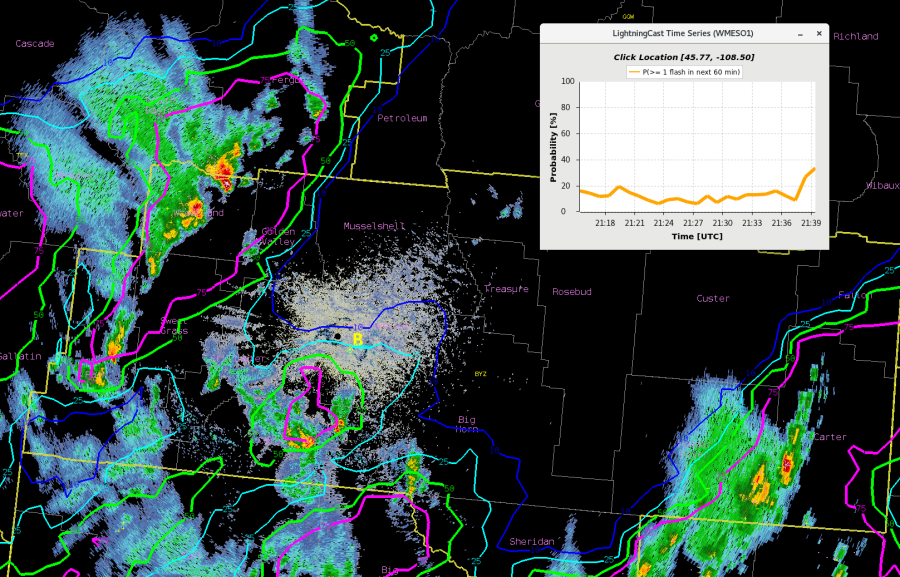
SPC Mesoanalysis depicting the 0-6km bulk shear at the same time
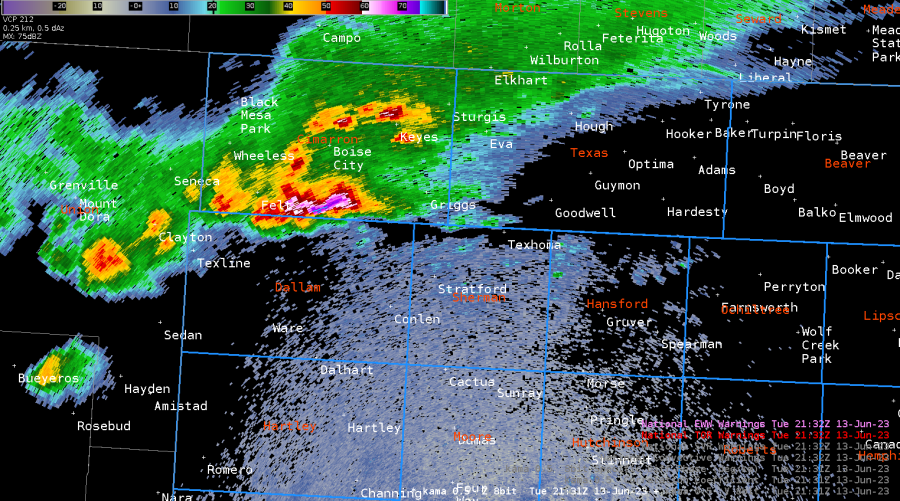
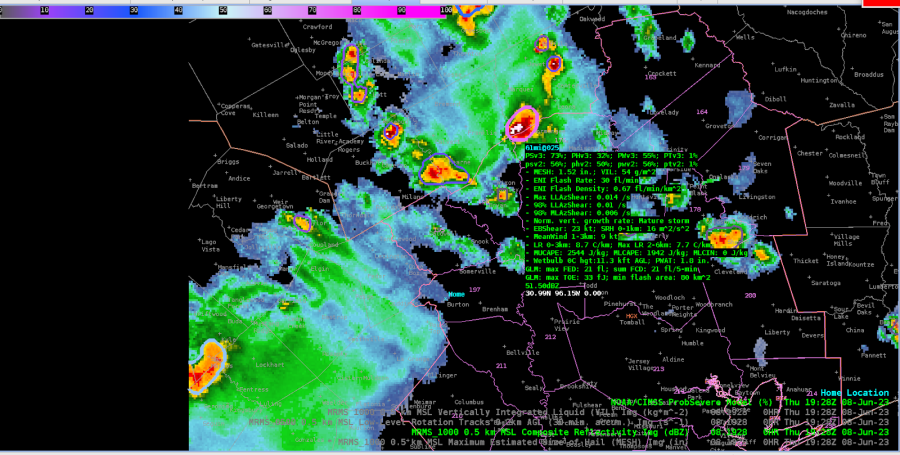
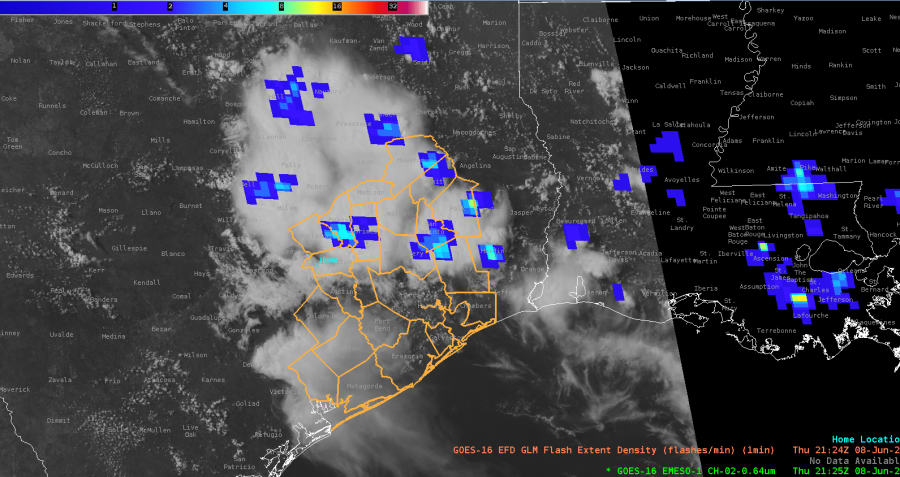
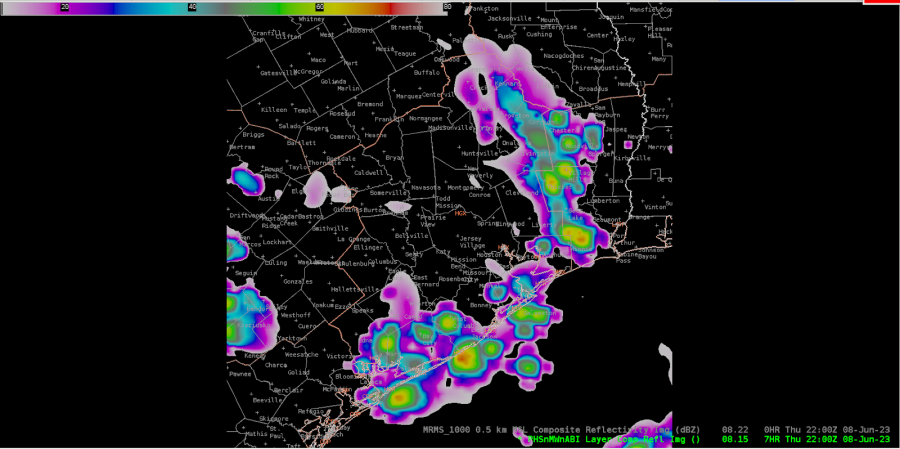
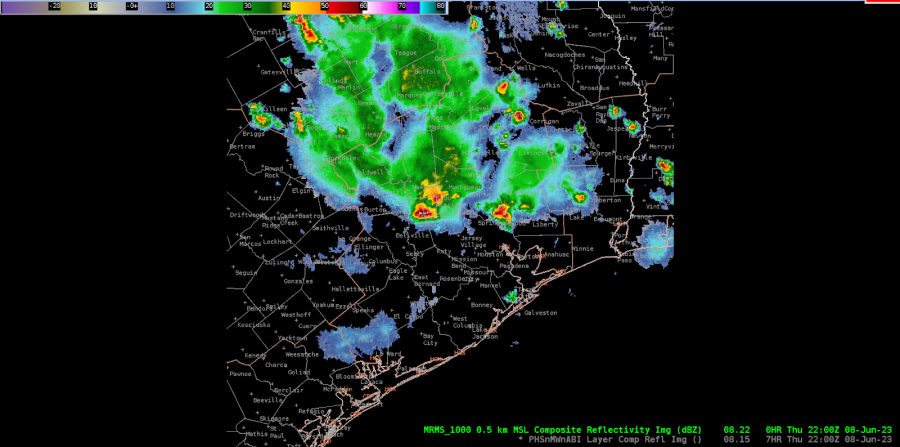
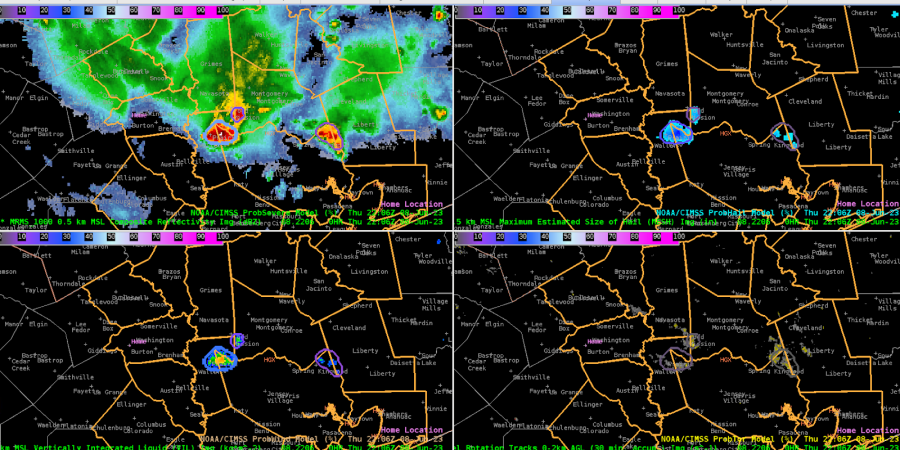
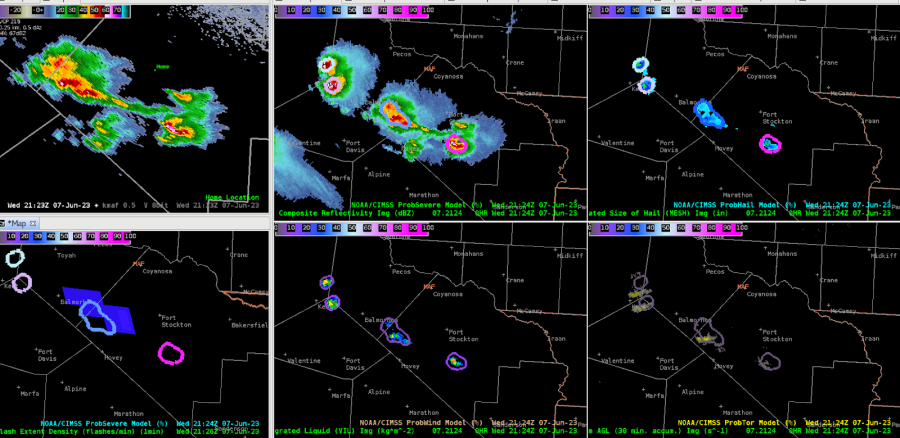
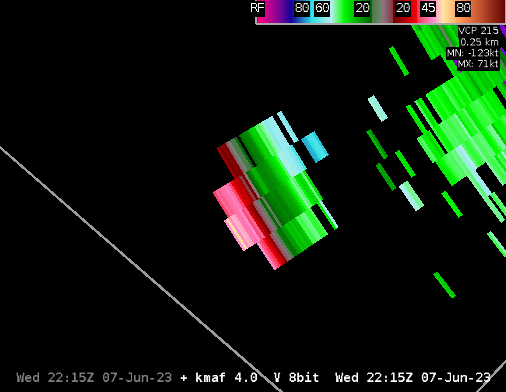
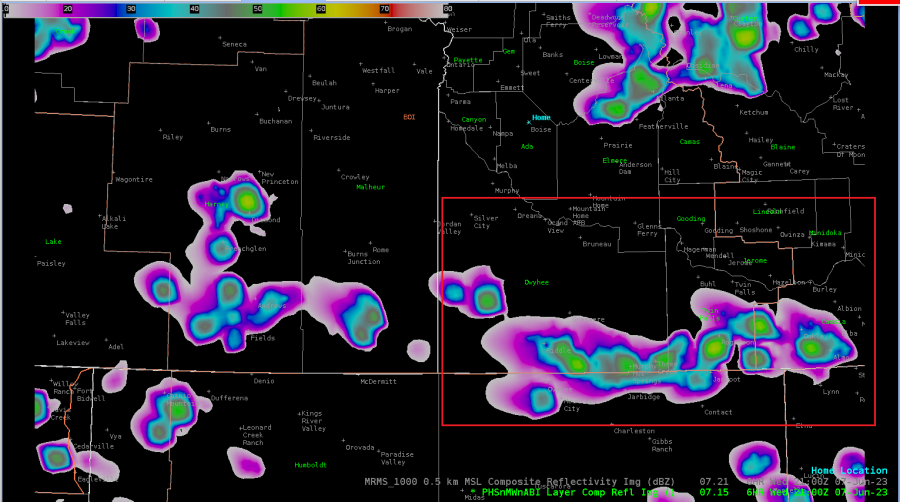
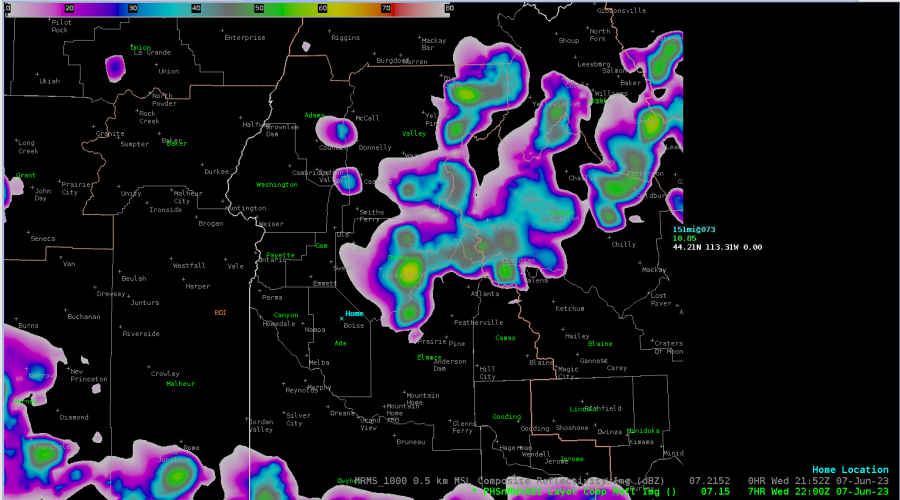
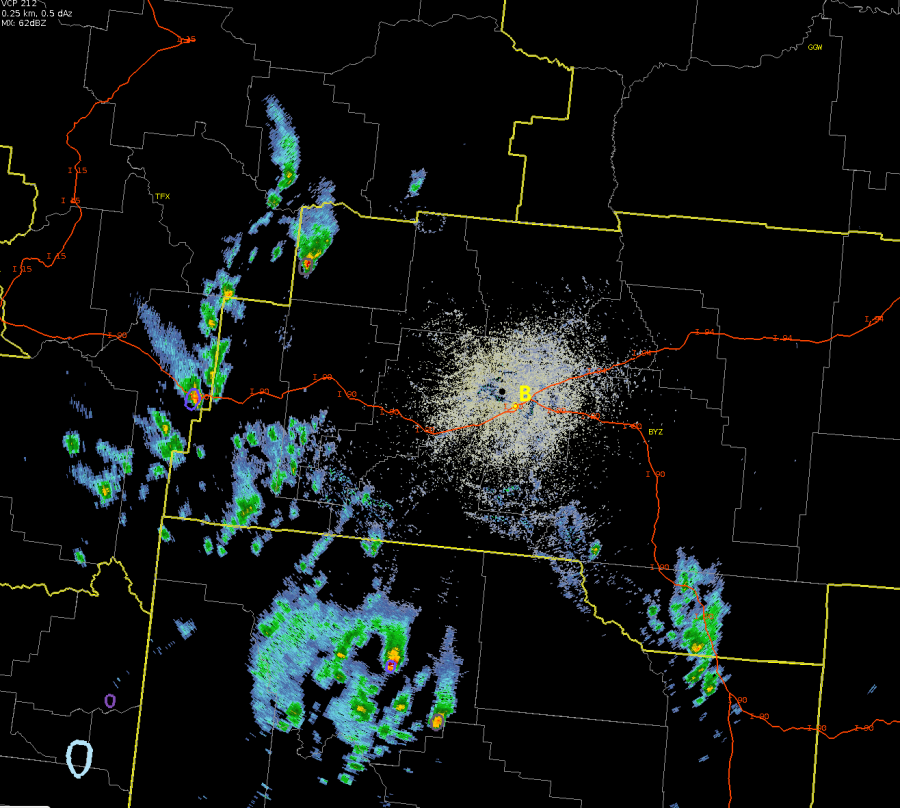
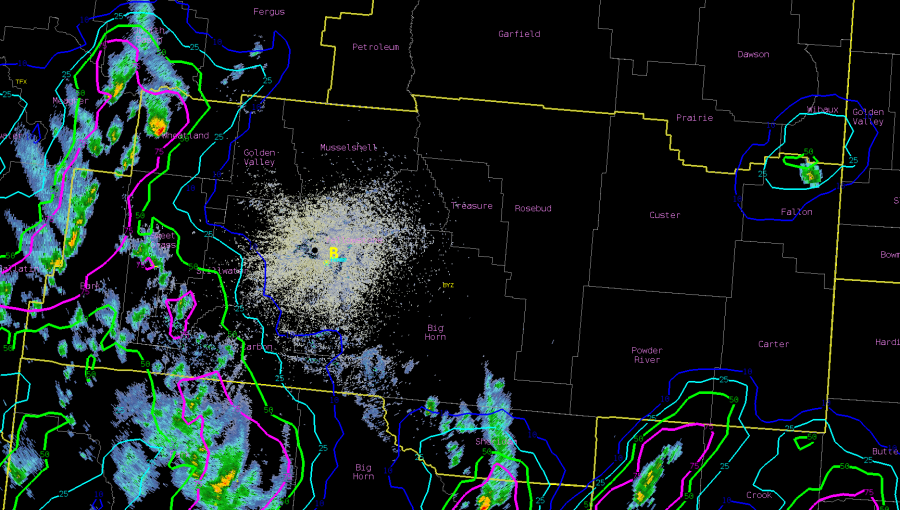
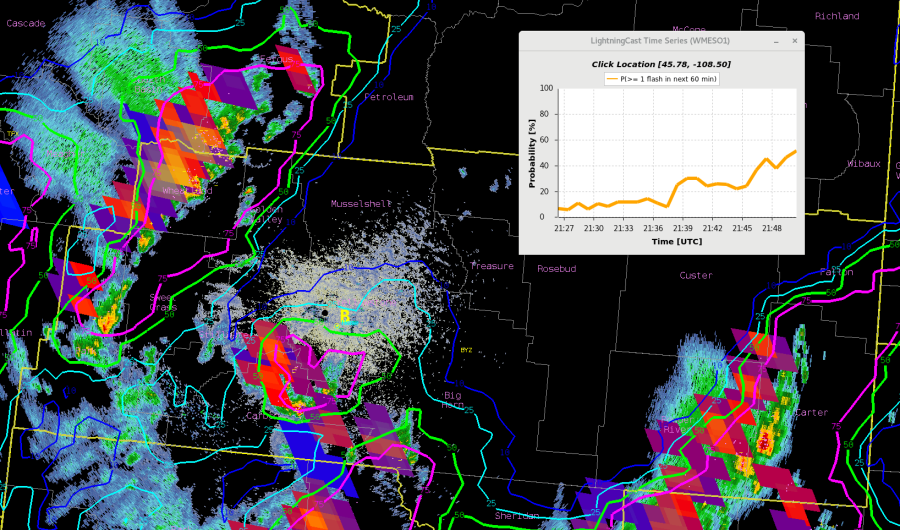
How the radar wound up turning out at 2130Z with the multiple cells
– Tor Nader
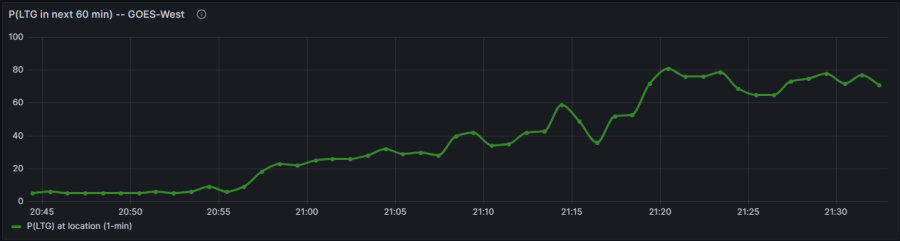

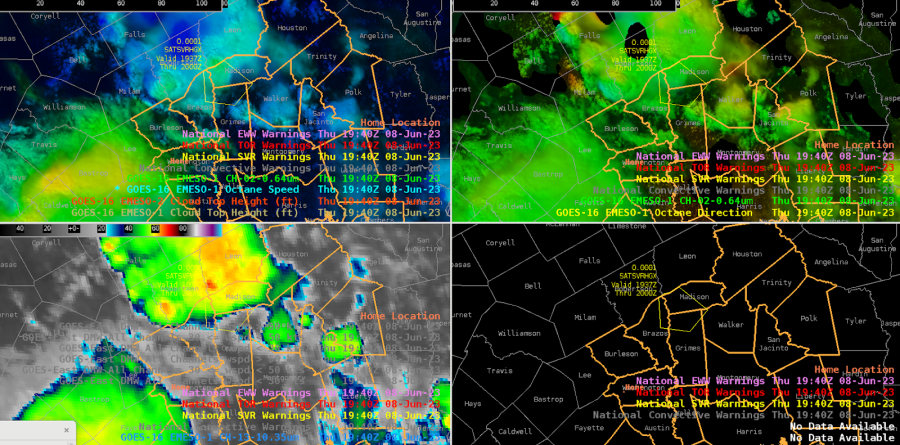
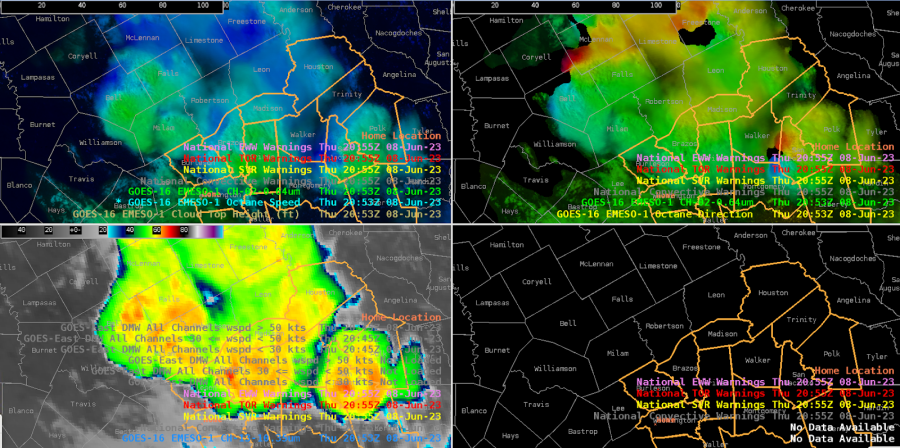
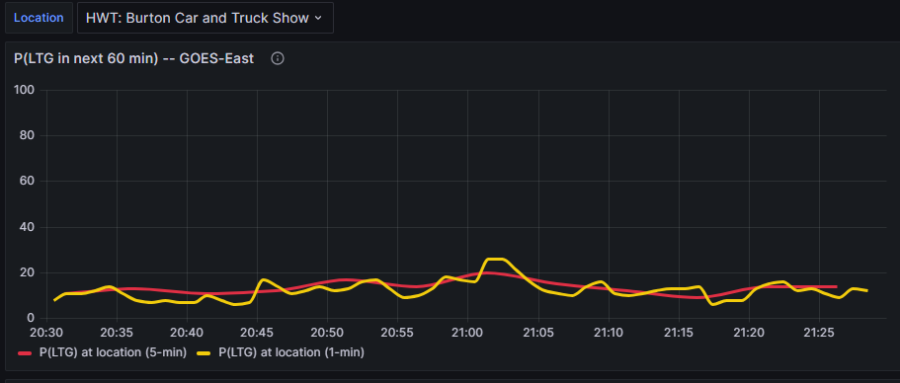
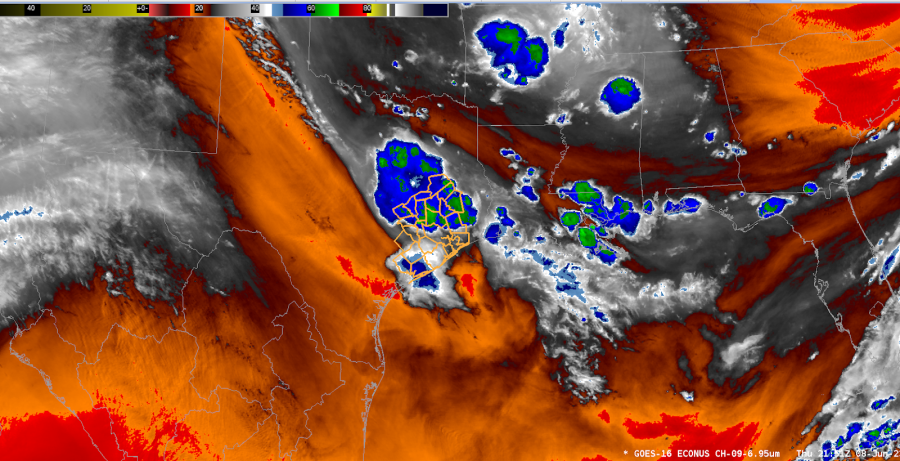
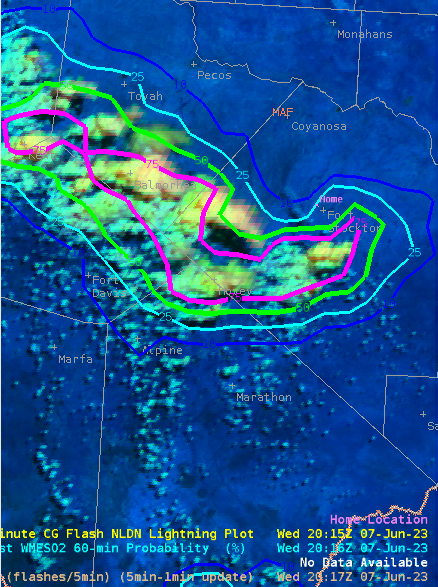
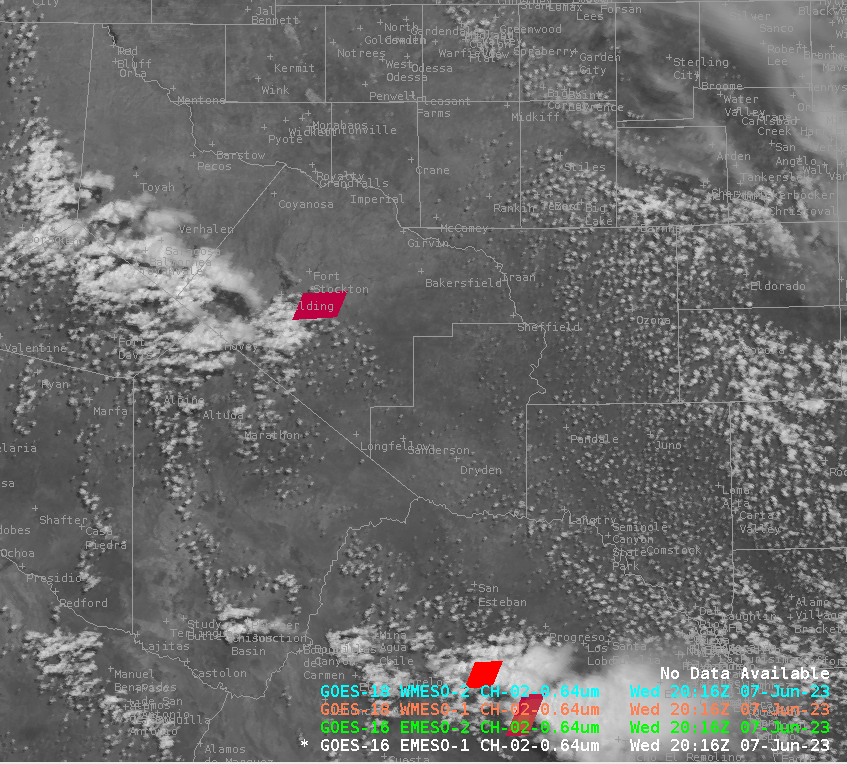
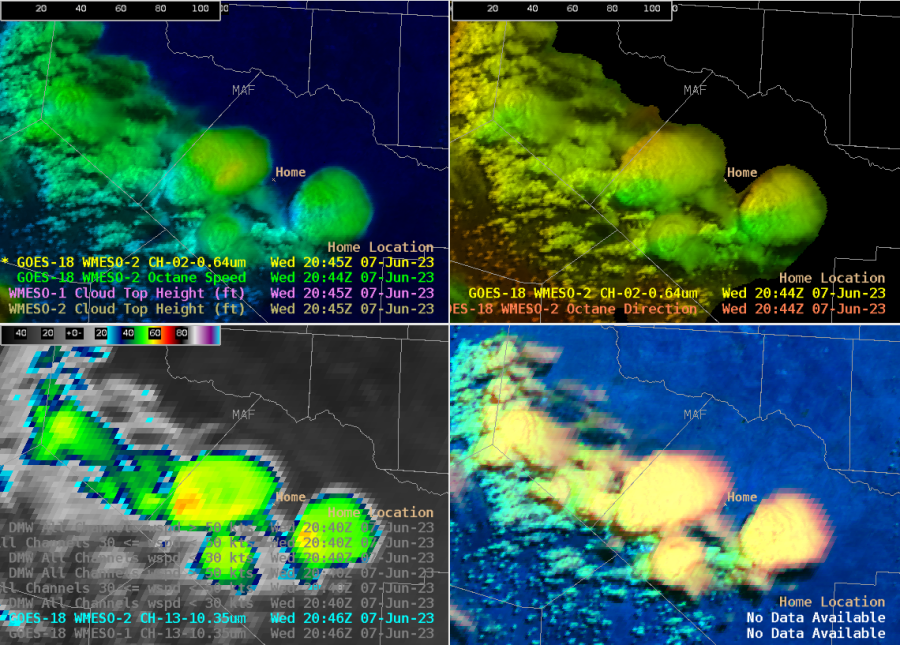
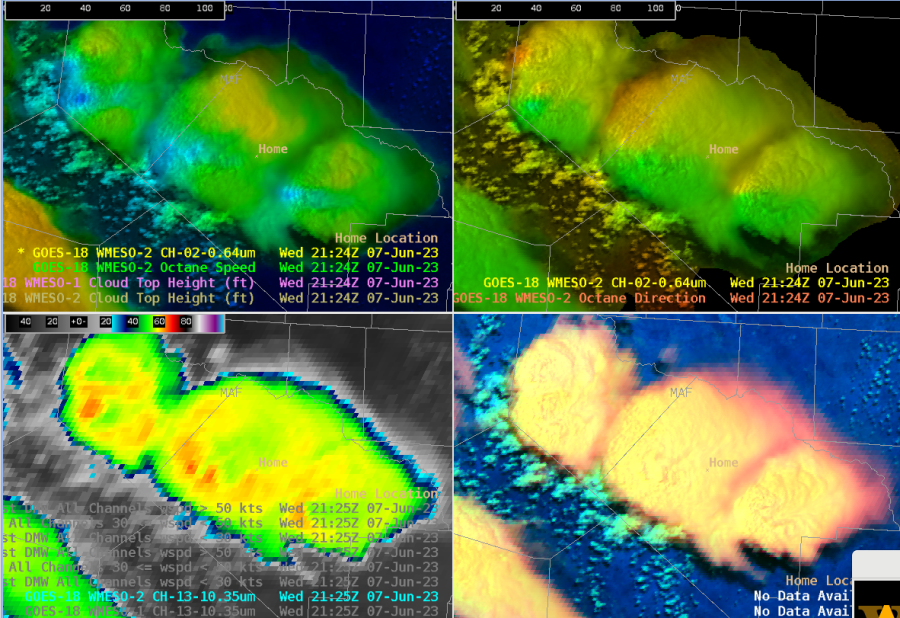
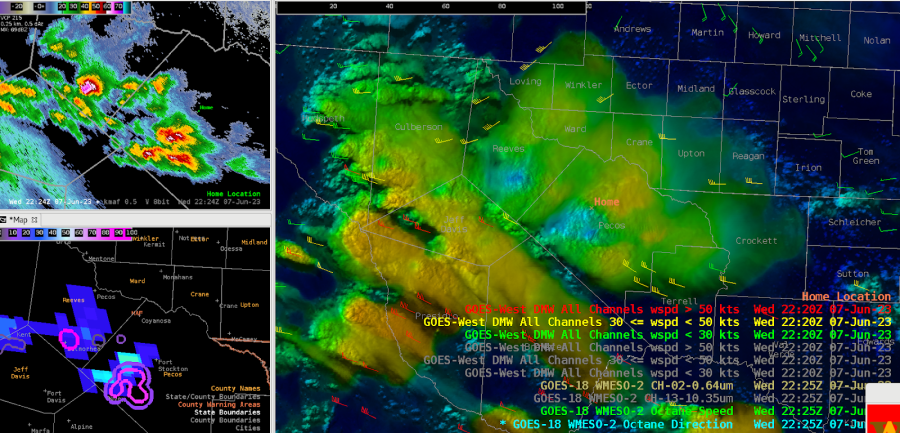
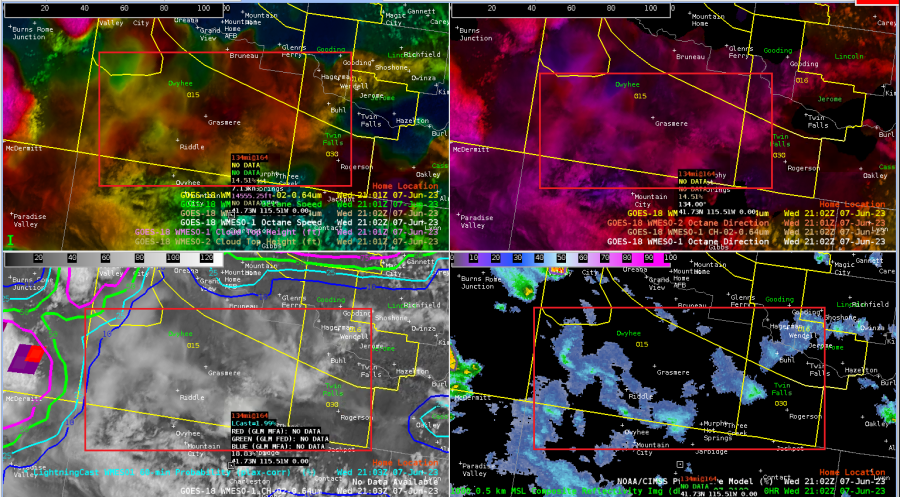
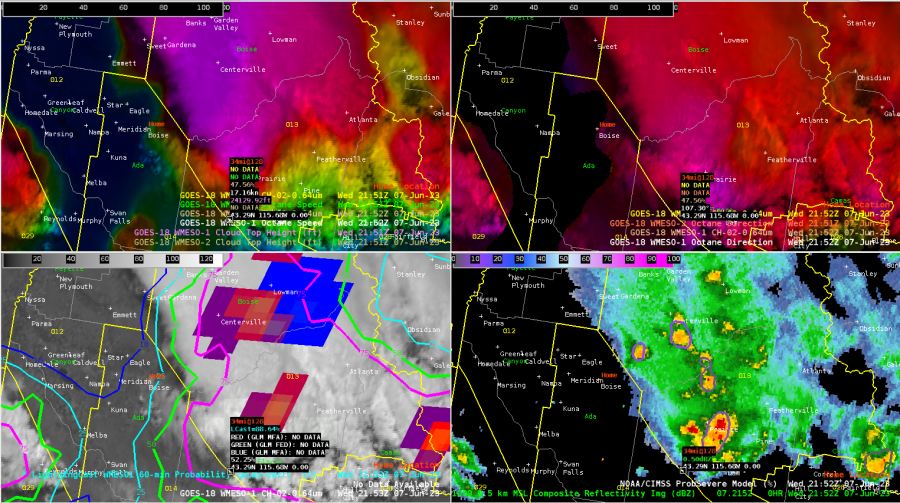
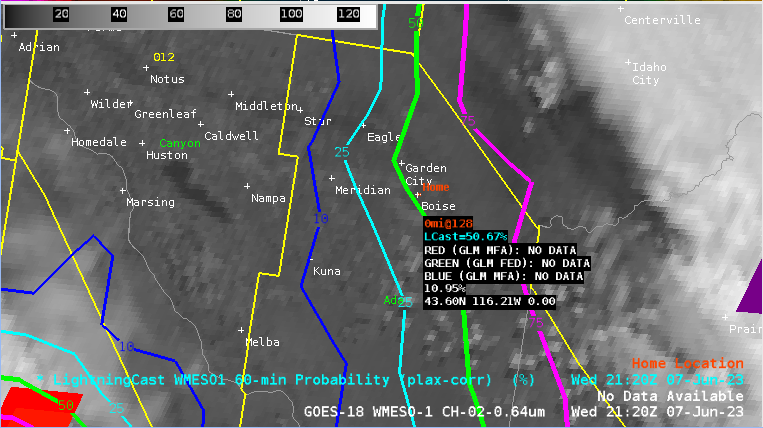

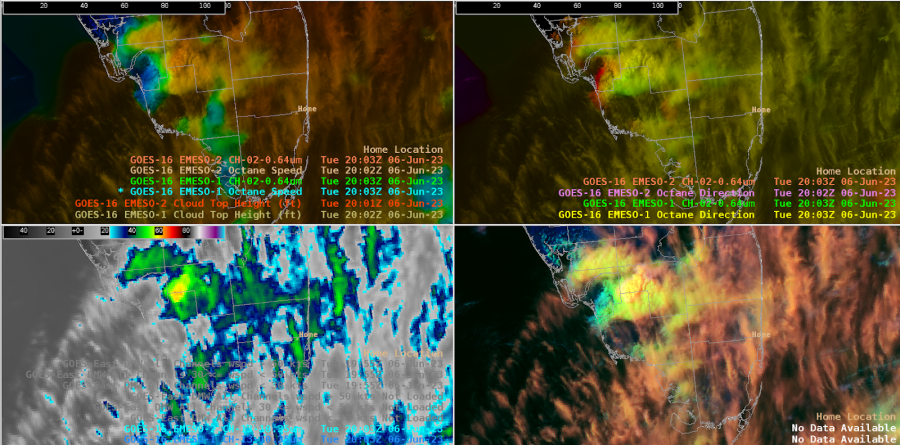


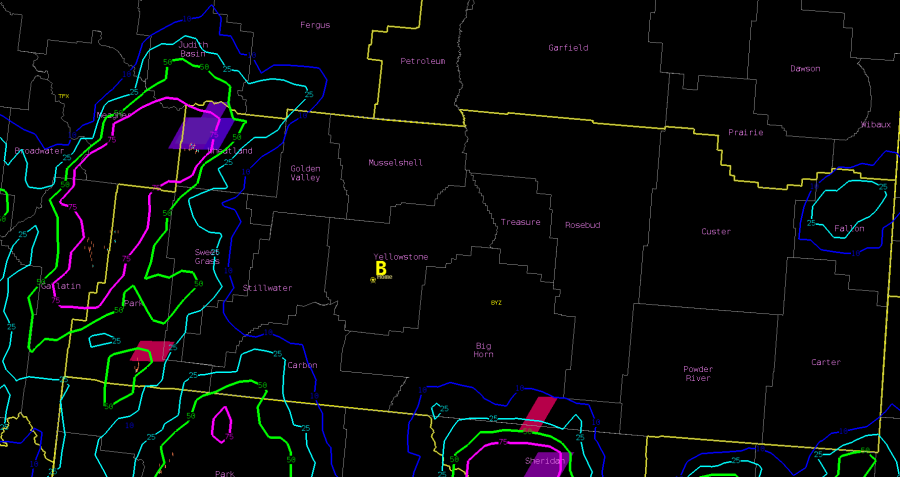
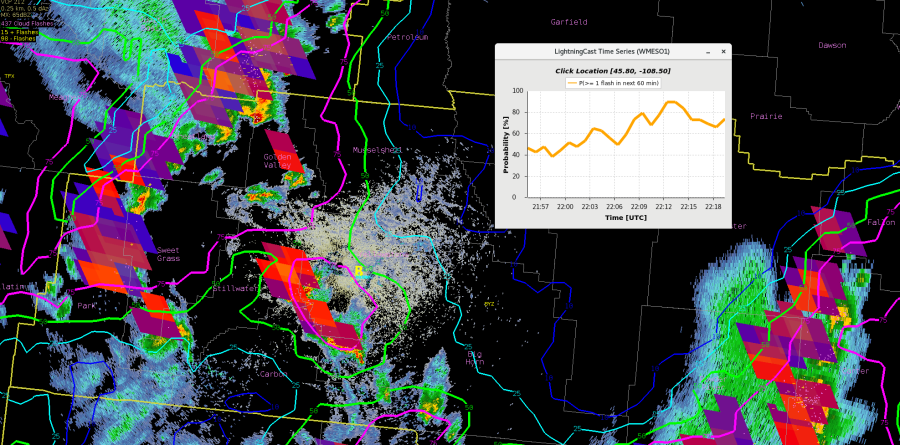
 Octane Speed Sandwich also captured the outflow boundary approaching the DSS Event.