Using GLM to decide to issue an SPS

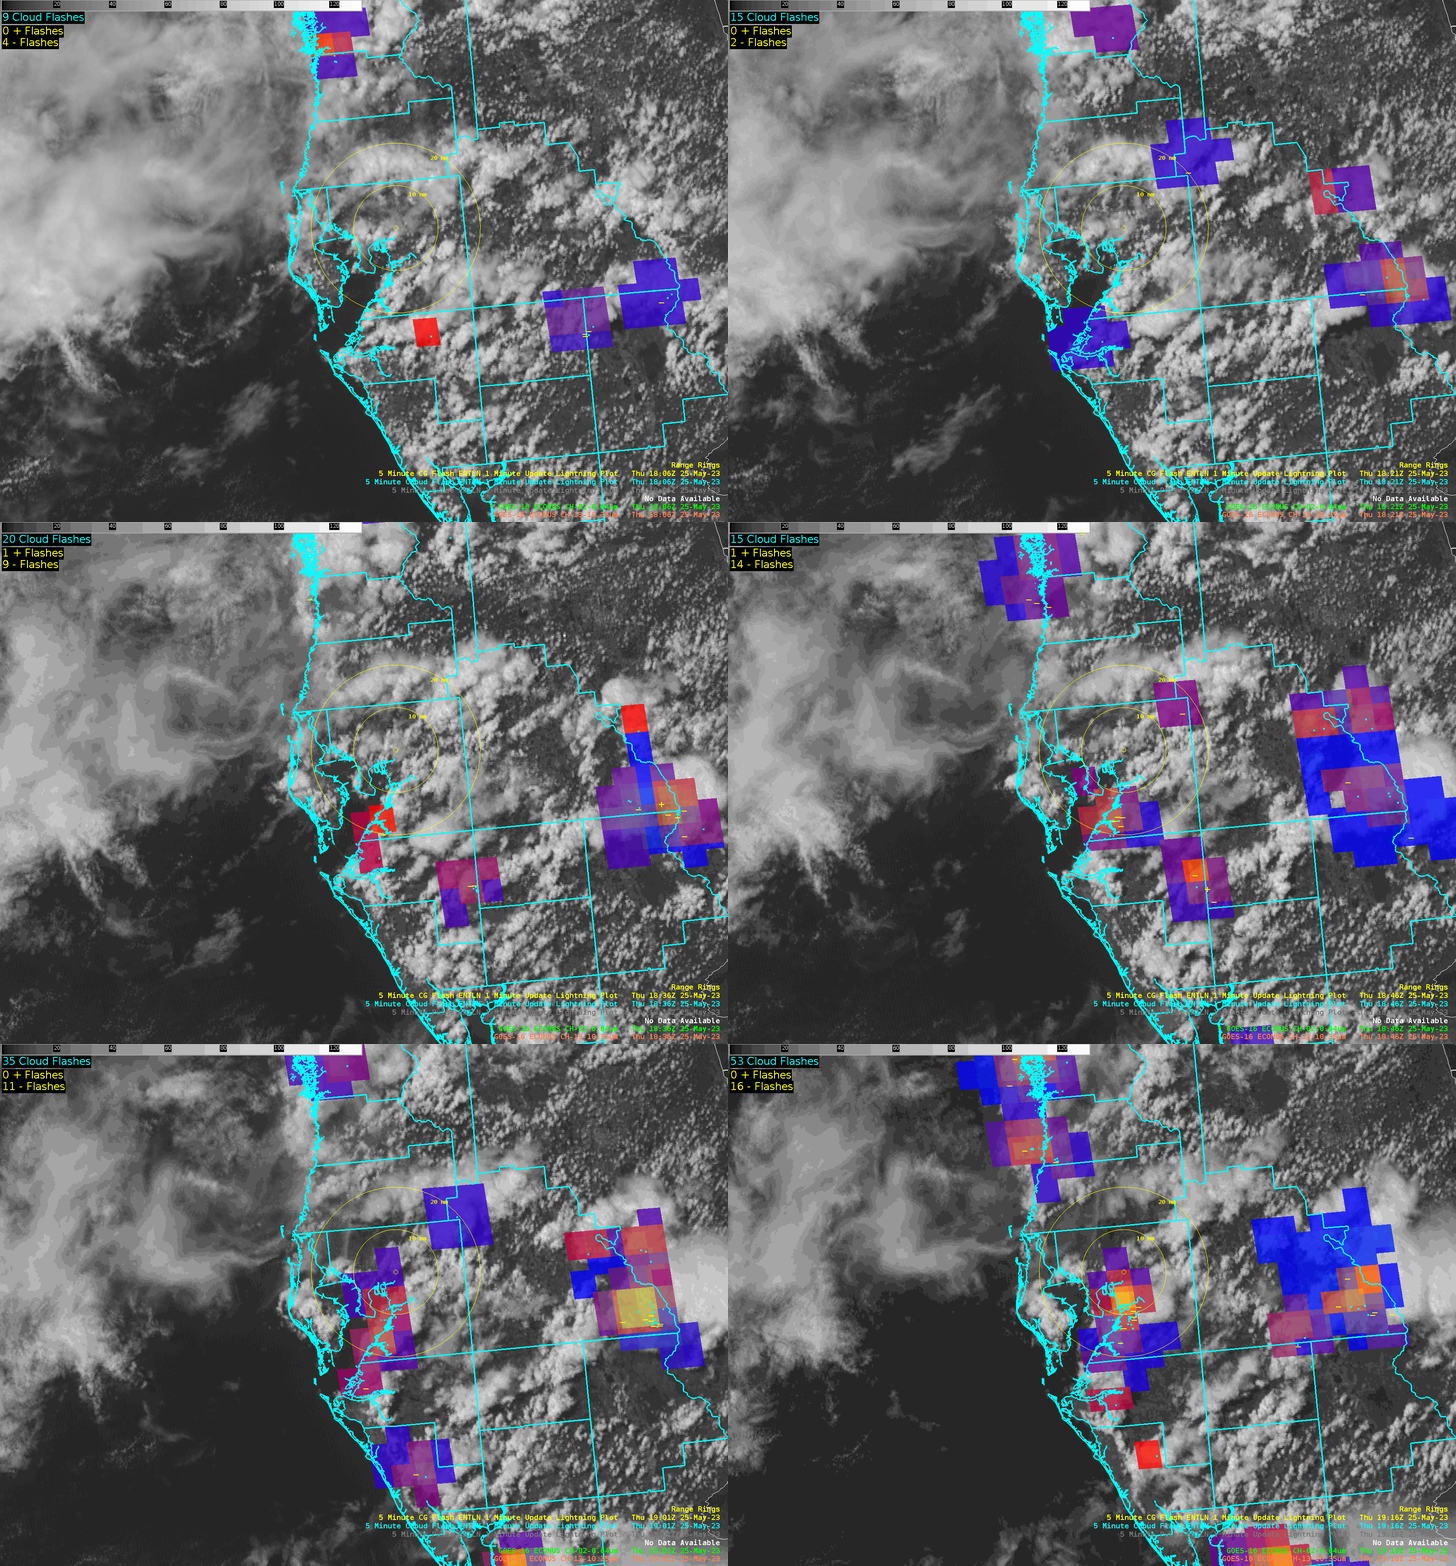
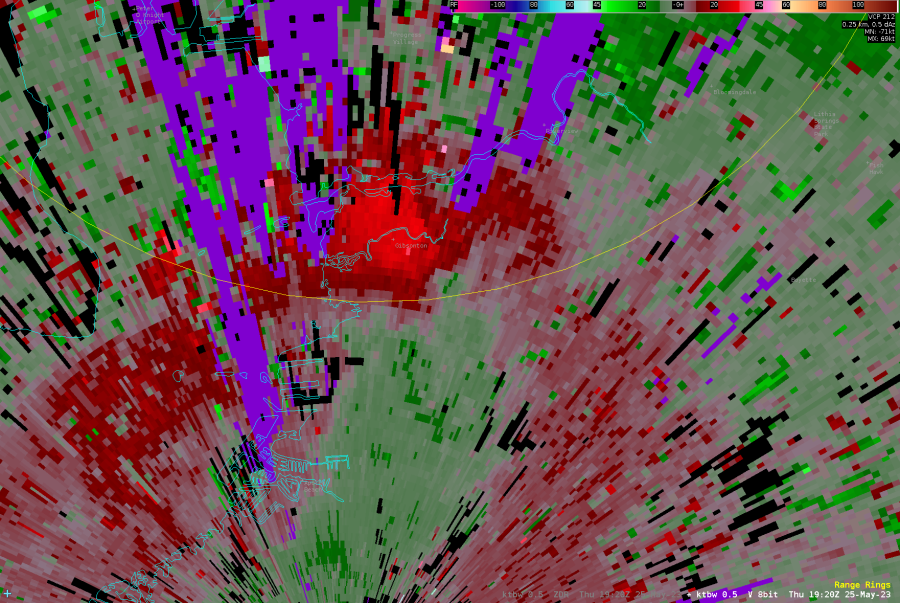
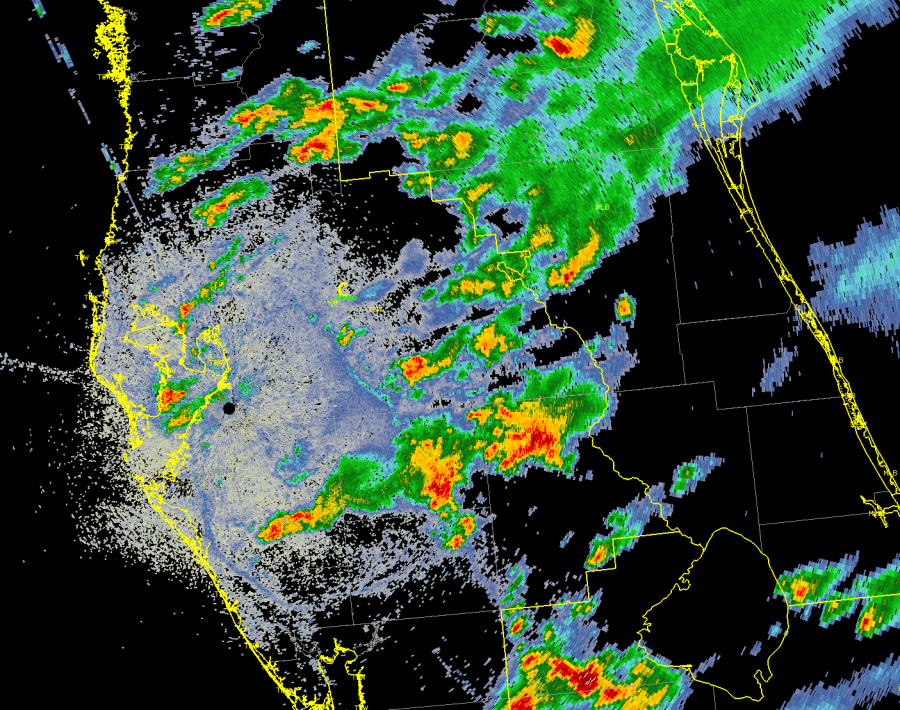
GLM RGB showed the progression of a developing storm near the TBW DSS site this afternoon. Not only was lightning a threat communicated to the DSS site, but KTBW radar depicted a downburst signature as shown below, which prompted us to issue an SPS for wind to around 40 mph, frequent lightning, and heavy rain.  track a developing storm near the Florida State Fair

-Joaq

Tags: None

LightningCast Gives Advance Notice for DSS Event

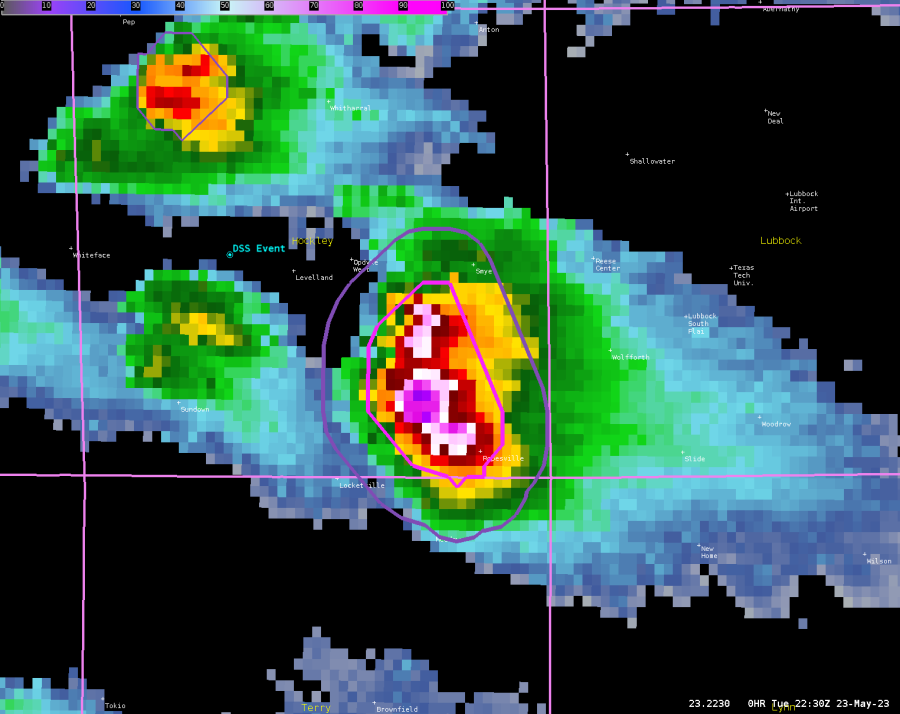
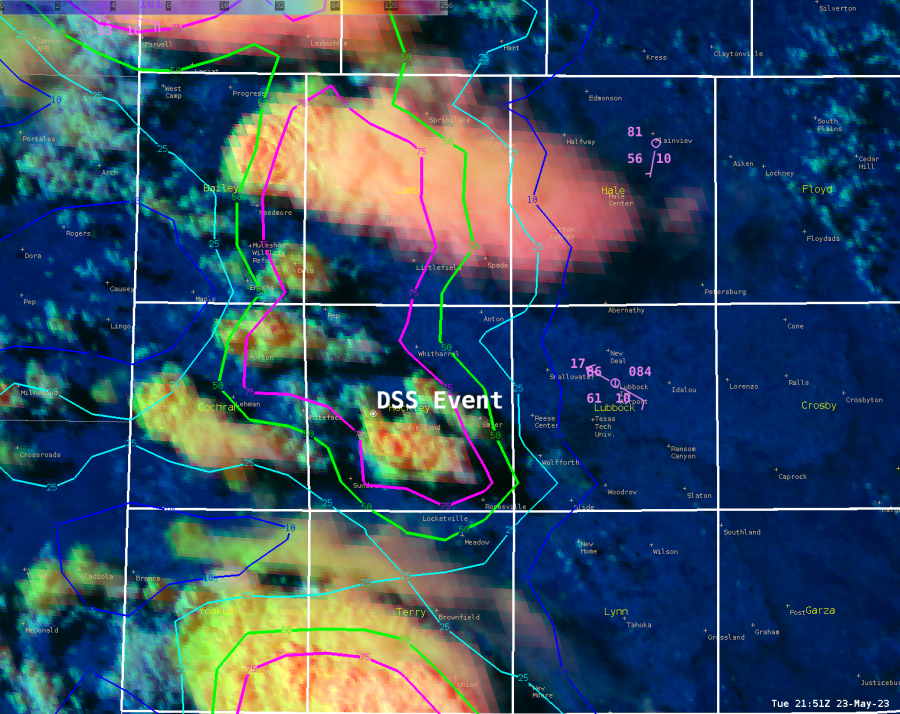
Lightning Cast (parallax corrected) had a 75% contour for lightning within the next hour (screenshot taken at 21:51Z) for our railroad DSS event. Notified the DSS event about the high lightning potential within the next hour. Went back to look at radar and lightning data for 22:50 to 22:54Z and there were CG and CC strikes just north of the Railroad DSS event in Levelland, TX. This allowed us to give them an hour to make any ground preparations regarding personnel.

-Dwight Schrute

Tags: None

Challenge With A DSS Event With Scattered Thunderstorm Development…focus on LightningCast.

Sea Breeze and outflow boundaries in place over the Florida Peninsula made for a tricky forecast during the afternoon hours, as thunderstorms could and would quickly develop just about anywhere along that boundary. Lightning up to this point by far was the main threat from these storms…as most storms were not strong long enough to cause notable hail to be a concern, but with storms having the potential to “die off” quickly as well, wind was more of a concern.

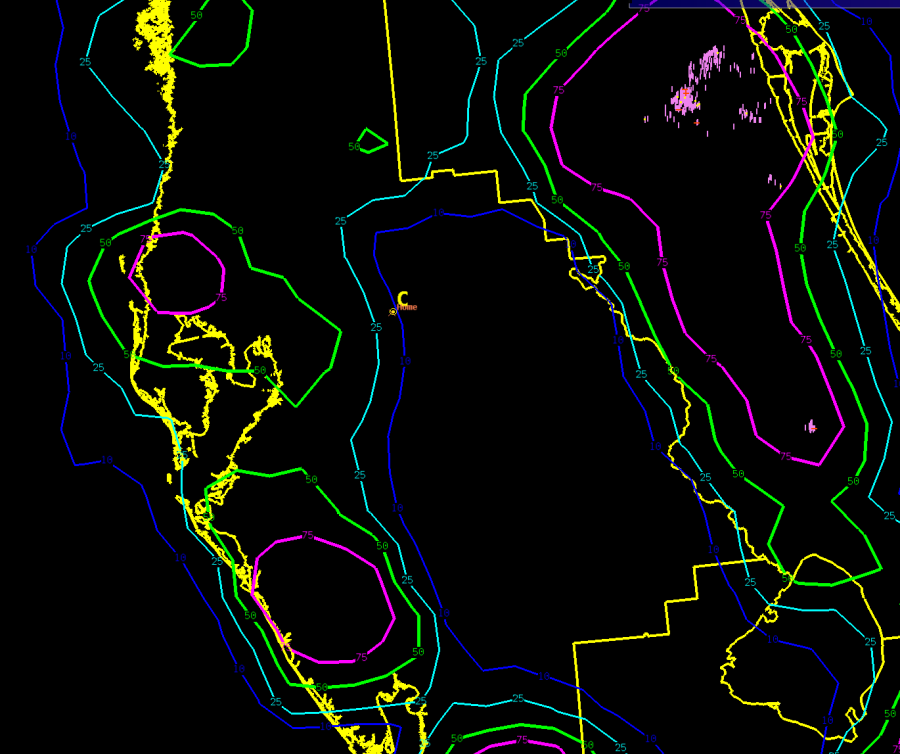
With the initial onset of early afternoon activity, providing DSS support and giving the local contact more detailed information was on the ‘easier’ side. LightningCast around 19Z was showing increasing probability contours of lightning within 60 mins at the DSS site (image below was at 1901Z. The DSS event is noted by the yellow “C”.

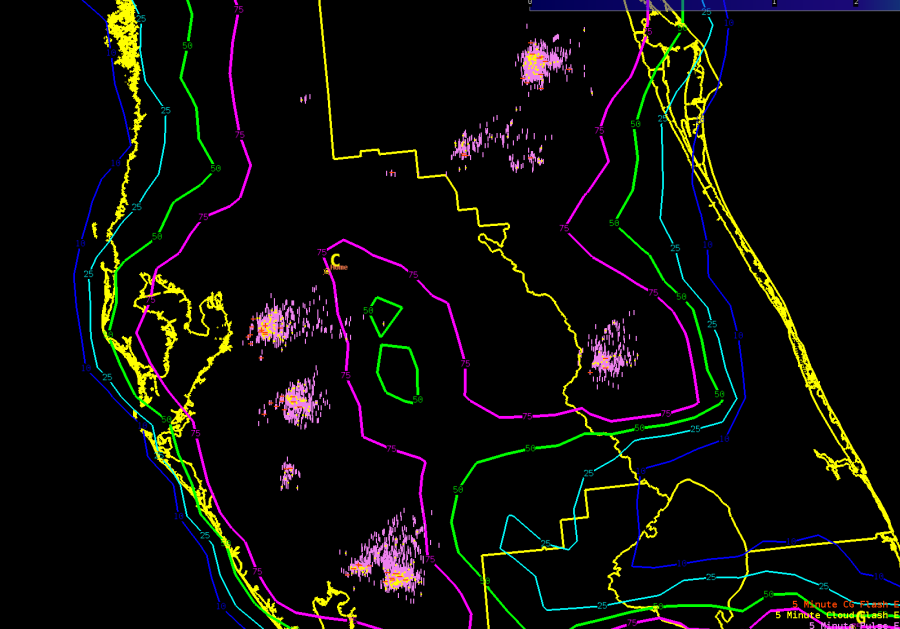
By around 2035Z, activity had increased in coverage and drifted northeast, closer to the DSS event, shown below by the increased coverage of ENTLN lightning plots and the 75% probability contour in the area.

The challenge since then is that more scattered/widespread activity has developed (and died off), in what seems at times to be in fairly random areas…but are for the most part tied to the moving outflow boundaries from previous storms (seen in radar image below at 2203Z).

Not surprisingly, as a result of all of this activity, LightningCast over this entire area has been remaining mostly around-above 50%, with many spots at/above 75%.

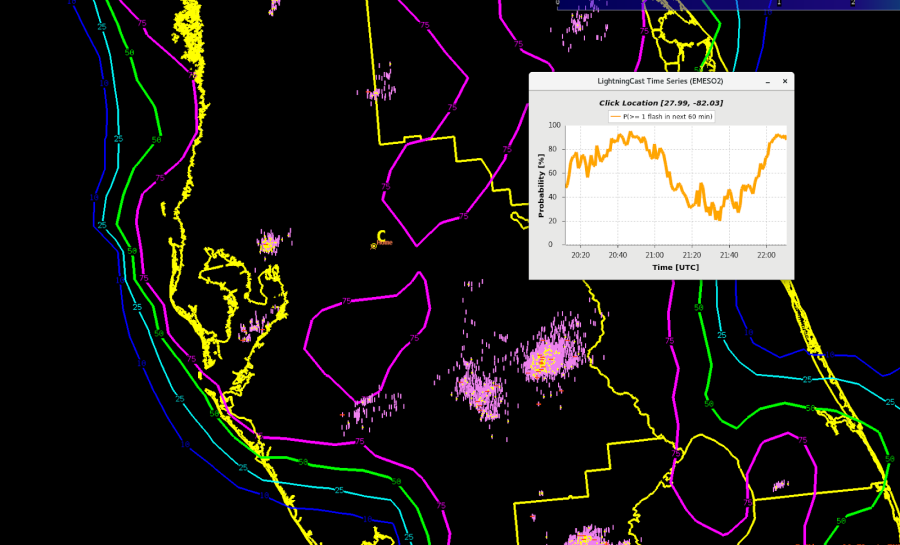
The challenge is what is the best way to convey this information to the DSS point of contact? Below is an image showing the LightningCast probability contours at 2212Z, along with the LightningCast Time Series for the DSS site (noted with the yellow “C”).

There is an overall lull roughly between 2110Z-2150Z (probability is closer to/lower to 50%)…but it never drops below 20%.  

Personally, looking at this time series and given the environment/set up and evolution of storms so far, I would have a difficult time calling the DSS point of contact and saying the threat of lightning is low…as another storm could develop as soon as I hang up. You don’t want to totally shut an event down, or be constantly calling the point of contact with updates (unless you know the contact likes that much communication). I don’t claim to have the answers, just thinking out loud, but it’s something to think about if using this product to communicate with DDS contacts.

-Bubbles

Tags: None

Observations from BUF on Thursday June 16th

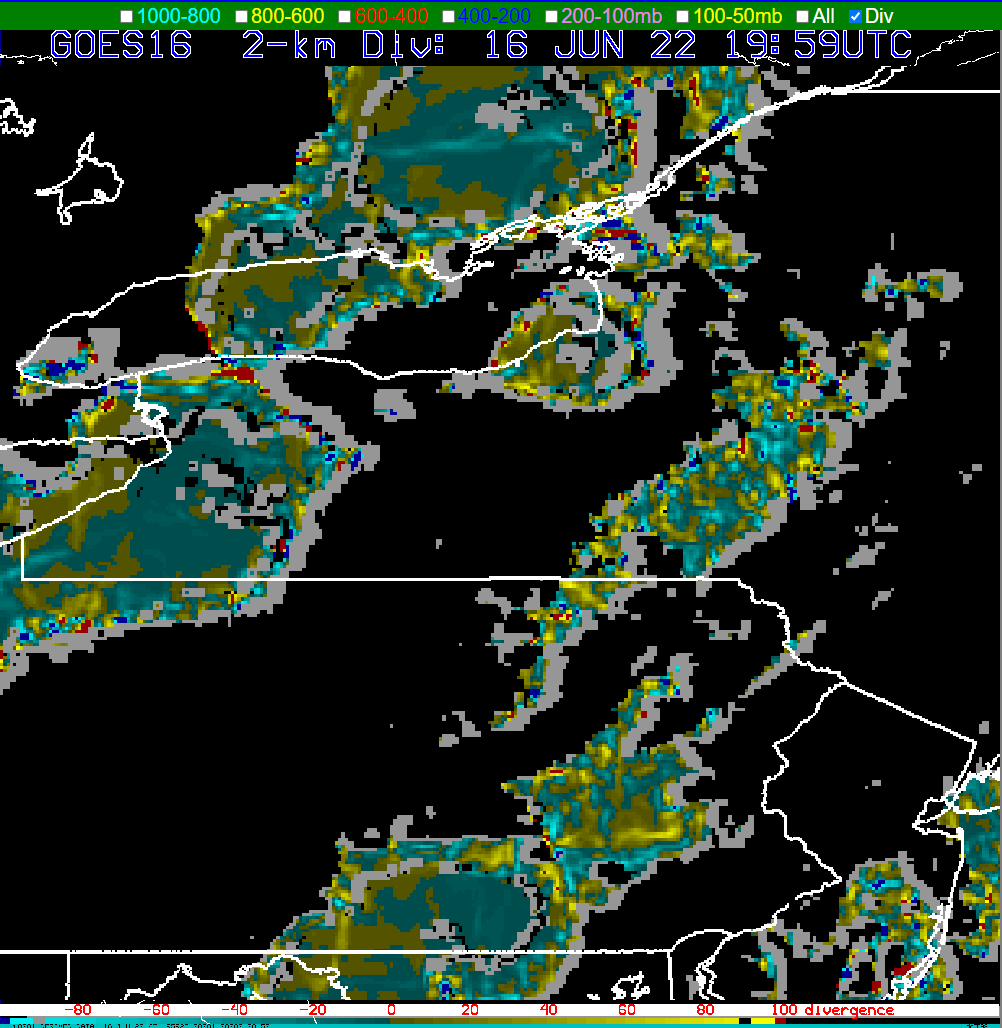
Optical Flow Wind Storm Top Divergence Can Aid in Warning Operations

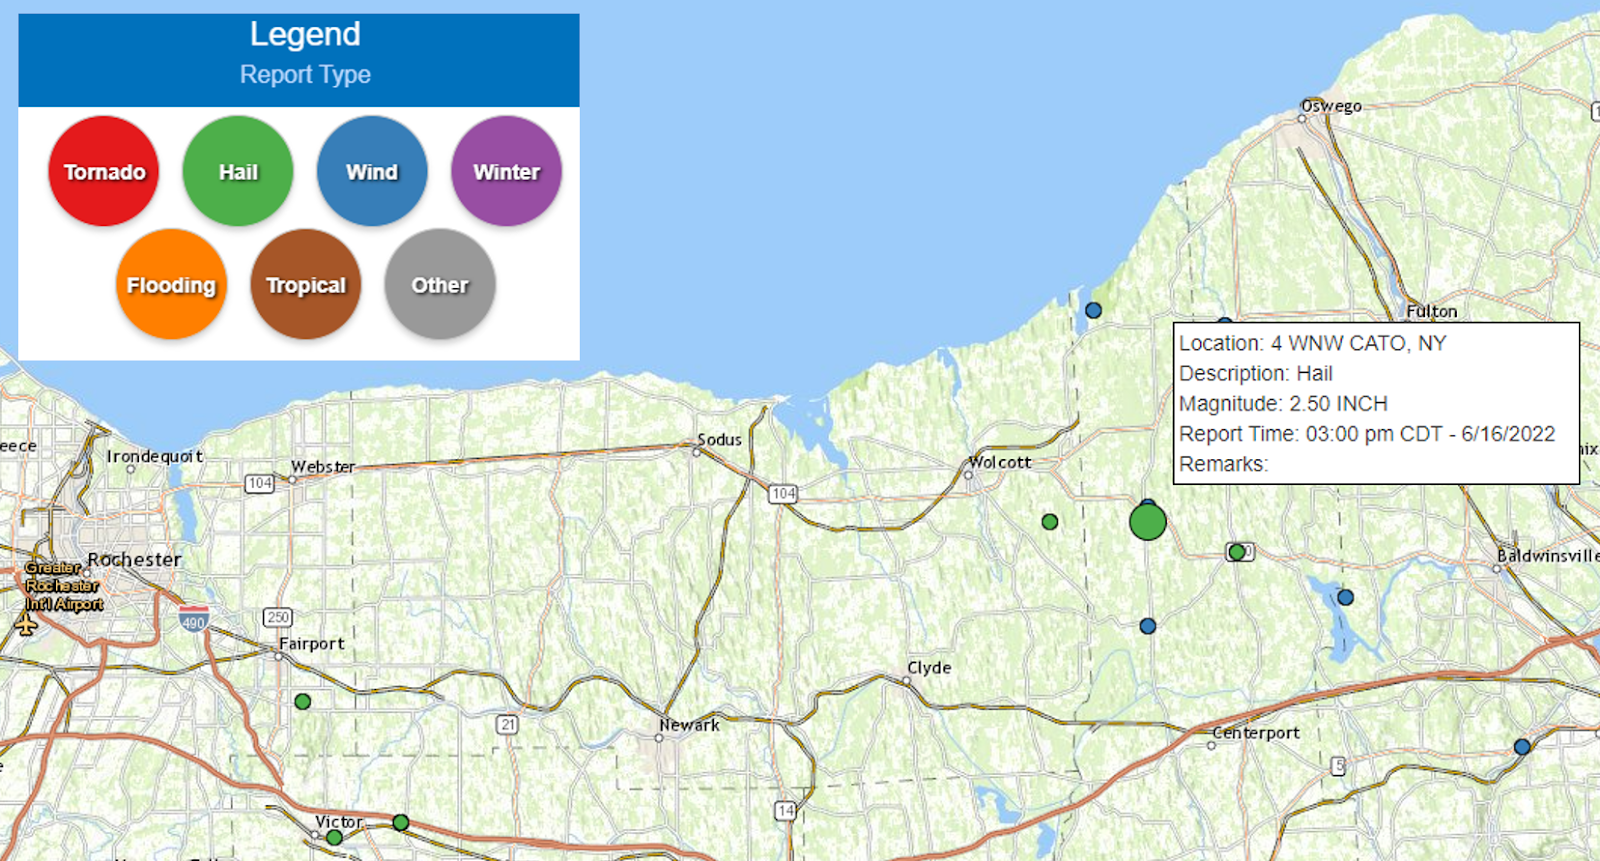
The storm of the day produced a 2.5” hail stone near Cato, NY.
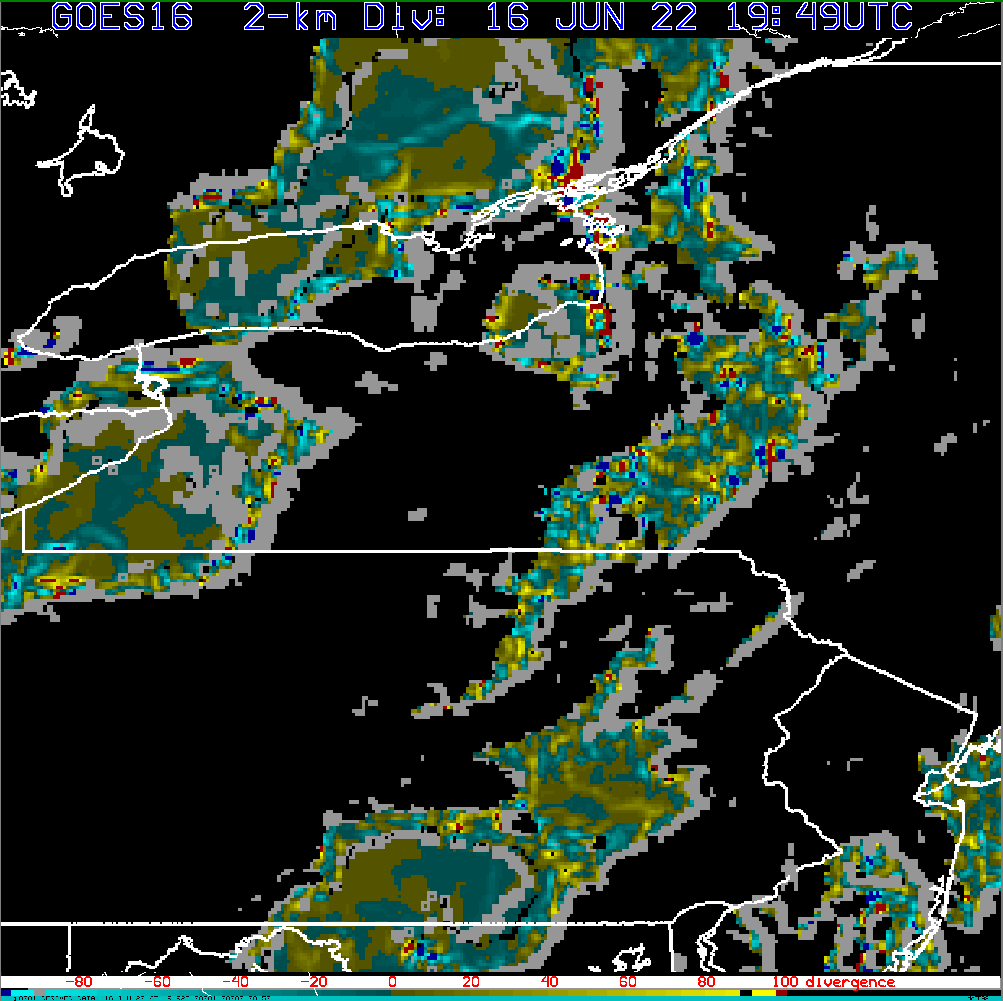
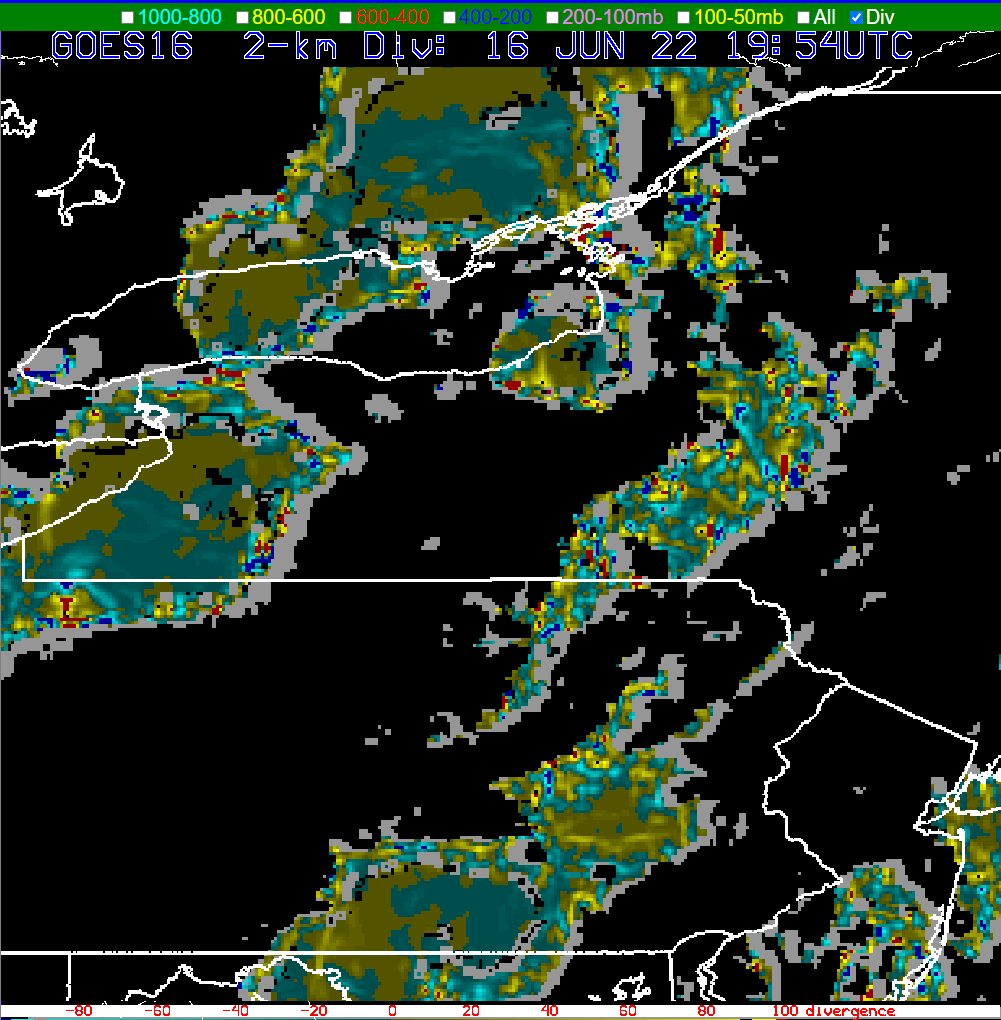
Strong storm top divergence signals an intense or intensifying thunderstorm. Matched with upper level radar scans, satellite interrogation (clean IR), and ProbSevere, optical flow wind products may be another tool to aid the warning forecaster and/or storm scale mesoanalysis,  Below are the corresponding optical flow wind storm top divergence images approaching 4 PM EDT (3 PM CDT) when the sig severe hail was reported. The thunderstorm of interest is centered just south of eastern Lake Ontario.

LightningCast as Graphical Messaging/IDSS Tool

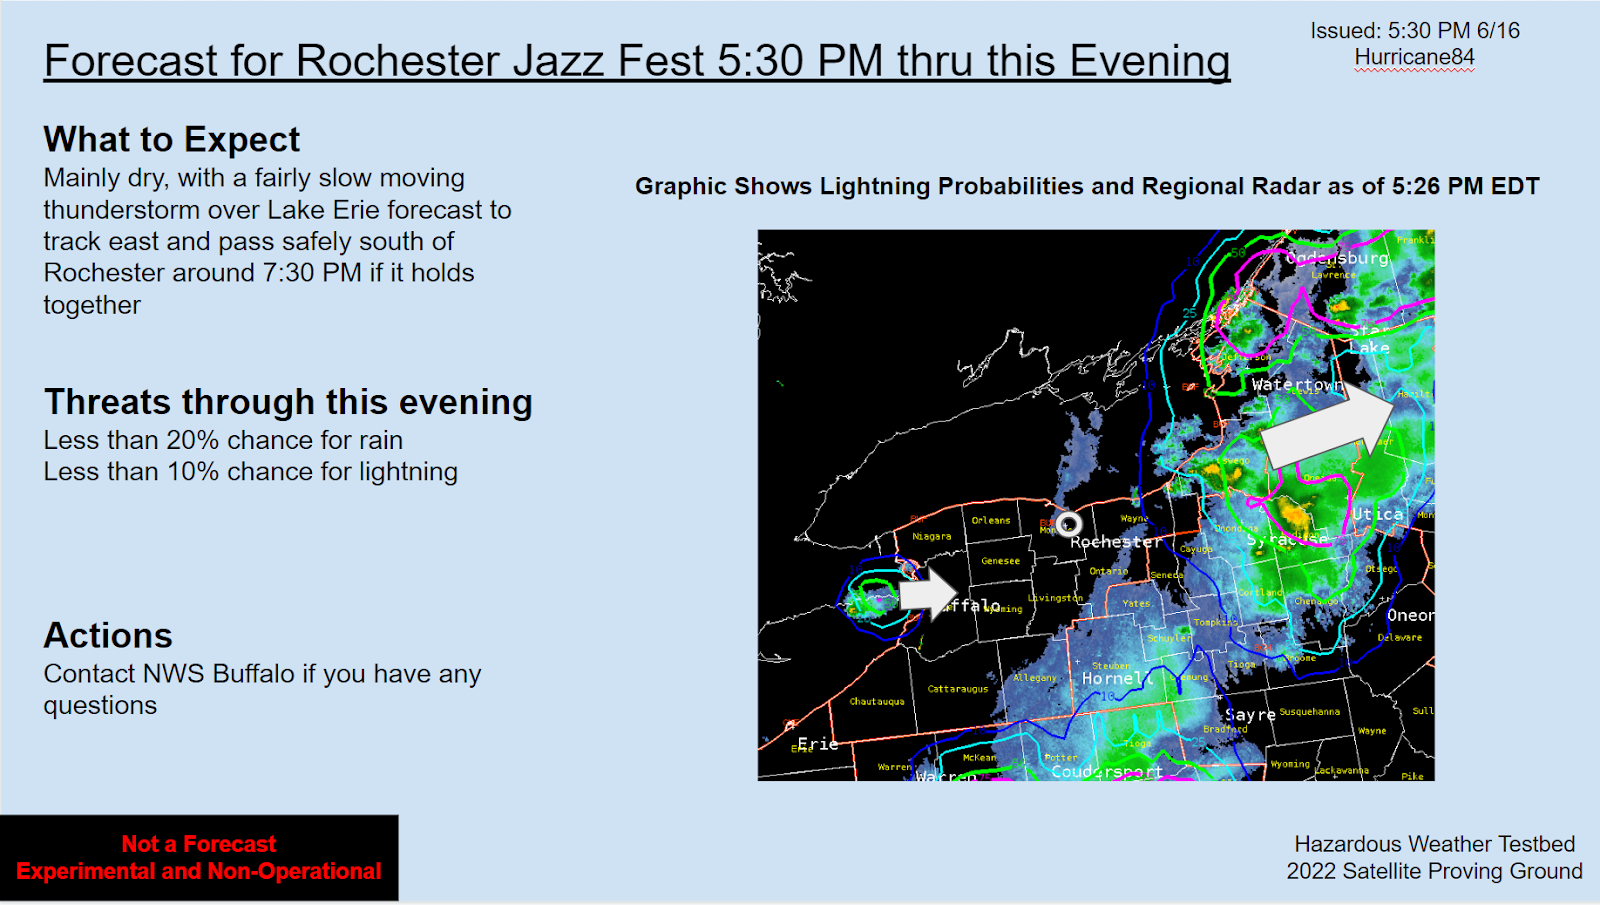
As the DSS and graphics person for BUF, I took the opportunity to highlight the utility of LightningCast for Graphical NowCasts and DSS graphics. The fairly broad brushed nature of the lightning probability contours at the timesteps utilized for graphics I think is a positive for a few reasons: they show actionable probabilities (10+, 25+, 50+, 75+) that users can understand; the contours are akin to annotations on a radar graphic, so would be a time saver; and finally, broad brushed is a way to prompt users and partners to seek out more information, like real time zoomed in radar data, perhaps calling or sending us a chat on NWSChat, or even simply keeping an eye on the sky and listening for thunder. The parallax corrected product in the images below I feel would be more useful for graphics of the nature shown below. Ultimately, for operational use, there would probably need to be some work done to ensure they are not confusing to the user and aesthetically pleasing.
Graphical NowCasts for our websites and social media
Graphic for IDSS Event

A Case for the Sharpened GLM FED Color Scale Used this Week

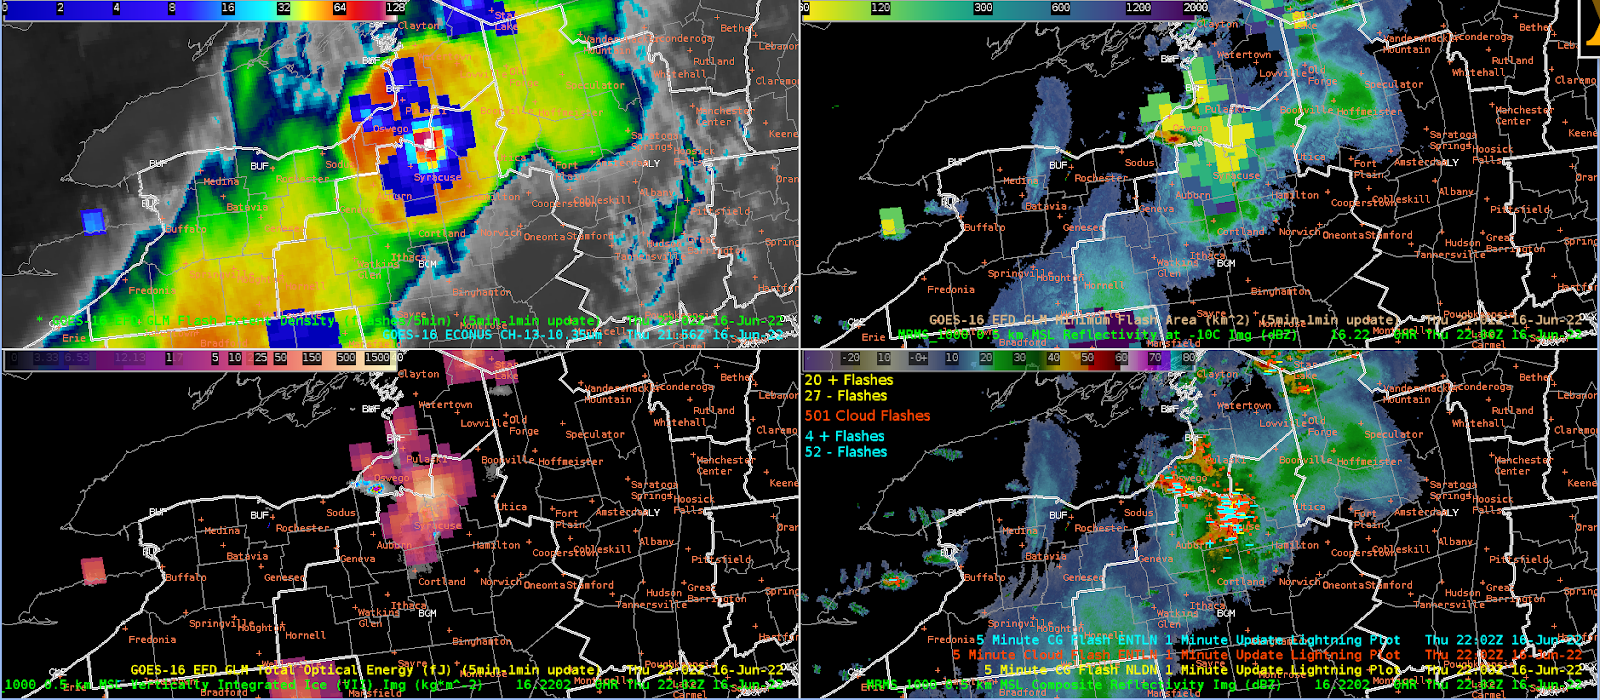
Over the course of satellite product interrogation this week, the GLM FED stood out as one of the most useful products.  Below are examples from in/near the BUF CWA at 2043z and 2047z. Note that the top of the color scale was set to 128 flashes/5 min over the grid point vs. the default 256 flashes/5 min in AWIPS. The FED also paired well with the MFA and TOE on this 4-pane procedure.
The color curve used this week really popped and correlated well with frequent ENTLN detections. Another example below from shortly after 6 PM EDT (2202 and 2207z)  shows that there will be instances where perhaps an even small color bar range would be useful.
While the strongest storm at this time still showed up well on the AWIPS default color bar range, the 128 flashes/5 min top end of the range (top right) helped it pop even more and corresponded well conceptually with the ENTLN cloud flash detections. Furthermore, the thunderstorms to the north of the strongest thunderstorm showed up better from an SA perspective, if you have been focusing on the strongest storm for warning ops. The smallest color bar range on the bottom left further enhances the above described effect.

Addendum: GLM Flashes and a more smoothed FED

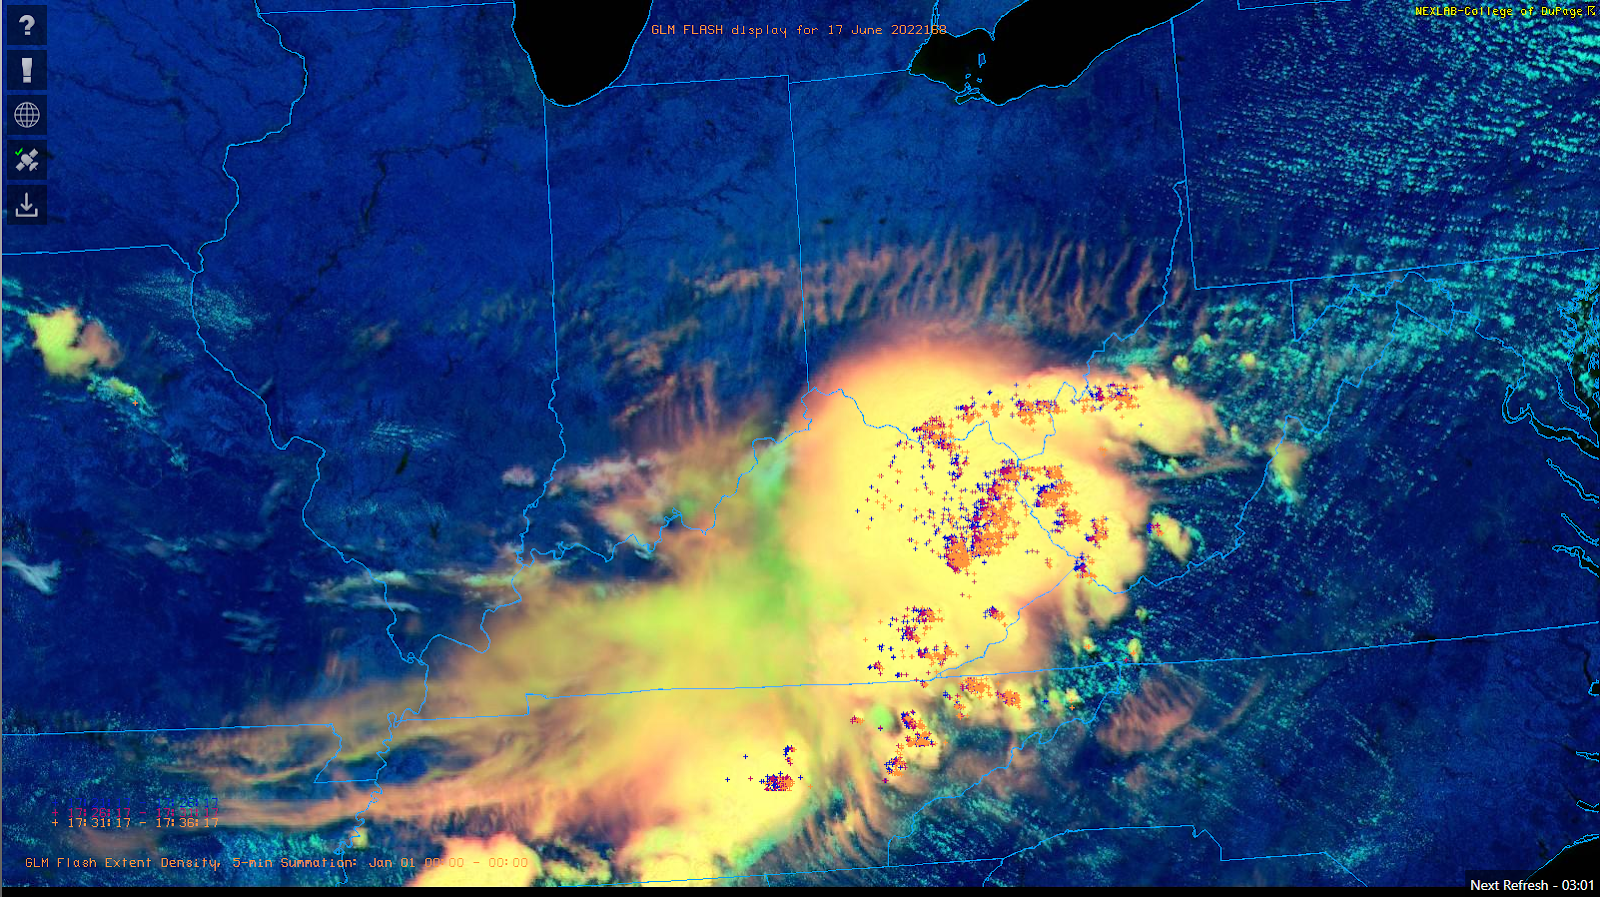
The excellent COD NexLab Satellite and Radar page added within the past year the GLM flash centroids to their GOES derived overlays. From an apples to apples perspective with respect to the ground based lightning detection network displays, this may be a useful product to add into AWIPS.
\

Addendum 2: Would a more smoothed FED be preferable?

Below are a few web based examples of FED displays.
A case can be made that these smoothed FED examples would be somewhat less obtrusive than the default AWIPS FED display, especially for storm scale interrogation by the warning operator or storm scale mesoanalyst.
– Hurricane84

GLM Parallax and Lightning Cast Fun

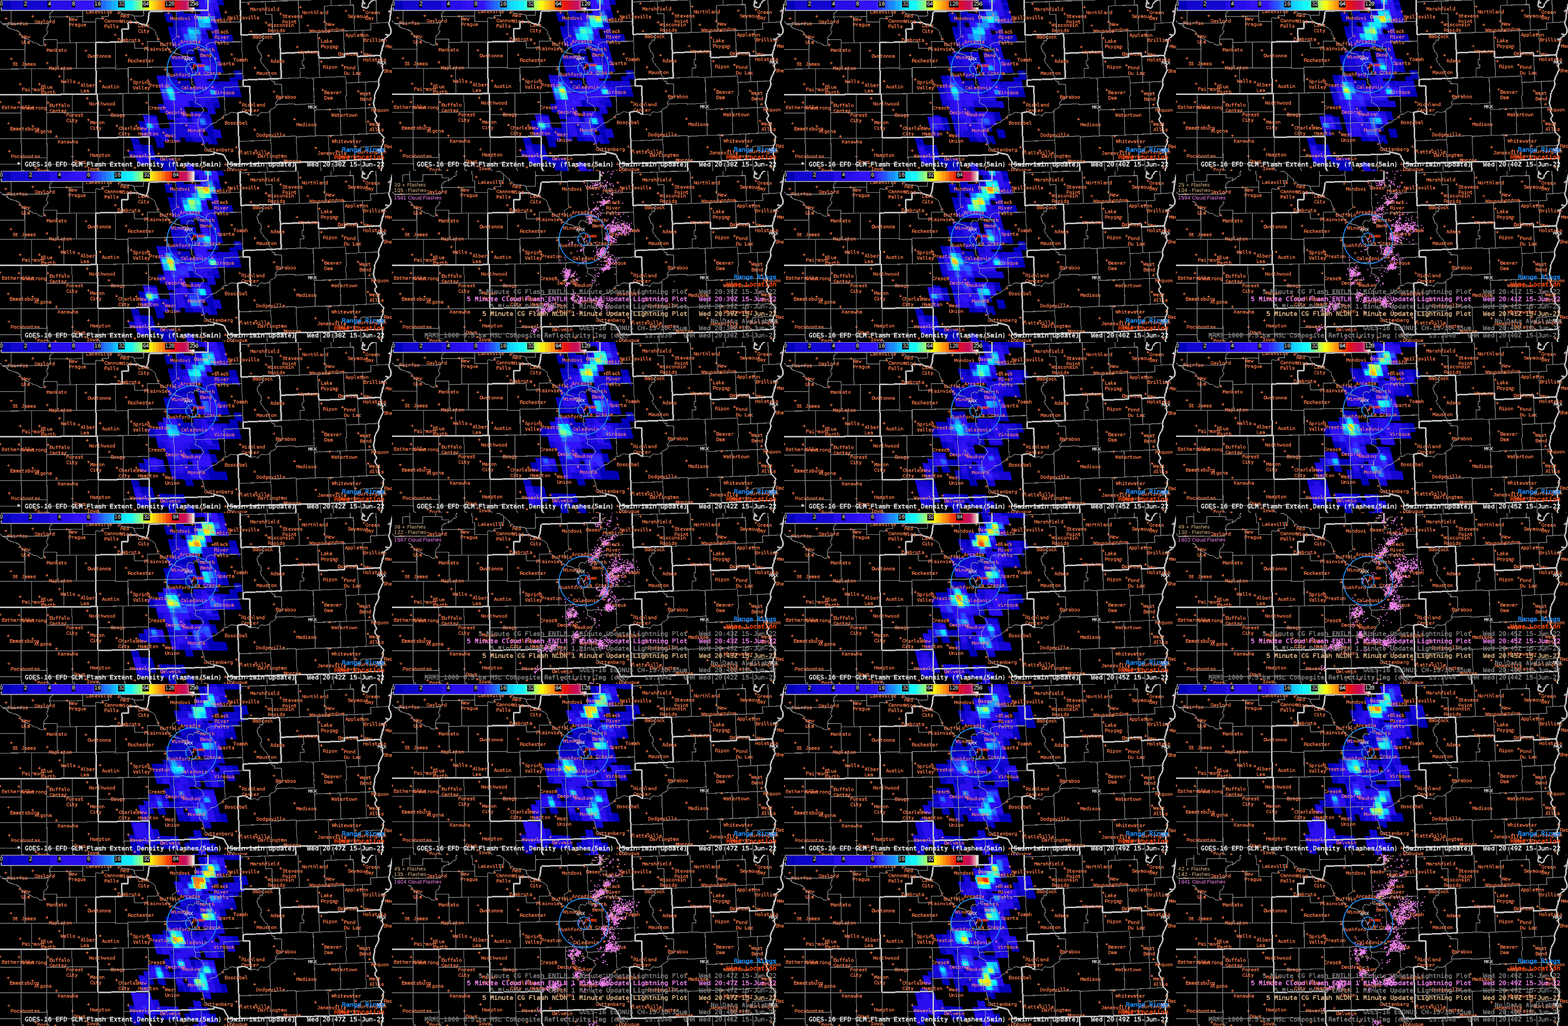
The GLM data, specifically the FED data, was used to provide DSS to the Riverfest in La Crosse, WI.  After my first contact with the event POC, I noticed that the FED data was off by roughly a county from the ground-based lightning data.  This was my first time witnessing the parallax issue from the GLM and why ground-based lightning networks are a key component in confirming that the GLM location is accurate. In Figure 1, notice the intense concentration of the lightning just southwest of the event (20 mile and 5 mile radius rings) depicted by the GLM while the ENTLN/NLDN say that concentration is about a county south.   The parallax is evident in other lightning concentrations in and around the event circle.  I know it’s something being worked on to have the GLM data corrected to avoid this parallax issue, but it would be nice to have a map of the locations where the parallax is more evident in case you may not need the corrected version. Obviously, the further north, the larger the parallax, but not quite sure at what latitudes it really starts to show its hand. On a side note, for aviation purposes, the parallax could become problematic if the GLM lightning data is off by a factor of a county or two, especially if re-routing aircraft is occurring.

Figure 1: GLM Flash Extent Density compared with ENTLN data on June 15, 2022.

Figure 2: FED and ENTLN animation showing the GLM parallax.

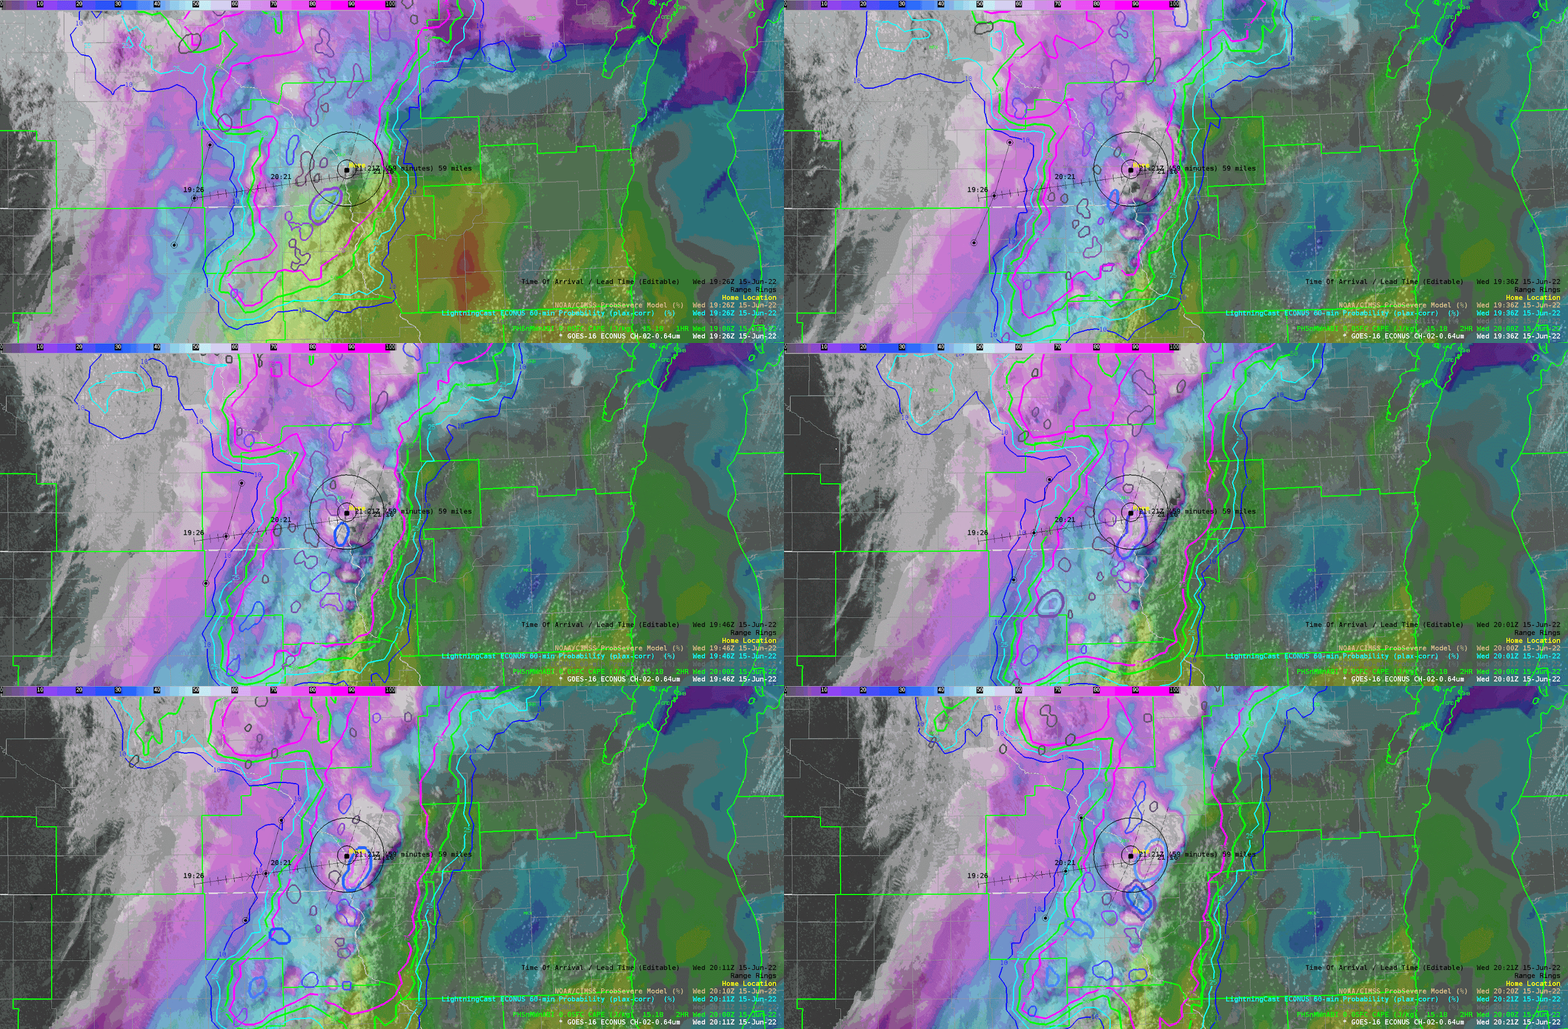
I utilized the Lightning Cast to provide a probable end time of the lightning threat for the Riverfest event in La Crosse, WI.  This was a valuable tool as it provided some added confidence when the storms would exit the event area.  I did my best to line up the TOA tool with the 25 percentile contour. Once I got my estimated time that the end of the lightning threat would reach the event, then I added about 30 minutes to ensure it was well east of the event circle.

– PODIUM

Can PHS Improve Mesoanalysis and Near Term Convective Forecasts?

A large portion of the MKX CWA was included in a MDT severe risk, so by the start of the operational period, we had to assess the evolving severe threat spreading in from the west. Meanwhile, our DSS event was the Madison Jazz Festival, which entailed a focus specifically on south central Wisconsin. The PHS CAPE forecast appeared to be a noteworthy improvement from the CAPE fields on the SPC Mesoanalysis, along with the short-term forecast on that page.

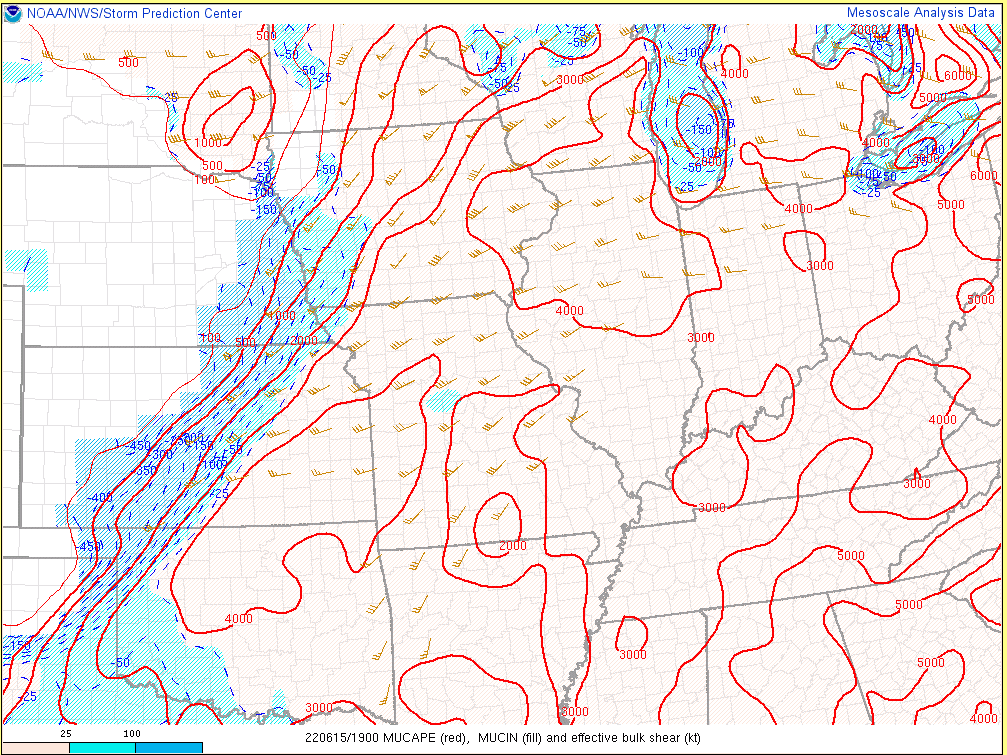
Below are the 18z through 20z plots of MUCAPE, MUCIN and effective bulk shear from the SPC Mesoanalysis page.

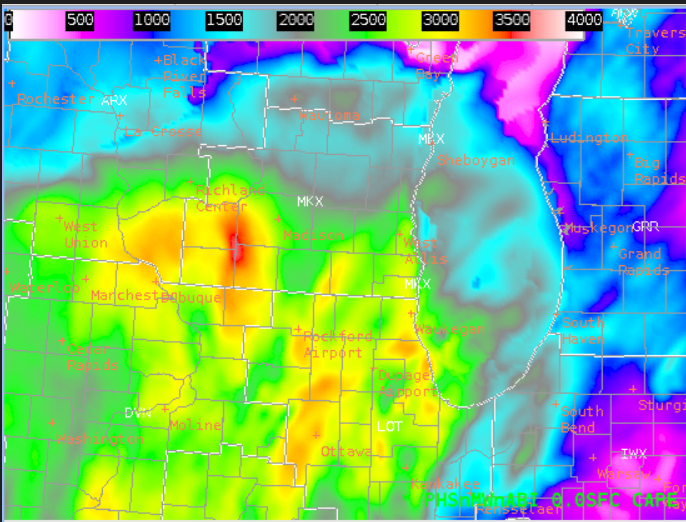
Compare the above images with 4000 J/kg of uncapped MUCAPE to the PHS MUCAPE initialization at 18z and 2-hour forecasts (19z and 20z) below.

As you can see, while the SPC mesoanalysis was indicating 4,000 J/kg of uncapped MUCAPE, the PHS forecast showed CAPE decreasing across central and south central Wisconsin. This was an important and helpful piece of information for our DSS content for the Madison Jazz Festival.

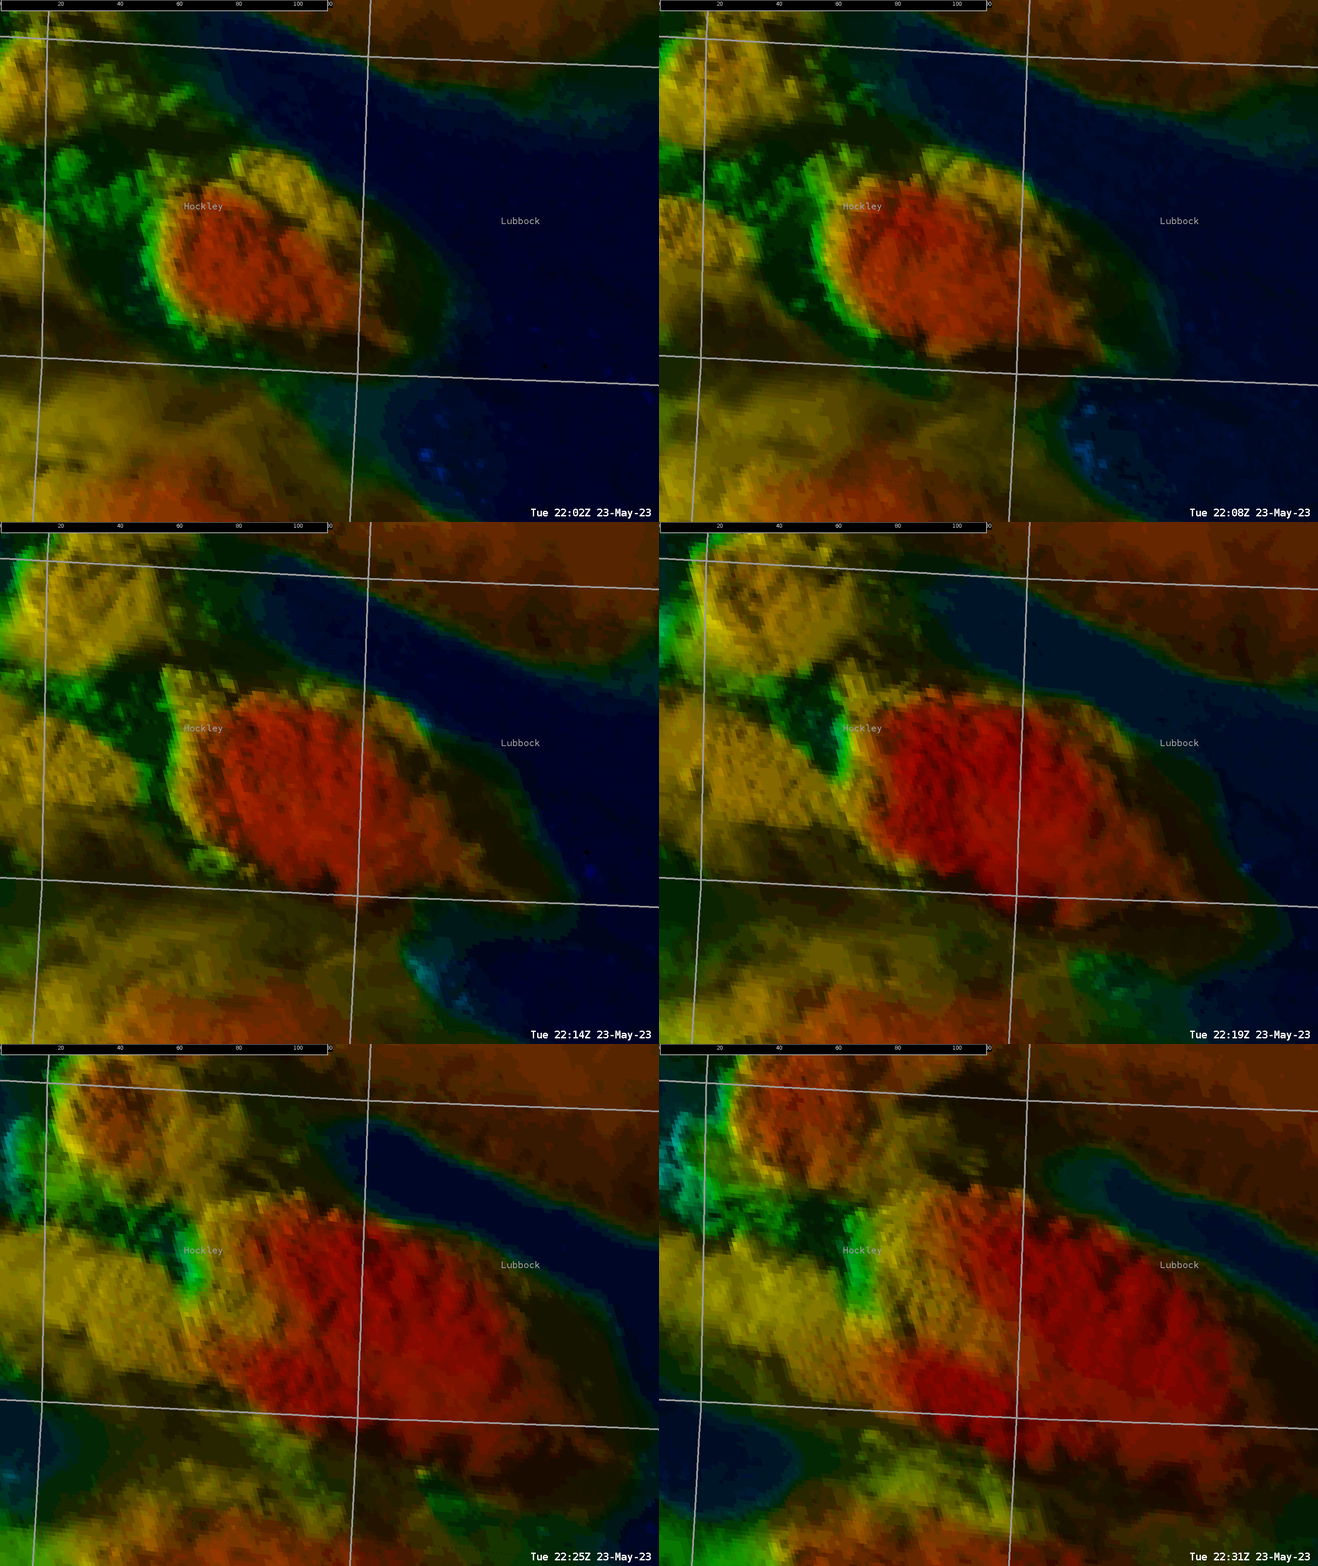
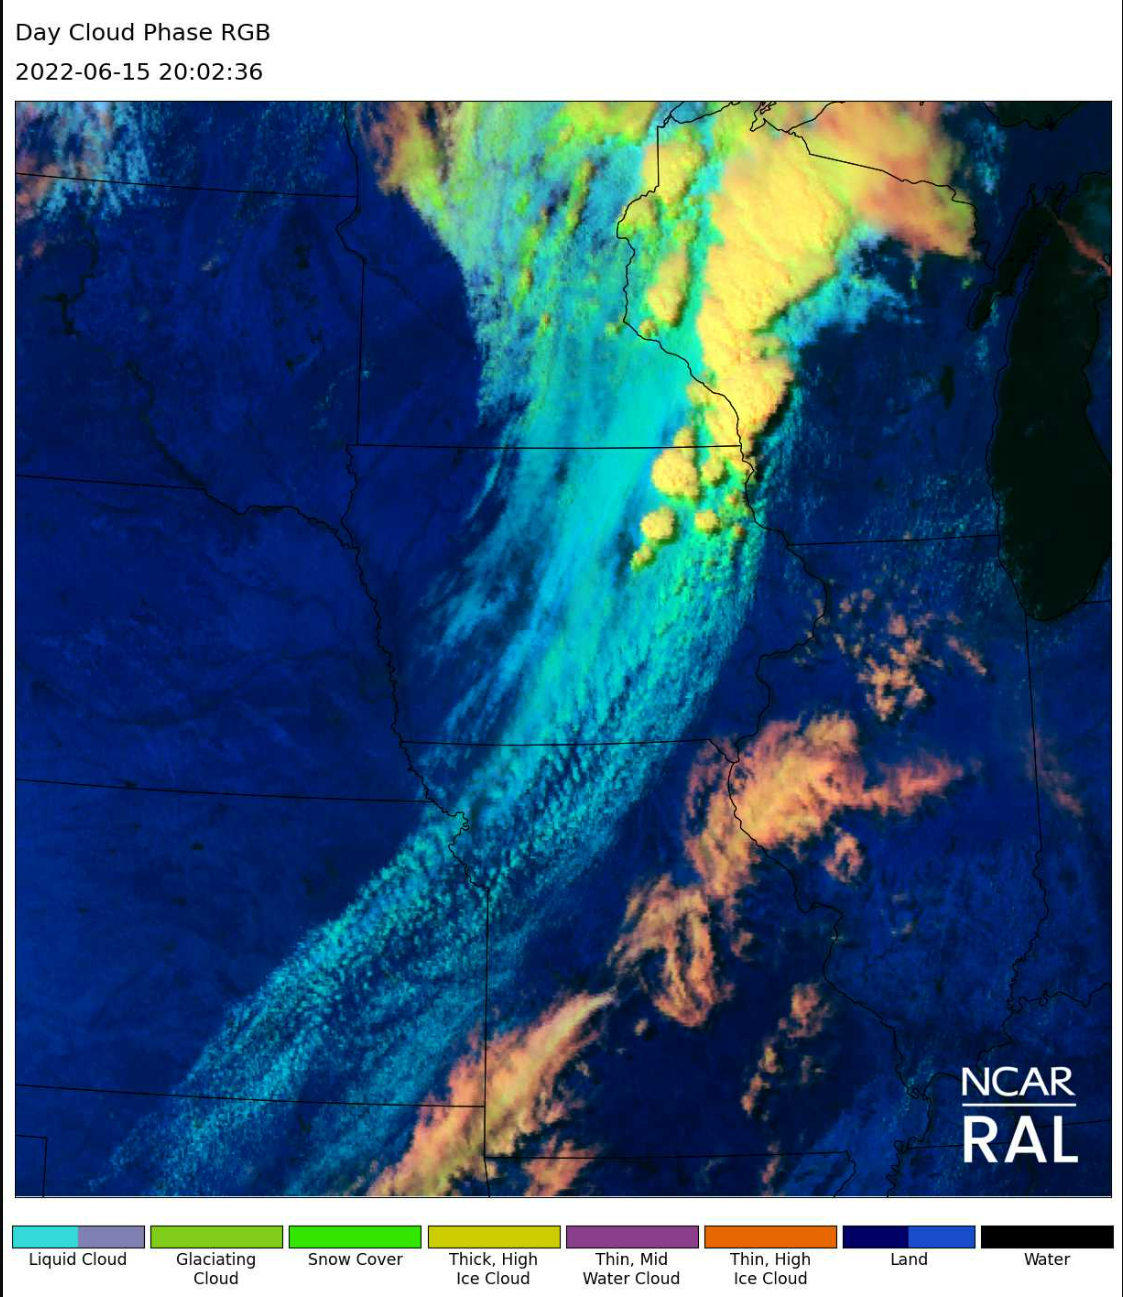
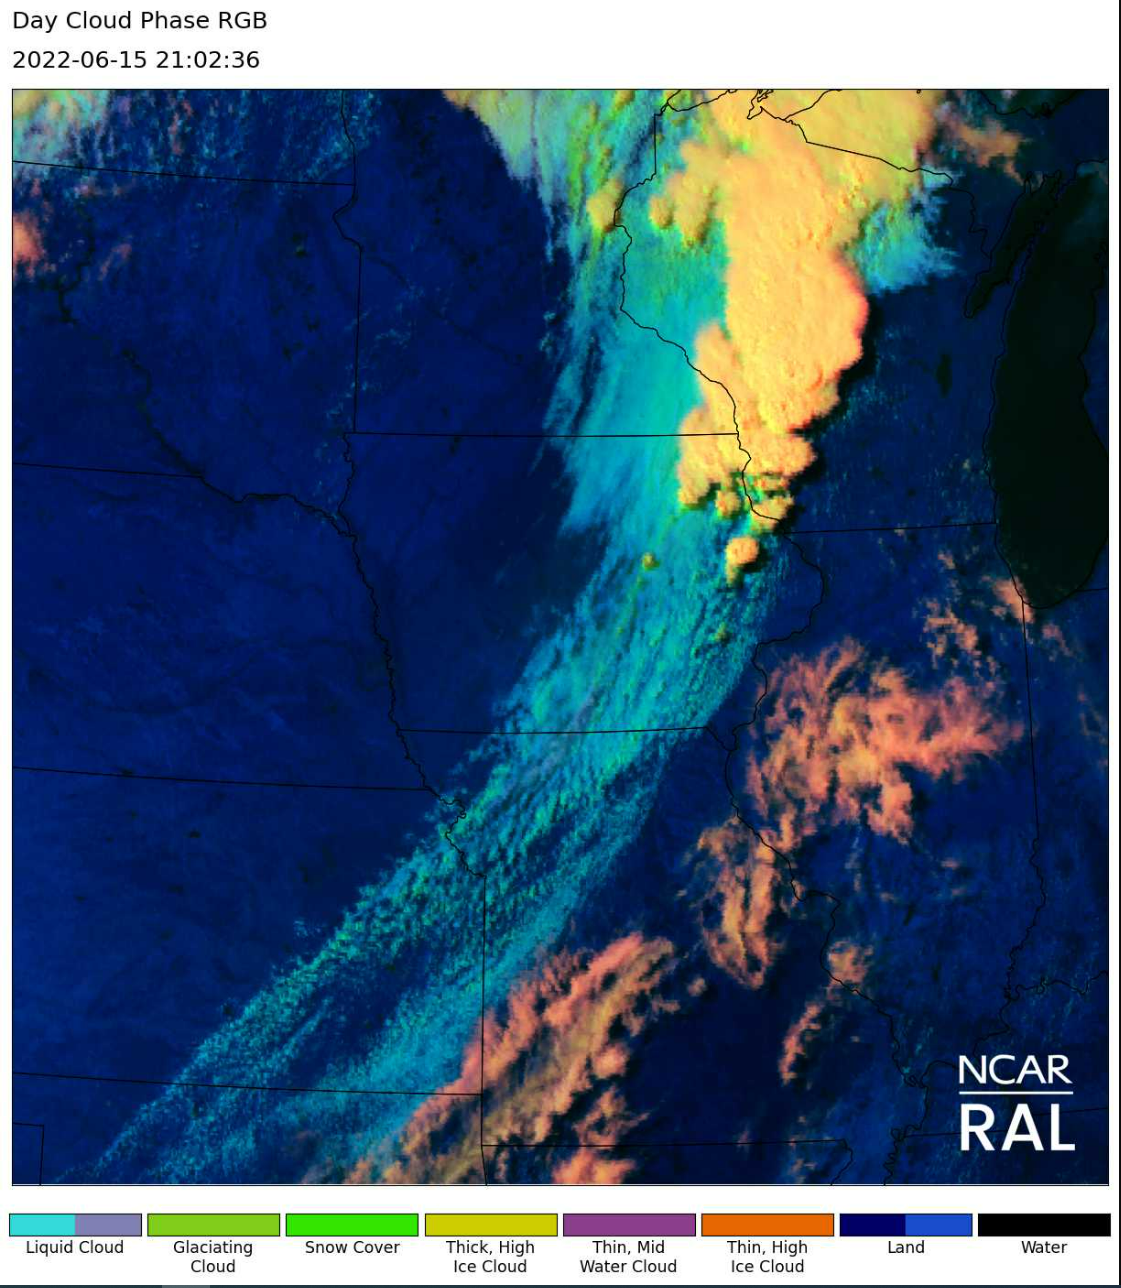
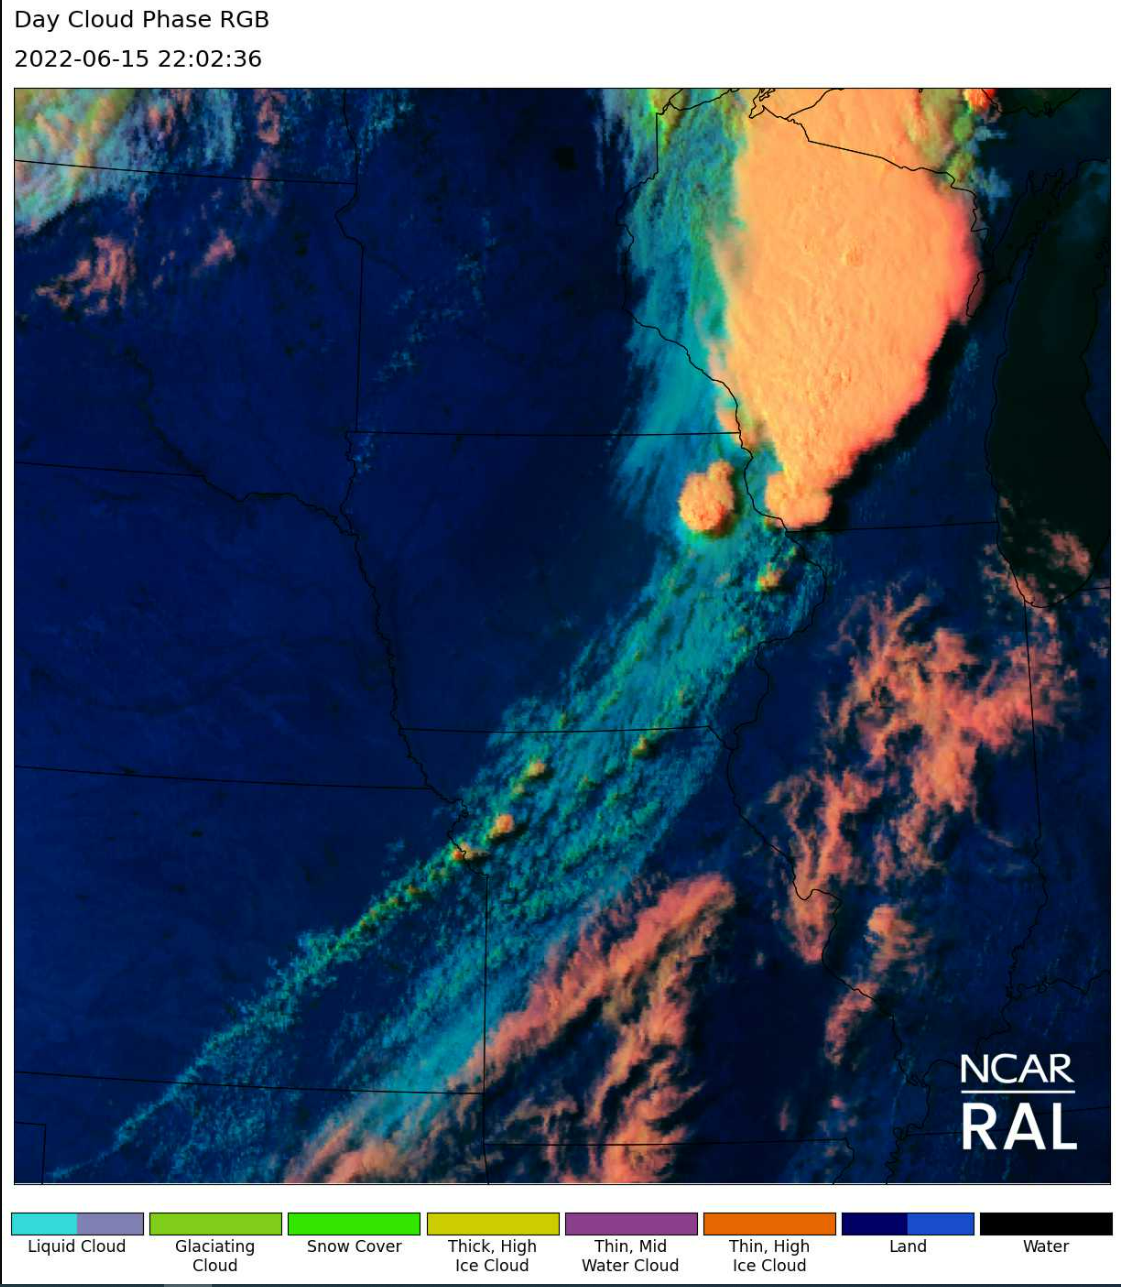
The Day Cloud Phase RGB images below back up the PHS forecast vs the SPC mesoanalysis, as relatively flat Cu field over our area of interest actually dissipated between 20z and 22z.

Based on the PHS forecast combined with satellite analysis, we were able to focus the convective threat for the Madison area toward 6PM and onward, tied to the stronger forcing and better moisture arriving from the west where the ongoing convection resided closer to the cold front. It appears that the PHS sampling of moisture in the column applied to the near-term forecast strongly outperformed the SPC/RAP Mesoanalysis model background and OA algorithm.

Differences between the LightningCast (LC) CONUS and LC Mesos

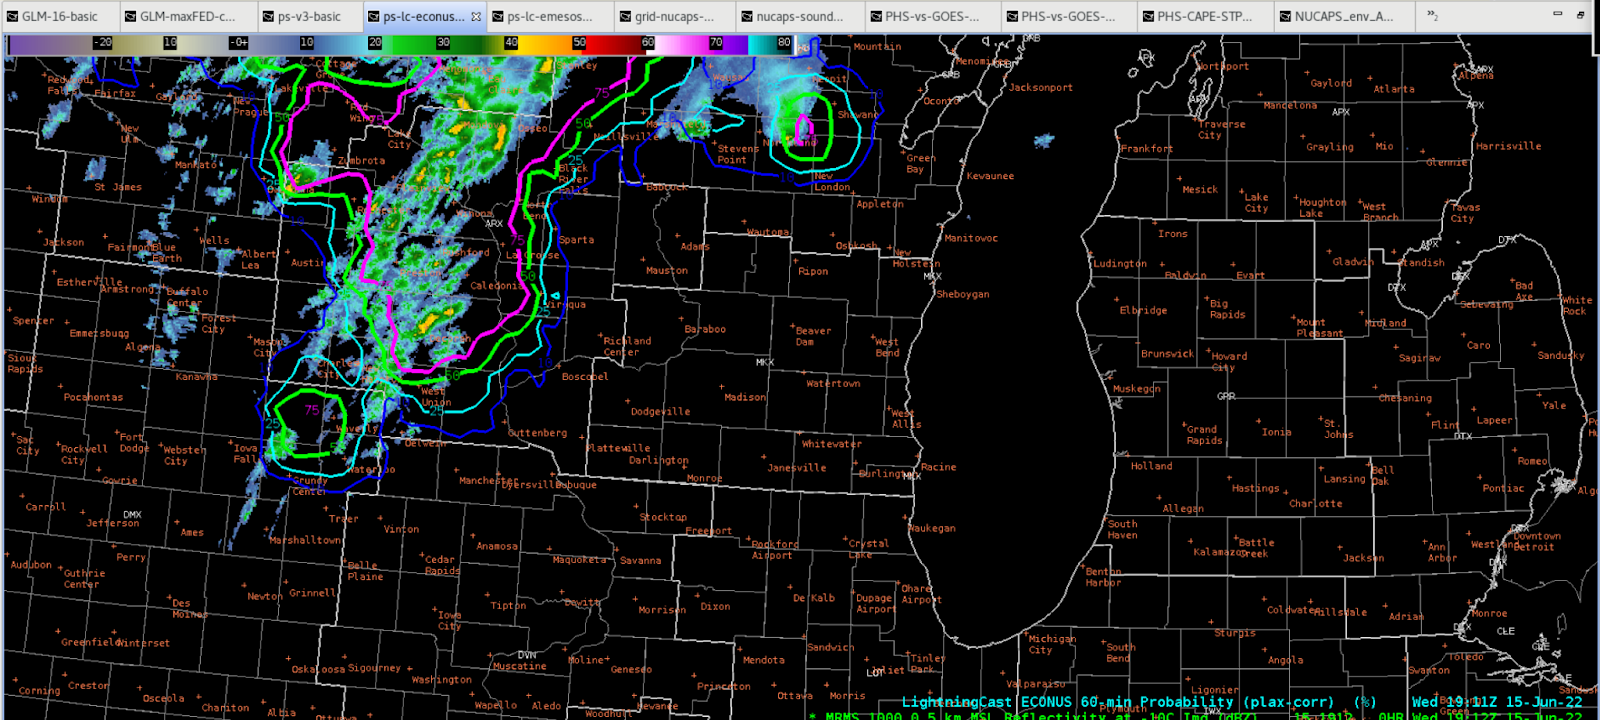
Note below the CONUS scale (1st image) and Mesos (Meso Sector 2 on 6/15) had a different depiction of the lightning probability over northeast Iowa at 1911z 22Jun15. This was due to the time for a CONUS GOES-East scan to complete, vs. the much shorter time for a Meso sector, which in turn affects the LightningCast model. This is something to keep in mind when using the product.

ProbSevereV3 Trends for Severe Convection in Western/Southwestern Wisconsin

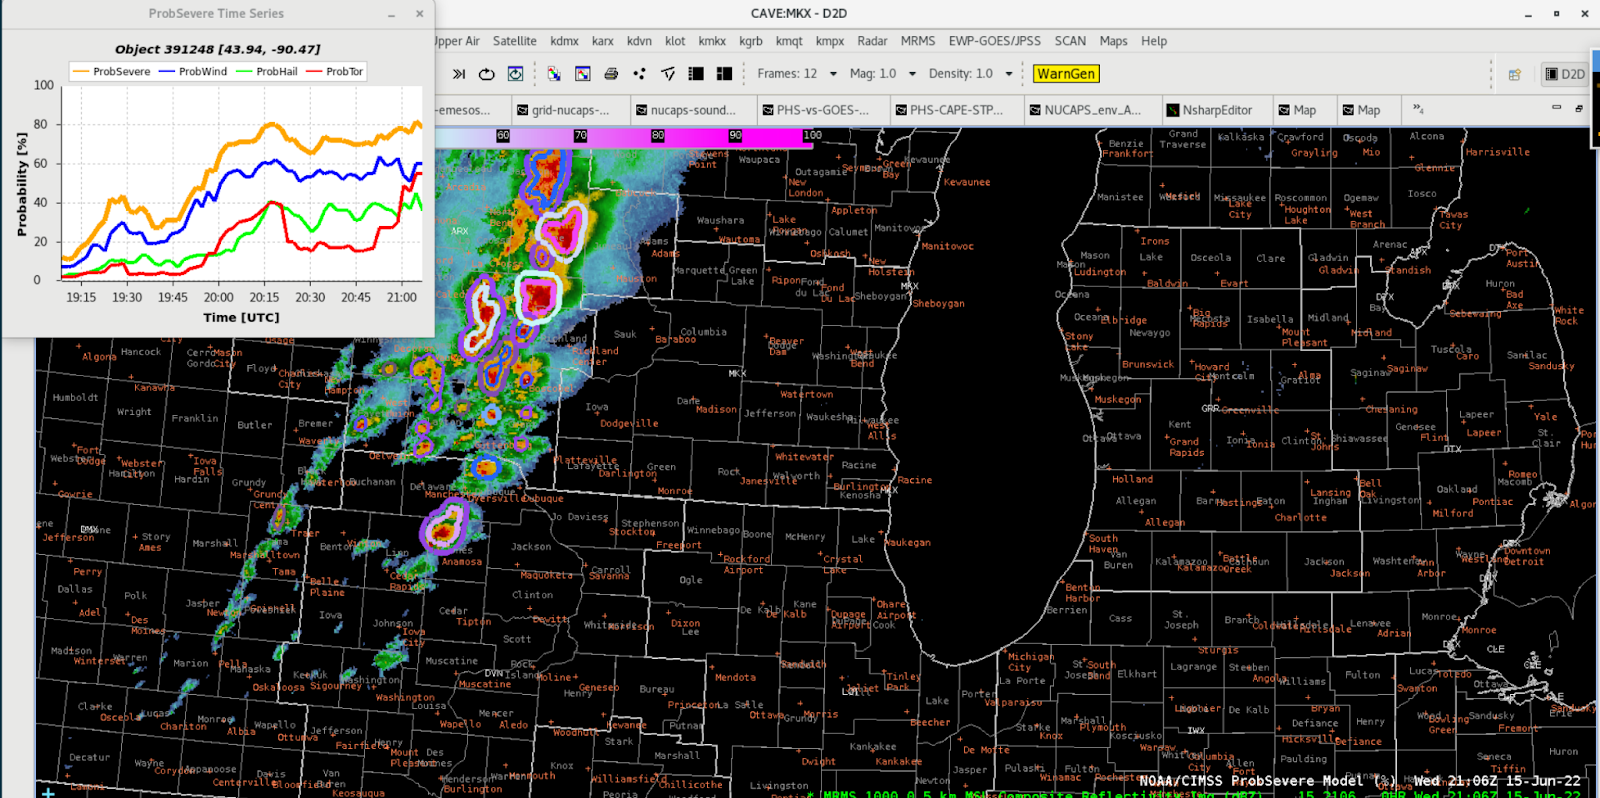
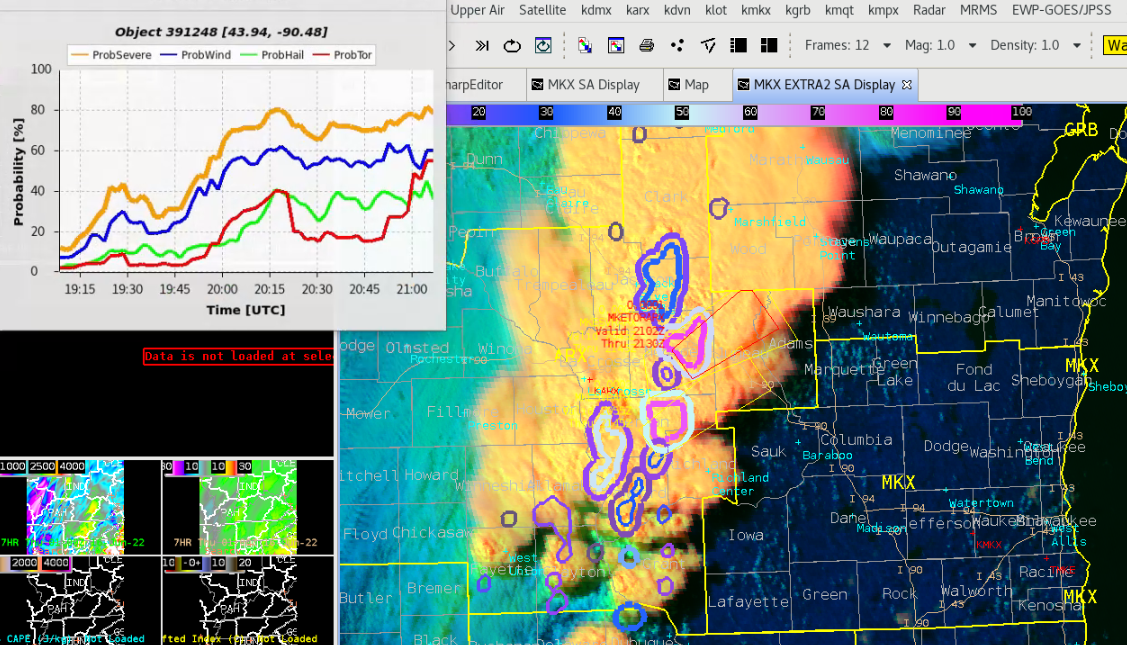
At 2106z, the ARX office had recently issued a Tornado Warning (2102z) for the northern cell with a high % on PSV3 and PTV3, per the noted superior calibration of the updated model vs. the V2. Could the PSV3 and PTV3 trend on this storm have assisted the radar operator in an increased lead time? As you can see below, starting at 2045z, there was a sharp upward trend in the ProbTor, to near 40% prior to 21z. At the least, this tool appears to be an excellent situational awareness tool, and may even be able to help lead time in some cases. It helped us in the MKX CWA regarding downstream warning issuances. In the event of an unexpected radar outage in a sparse radar coverage area, environmental analysis plus satellite interrogation with the utility of PSv3 could support successful radar warning ops in a less than ideal scenario.

– Hurricane84

Situational Awareness and Lead Time with LightningCast and ProbSevere/Tor

Today’s experience landed us in MKX monitoring convective development potential across the western portion of the CWA, with a line of storms ultimately moving in from the west, and some risk of discrete cells persisting even after we ceased the experiment.

I took the opportunity today to set up procedures overlaying PHSnABI indices (CAPE) with satellite imagery (e.g. Day/Cloud Phase or Viz), to see how well it corresponded with convective development. Unfortunately I didn’t grab a screenshot, but it was a nifty display that I hope to use again. PHSnABI suggested that CAPE in some areas of the CWA was not as high as the SPC mesoanalysis or RAP suggested. We tried to investigate this using a combination of NUCAPS and model soundings and RAOB, but couldn’t figure out a reason for the CAPE depression before incoming storms grabbed our attention. Notably, the indices derived only from GOES agreed with PHSnABI about this depression, though we couldn’t figure out if it was correct. It seems likely the GOES ABI was driving the PHSnABI result.

My main takeaway the rest of today is how useful ProbSever, ProbTor, and LightningCast can be with approaching/developing convection.

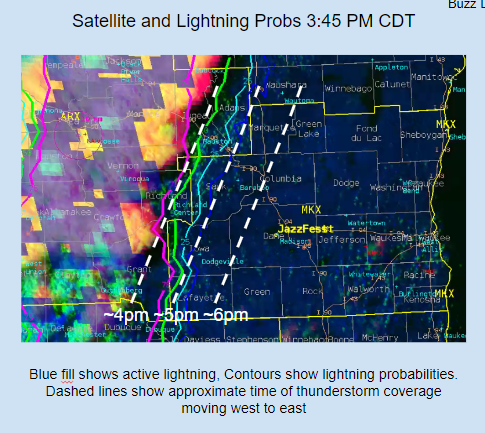
LightningCast, combined with GLM data, was useful for IDSS imagery to depict position and potential of lightning (example DSS slide using these graphics provided below).  Storms never made it to our decision point prior to leaving the experiment, but lightning threat was usefully communicated to the simulated JazzFest event.
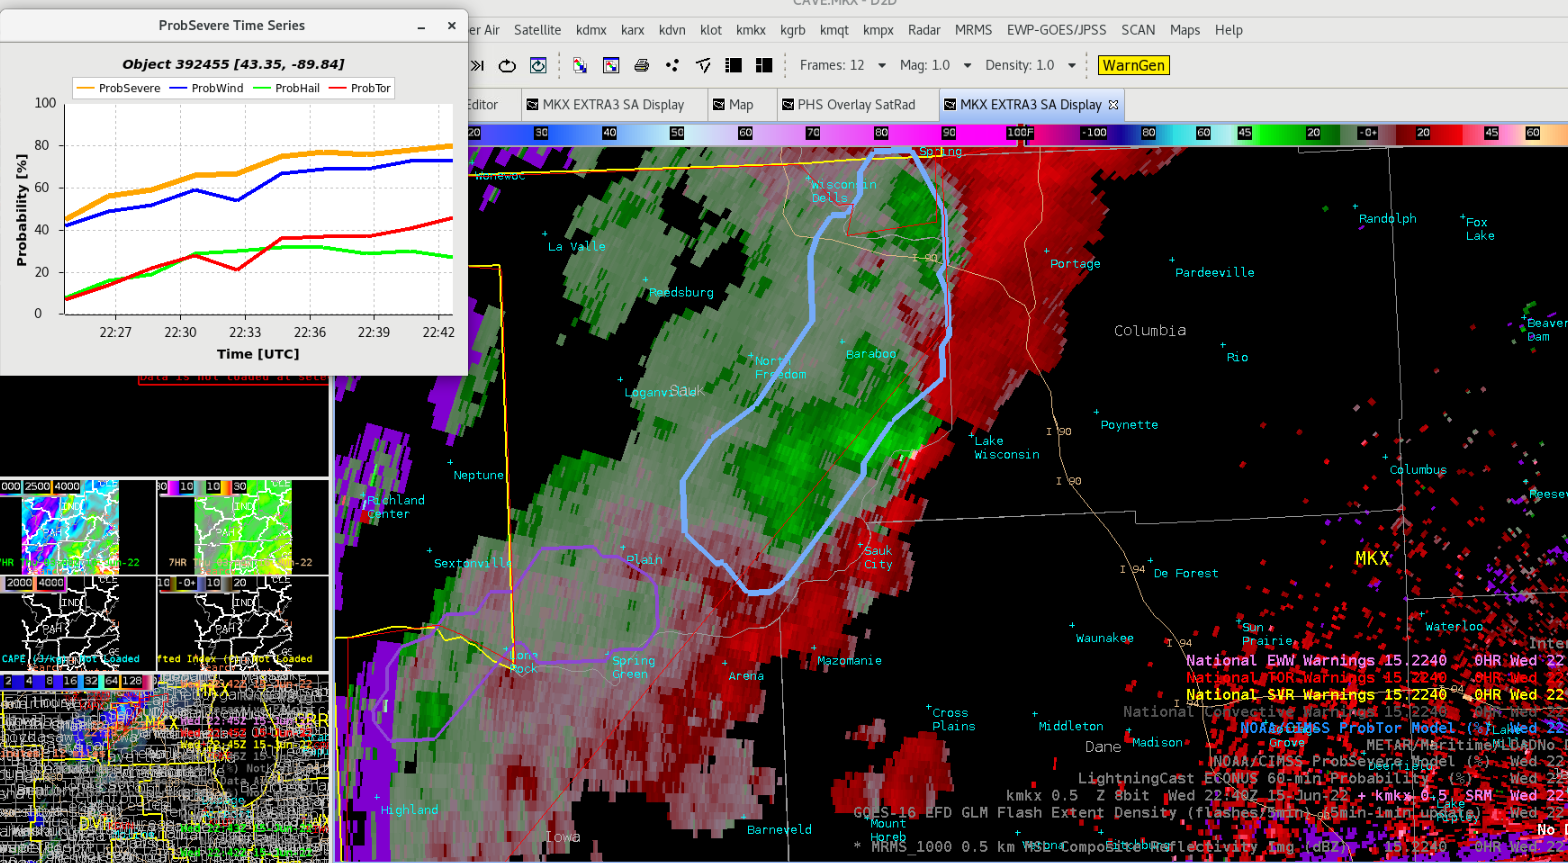
As convection developed, we also practiced relying on probSevere and probTor for lead time in anticipating warnings. The following shows an example where the probTor trends corresponded well with ARX’s actual decision to issue a tornado warning.
SImilarly, intensification of the convective line appeared to be well detected. In fact, depending on what threshold of the probSevere parameters is relied on (probably depends on environment and other factors), the escalating value could have given useful lead time for a severe issuance decision.
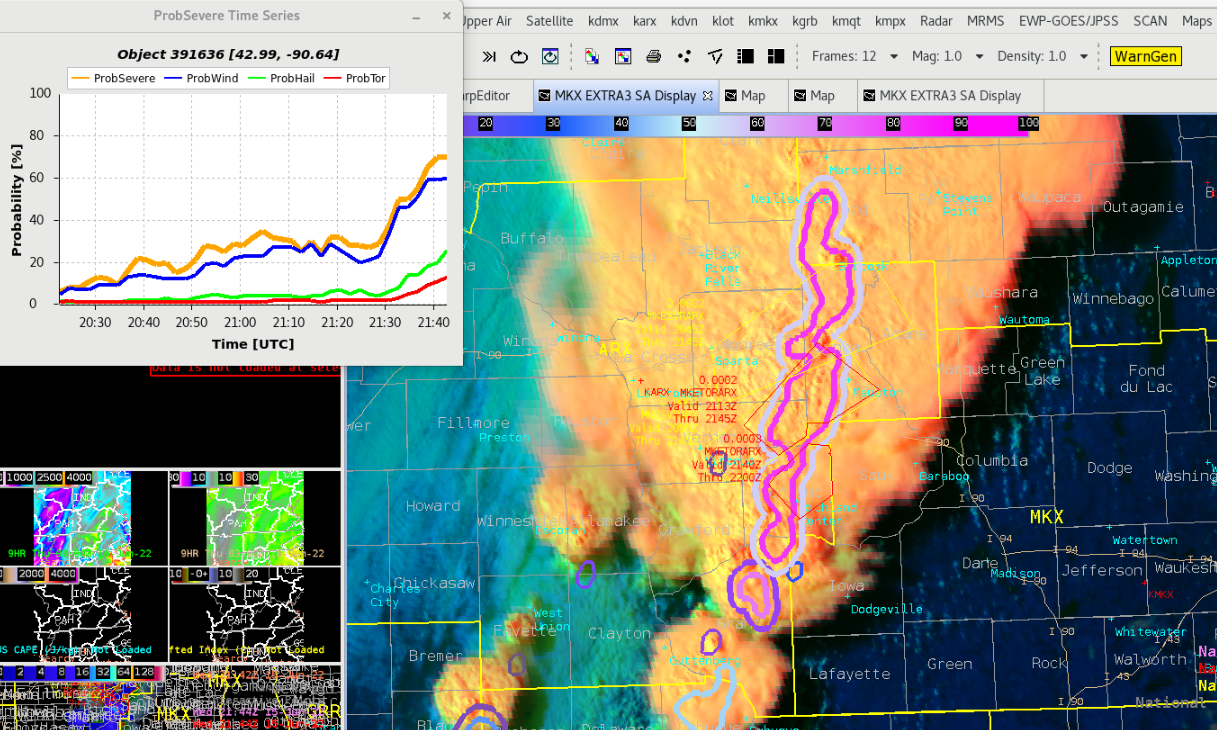
Although the main mode appeared to be a line of convection, there were positions along the line where tornado risk seemed to increase (evidenced by radar velocity). It was reassuring to see probTor pick up on the gradually increasing risk of tornadoes as well.
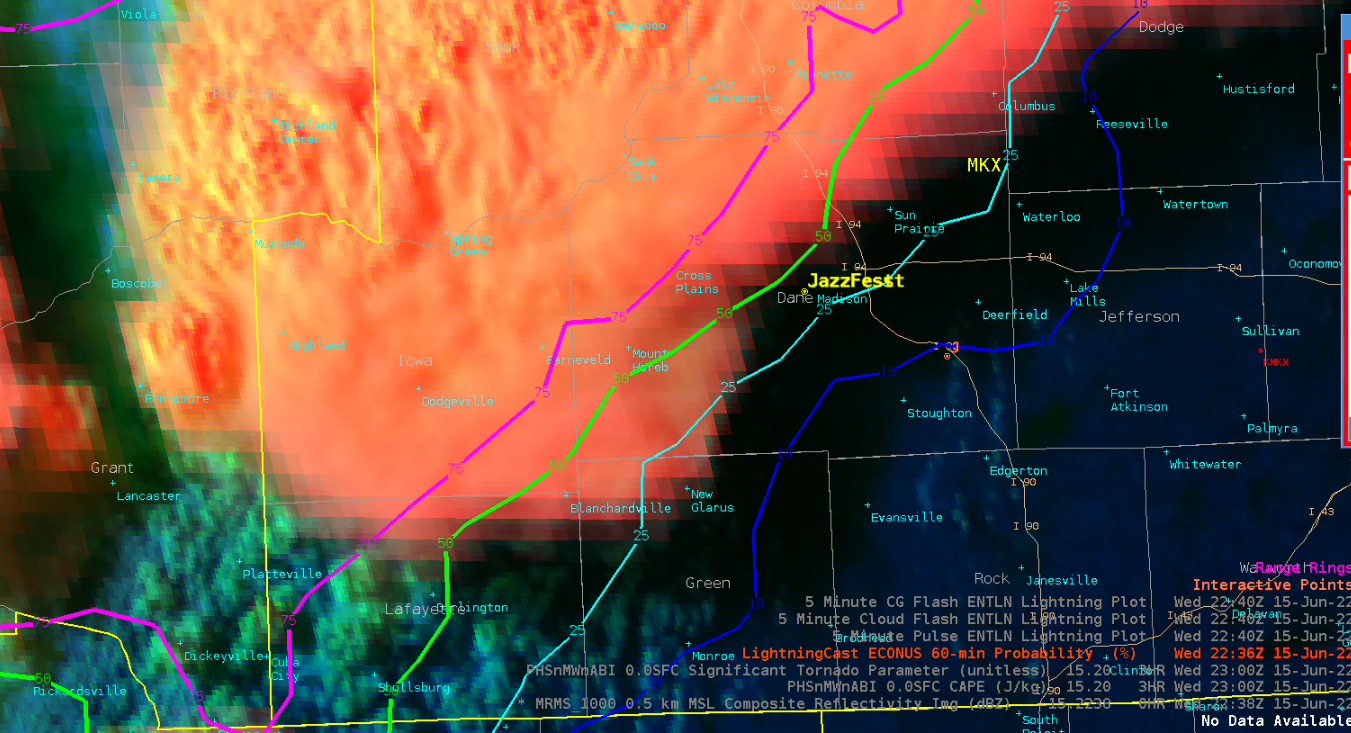
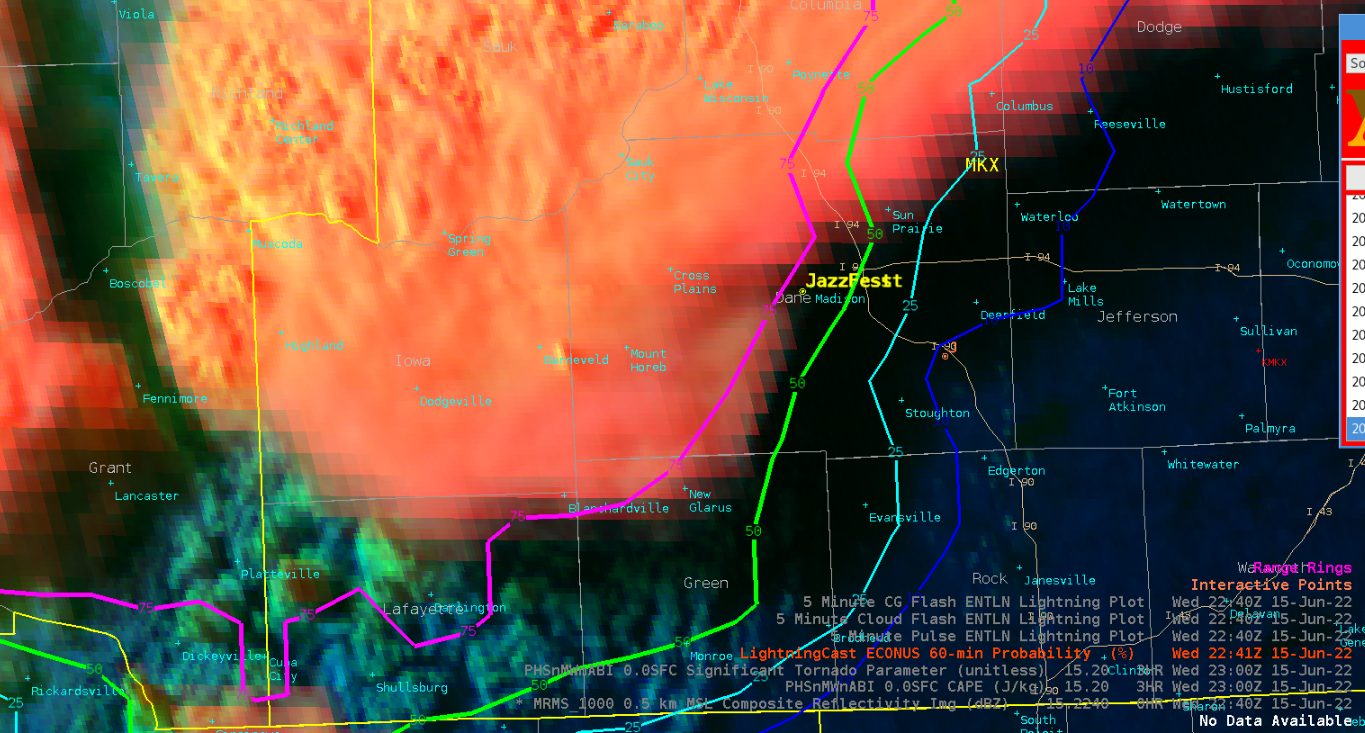
And one final note… lightningCast is fairly impressive in how it produces calibrated estimates of lightning occurrence using only a single time step of satellite imagery (though it uses several bands of the ABI). Naturally lightningCast has difficulty where a developing tower is obscured by an anvil overhead, as we saw in this example. But it was neat to see lightningCast immediately respond with a broader swath of high lightning probabilities the very first time that a tower poked above the anvil that previously obscured it.  The fact that it was hidden probably means lightning could have been occurring below the anvil with lower than ideal lightningCast probabilities (though non-zero, to its credit), but it was neat to see the immediate adjustment to the probability contours with new imagery.
– Buzz Lightyear

A Close Look at LightningCast for the Application of DSS or TAF Support

On June 15th 2022, a dynamic setup was unfolding across Iowa, Minnesota, and Wisconsin with multiple hazards that NWS forecasters would have had to message and warn. For this case, we were on watch for a DSS event representing the Cranberry Blossom Festival in Wisconsin Rapids in the GRB CWA. The main concerns with the event were lightning and any severe storms, both of which seemed certain for this case and the name of the game was timing the oncoming convection.

LightningCast uses machine learning with numerous satellite inputs that yields the probability of lightning occurring at a location within the next hour. This product immediately jumps to the front of a forecaster’s mind to apply for decision support services (DSS) or assessing lightning probability for airport forecasting. Below is a table showing the probabilities from LightningCast versus the “time of arrival” tool that estimated storm timing based on the movement of storms:

First vicinity lightning strikes (within 10 mi of event): 4:21 PM
Arrival of storms (within 10 mi of event): 4:30 PM
Immediately the usability of this product is fantastic. It shows the probabilities of lightning occurring in a contour format, making it a great pairing with satellite imagery, lightning data, and radar. WIth this case being a very well forced event the main evaluation was the percentages and how they did with the advection of the storms. The LightningCast seemed to ebb and flow with the eastward acceleration and deceleration of the storms between 3 and 3:30 PM, while the next 15 minutes showed accelerating storms, giving a 61% chance of lightning within the next hour at 3:45 PM. With the acceleration of the storms, it was good to see the model adjust, with the 50% threshold being crossed before 3:45 PM. The 50% threshold is very important for forecasters, as values above that are typically  used in several products and gauges of confidence. The LightningCast model giving upwards of 40 minutes of lead time for advecting storms gives me a lot of confidence in the product, leaving me wishing it was already available within our datasets for immediate use.
– aerobeaver

GLM and ProbSevere – Day 2

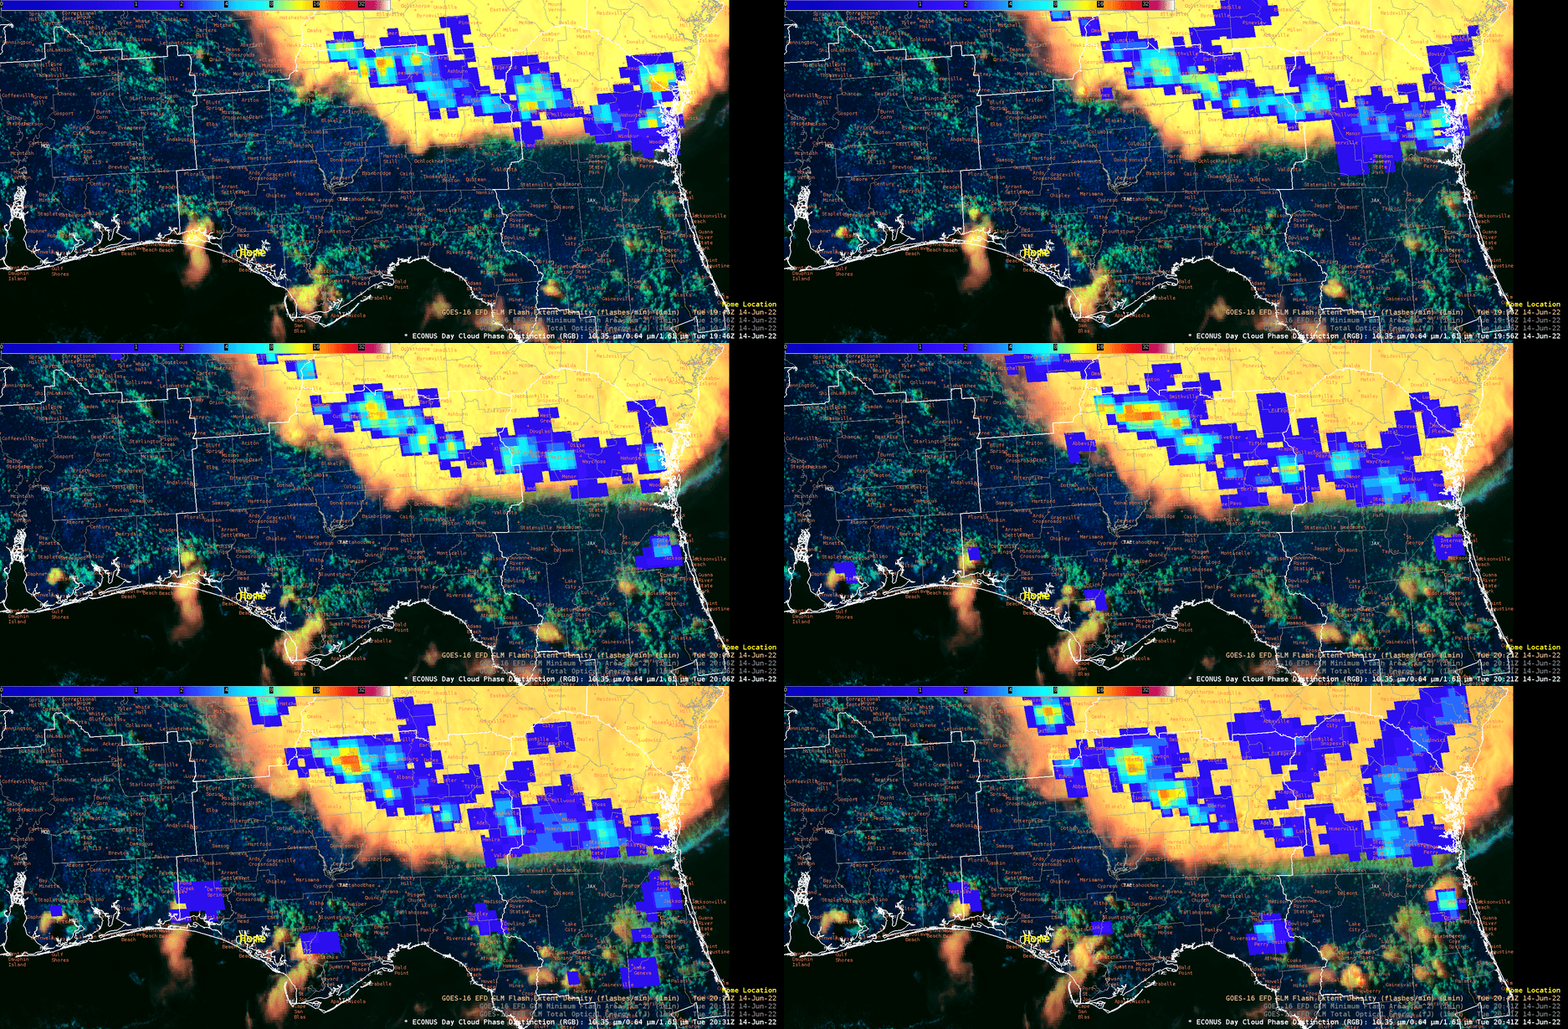
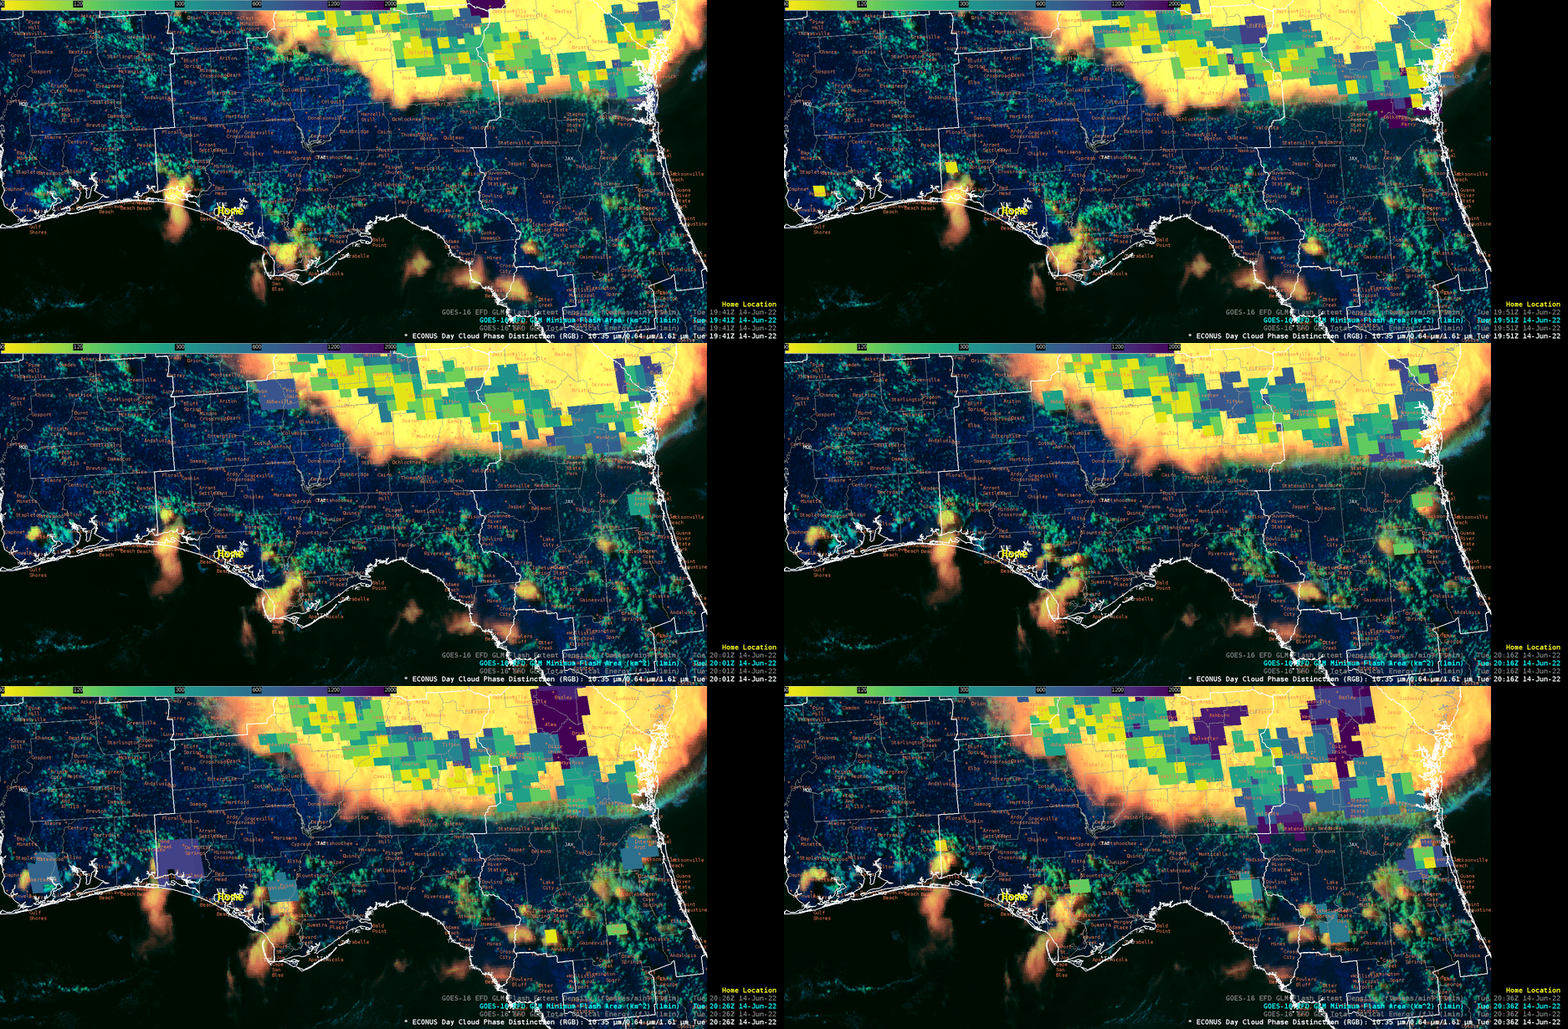
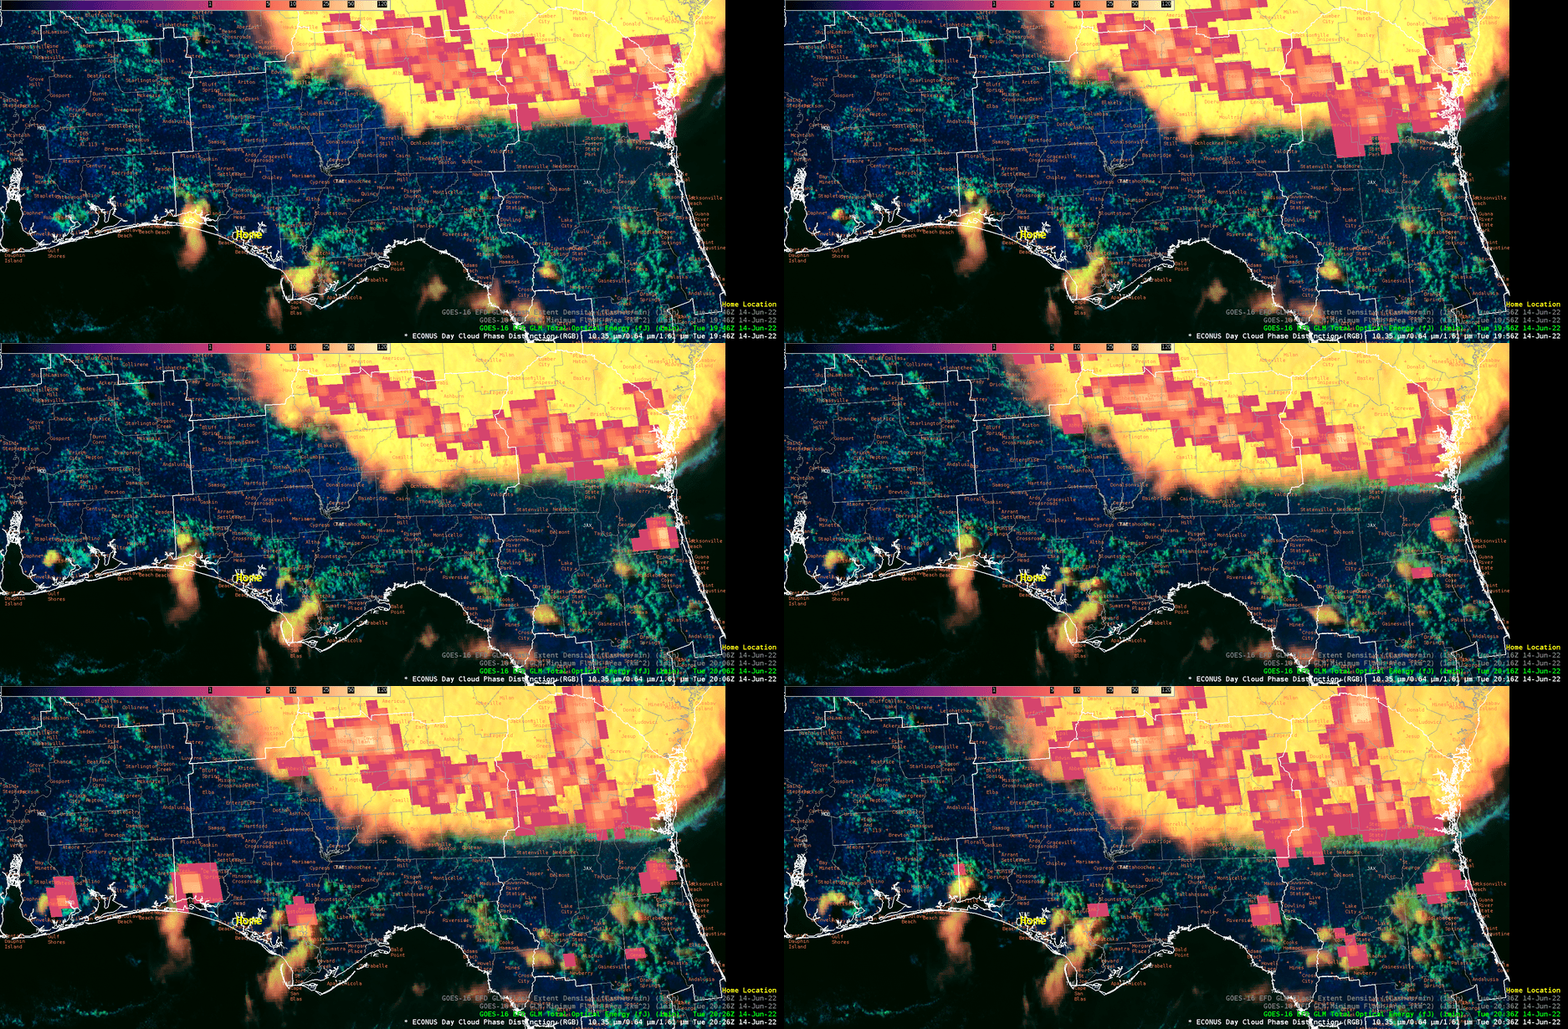
Utilizing the GLM data for DSS and severe weather operations is vital in providing timely and quality information to our partners and the public.  In this instance on Tuesday, June 14, 2022, we were monitoring storms near a DSS event (baseball tournament) located in Panama City Beach, FL.  You can see the location marked as Home on the following animations.  Two main forecast concerns, isolated convection along the beach due to the sea breeze and a line of storms moving south west out of SE Georgia into northern Florida heading toward the DSS event.

The first, and most imminent concern, was focused on the isolated storms developing along the sea breeze front throughout the FL Panhandle. The main threat with these isolated storms was lightning and brief heavy rain.  Utilizing Day Cloud Phase Distinction RGB overlaid with GLM Flash Extent Density, Minimum Flash Area, and Total Optical Energy was used for the DSS provided.  A line of CU developed to the east of the event moving westward.  Again, the main concern was with lightning but certainly with the amount of instability (DCAPE present), downbursts could pose a threat as well.   Utilizing the GLM data, they were able to contact the event POC to notify them of the lightning threat to the east and if held together could reach the 10 mile radius within next 1-2 hours (21-22z).  What helped with the lightning briefing was the short intensity shown on the TOE and MFA within that storm to the east of Home. It quickly weakened and we were able to notify the event coordinator of this information providing them with further confidence to not have to evacuate their facility during the tournament.

The second concern for the event was the line of storms to the northeast in GA/northern FL moving southwest toward the event.  The great news about this storm was the very very slow movement southwest.  Thus, the threat of lightning and gusty winds would hold off for a considerable time frame.

– Podium