
I took on the DSS role during today’s operational period. There were no afternoon NUCAPS-Forecast runs and the morning runs provided minimal coverage over the AMA CWA. So, I opted for PHS data today (namely SBCAPE) with MRMS 0.5 km Composite Reflectivity and ProbSevere overlaid (Figure 1) to diagnose the environment. Much of AMA was socked in by stratocumulus at the start of the operational period, but severe storms just to the west posed a concern as they tracked eastward into a gradually destabilizing environment.
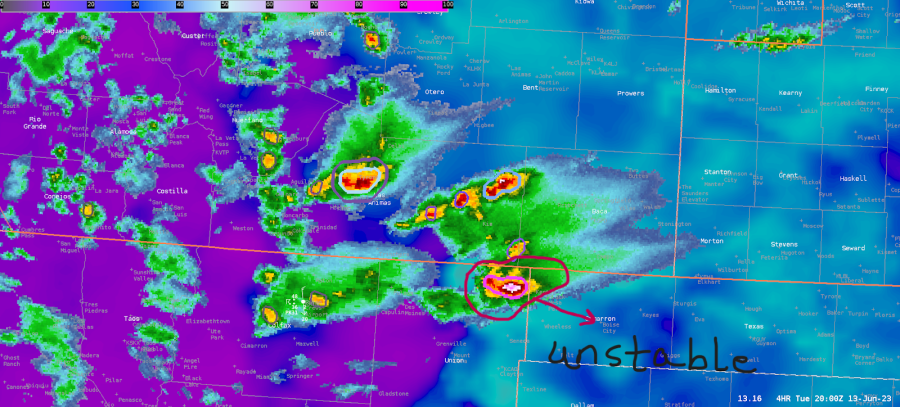
Figure 1
The assigned DSS event was a hypothetical RC plane show at Texoma Municipal Airport (denoted by a yellow star in Figure 2). I was instructed to alert the hypothetical POC for the event when either of the following hazards were expected within 20 minutes: winds or gusts of 15 kts at the airport OR lightning within 10 miles. I used LightningCast probability contours along with ENI 5-minute pulse lightning plots (reddish orange tick marks) to monitor the proximity of lightning to the event range ring (Figure 2). I issued a DSS update with “lightning likely” wording after the LightningCast meteogram depicted a steadily increasing likelihood of lightning at the airport within an hour (Figure 3).
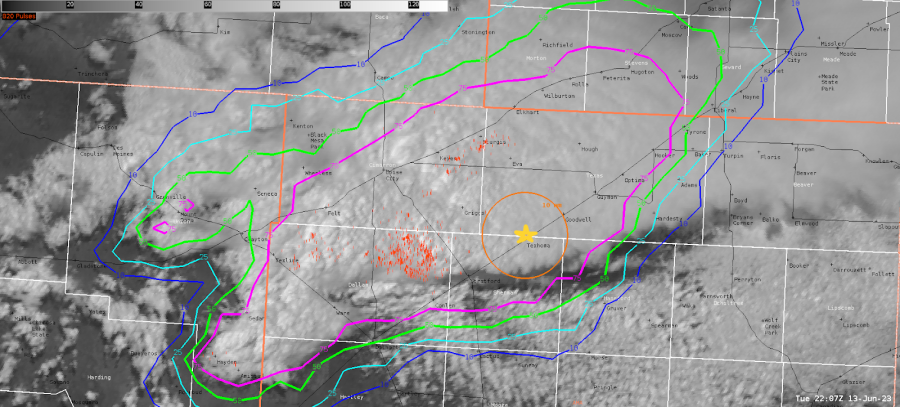
Figure 2
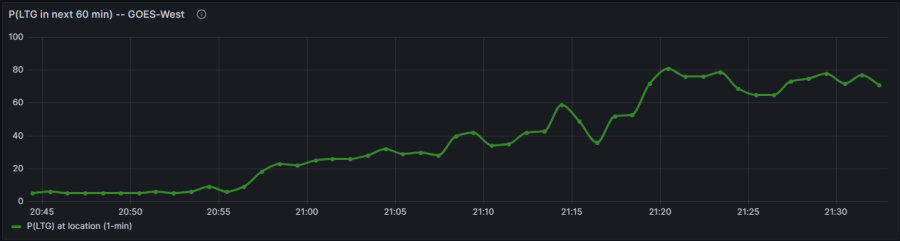
Figure 3
A LightningCast observation: the footprint of the 75% probability contour was much larger than the actual area in which lightning strikes occurred (at least according to ENI 5-minute pulse lightning) mainly in the anvil region. That said, GLM Flash Extent Density did indicate low-value pixels in the anvil region, so perhaps I missed some anvil lightning strikes by looking at just ENI 5-minute pulse lightning.
– Vort Max