
General question overall, can the units be displayed in fraction form instead of with a (-1 or –2)? Such as m/s instead of m*s-1?
PHS
Can temperature units be in F or even C instead of K?
Is 0-1 KM bulk shear AGL?
Could the bulk shear be in knots instead of m/s?
Can the bulk shear vectors and mean cloud wind vector (or 850-300mb wind) also be plotted? This can help with determining storm mode.
The PHS had storm coverage well matched with radar when simulation started. However it was about 3 rows of counties too far north than what actually was happening. This led me to believe that all the other data with PHS was also shifted north for what was actually happening.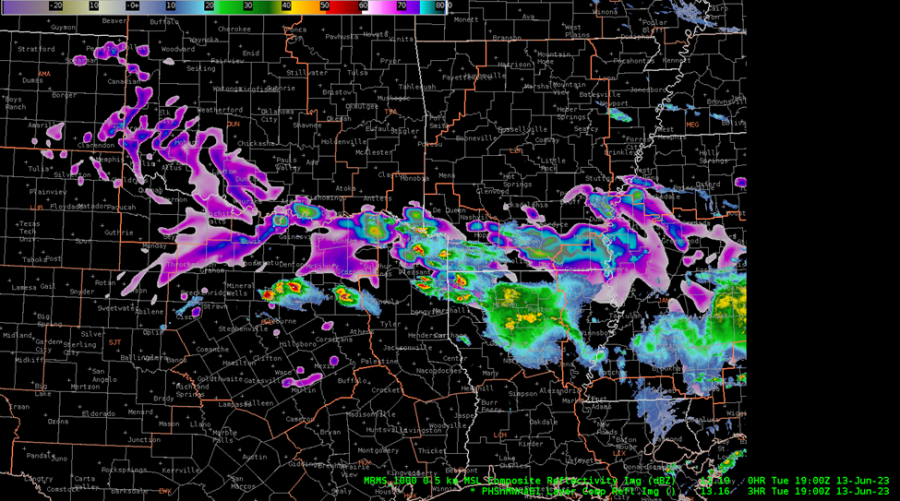
Could mixed layer CAPE/CINH be added to the stability menu? I think SPC’s mesoanalysis page defaults mixed layer to 100mb. We use mixed layer CAPE quite frequently at our office.
Having DCAPE as a viewable product would be very helpful to diagnose a severe wind threat from supercells.
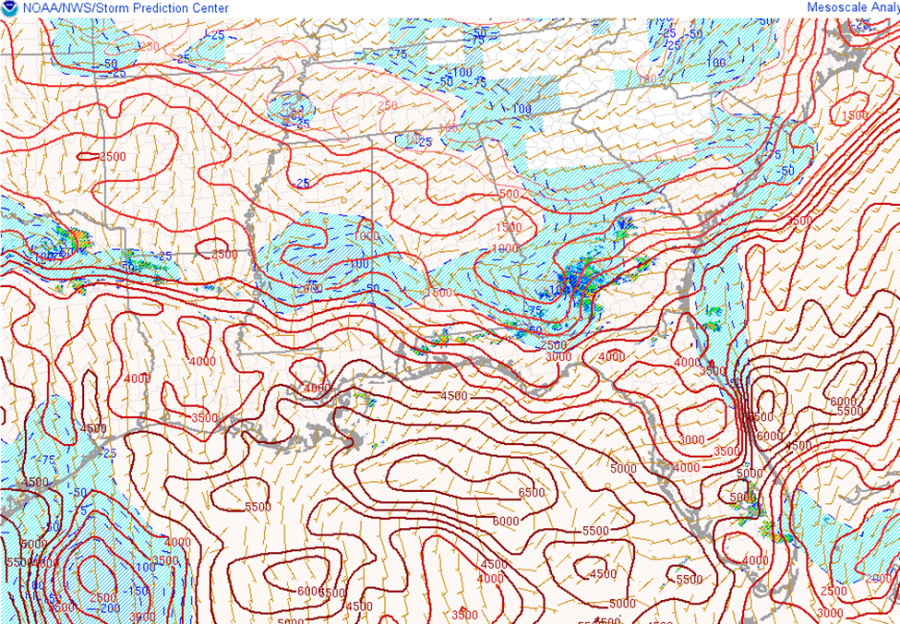
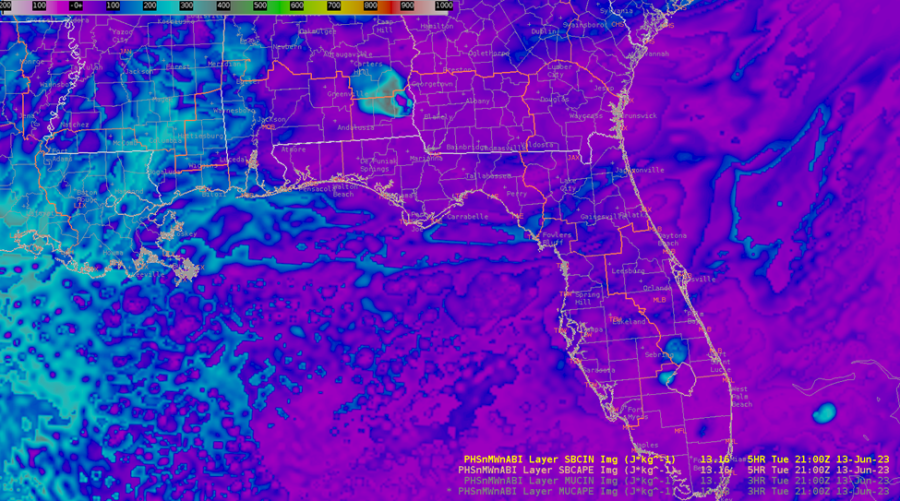
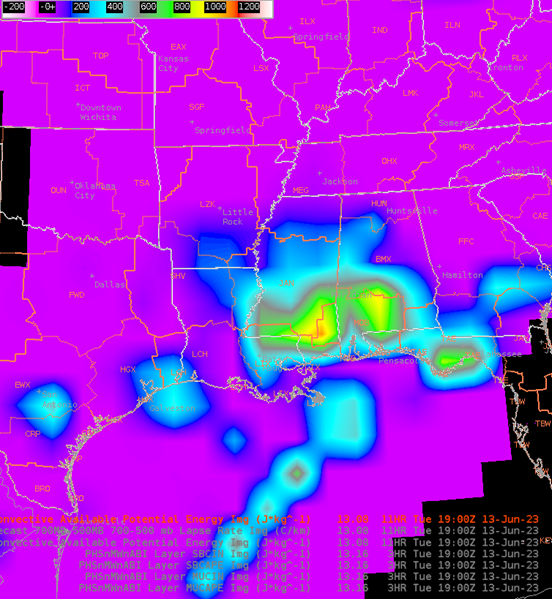
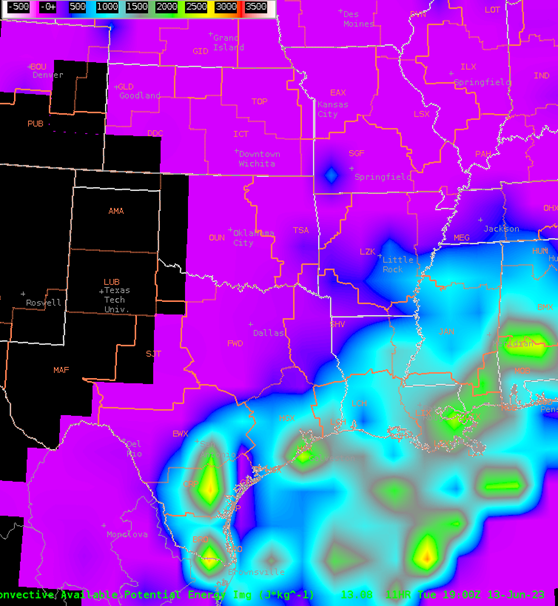
Noticed the PHS surfaced based CAPE/CINH matched quite well with mesoanalysis except for the CAPE/CINH just north of FL. Both images are from 21z.
LightningCast
Helped maintain awareness about the overall threat for lightning, especially on the outskirts of the storm.
NUCAPS
Noticed the ML CAPE was much further east than what happened. Of course this was from the morning overpass, not the afternoon one.
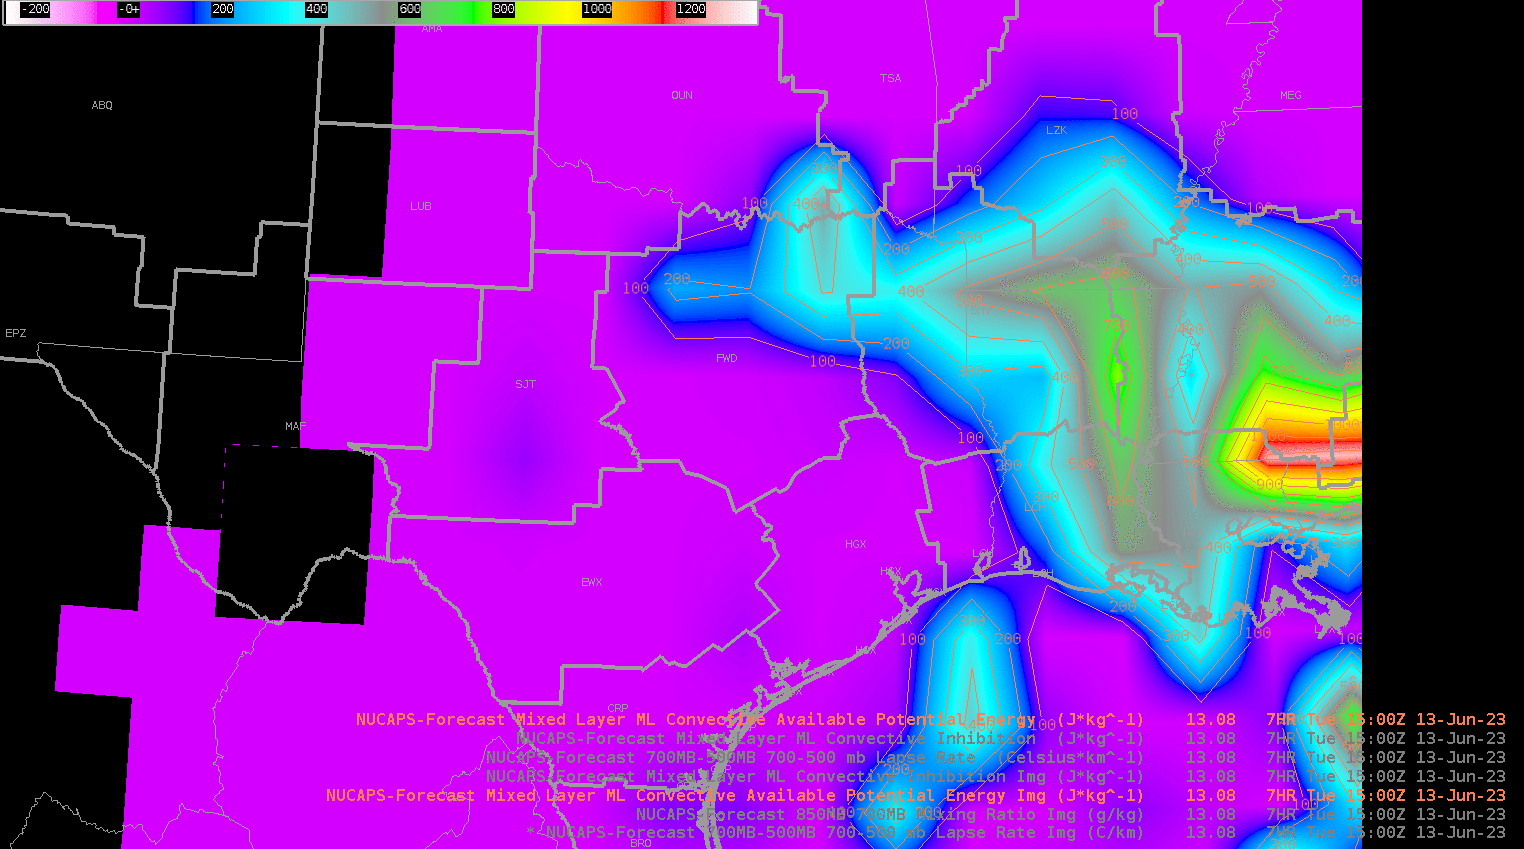
Did notice that the ML CAPE was lower than the surface based and MU CAPE. Was going to look at a NUCAPS sounding to determine why that may have been the case. However was not able to do that due to no data aside from the morning run. ML CAPE is on the left, MU CAPE is on the right below.
Prob Severe
Is there a way to highlight which storm Prob Severe is showing the trends for? When I am looping the radar with multiple storms on it (example image below), I quickly lose track of which storm I had the trend graph displayed for. Really like the ability to look at the trends graphically through AWIPS instead of having to go to the webpage to do so.
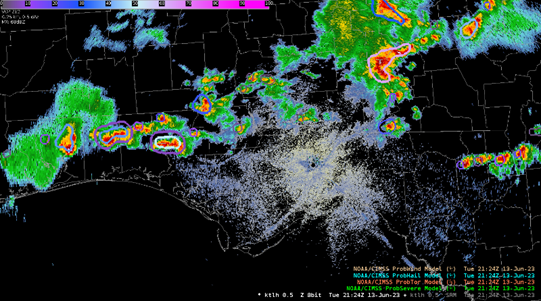
Noticed the readout only displayed above the pointer, not below. The right image is what happened when I tried to sample the Prob Severe data.
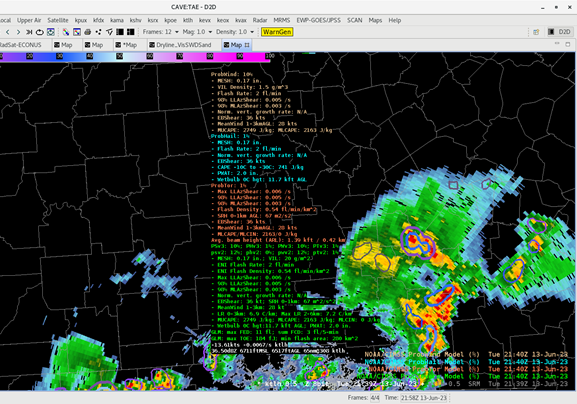
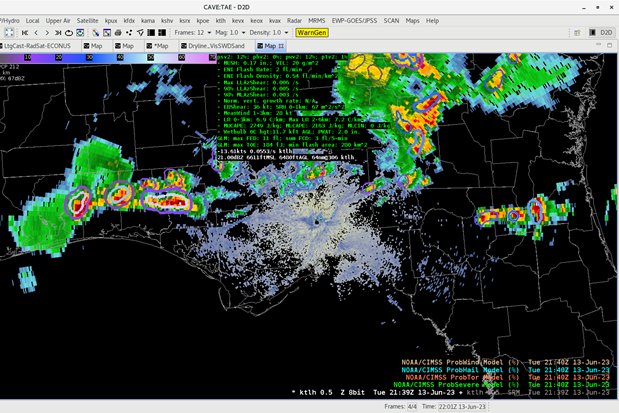
Could there be an option to select the different fields we want Prob Severe/Hail/Tor/Wind to show? There is a lot of data there, good data, but at the same time too much to look at during storm interrogation.
Does ProbTor calculate QLCS tornado probability? This would help build confidence for issuing these kind of tornado warnings because the environment can change so rapidly from one radar scan to the next.
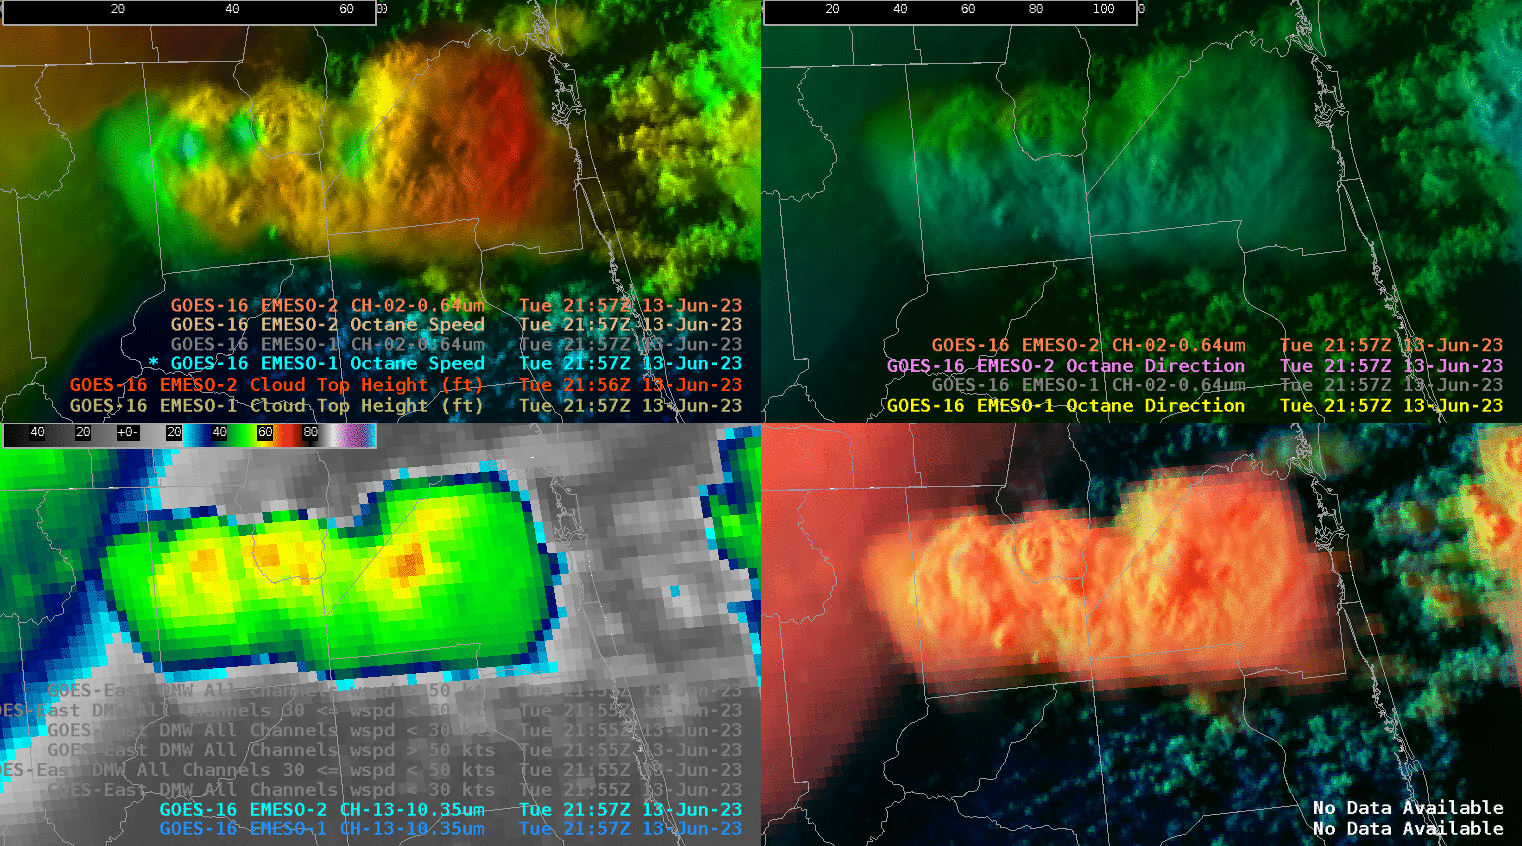
OCTANE
This helped me really see the updraft divergence of the cells. This was in deep layer shear environment of 20 kts. Neat to see the divergence weakening on the middle bottom cell in the upper left pane weaken as the cloud top temperatures warmed for that cell, confirming that the updraft was weakening.
– Rainman