Monitoring South FL Convection for the Miami Open

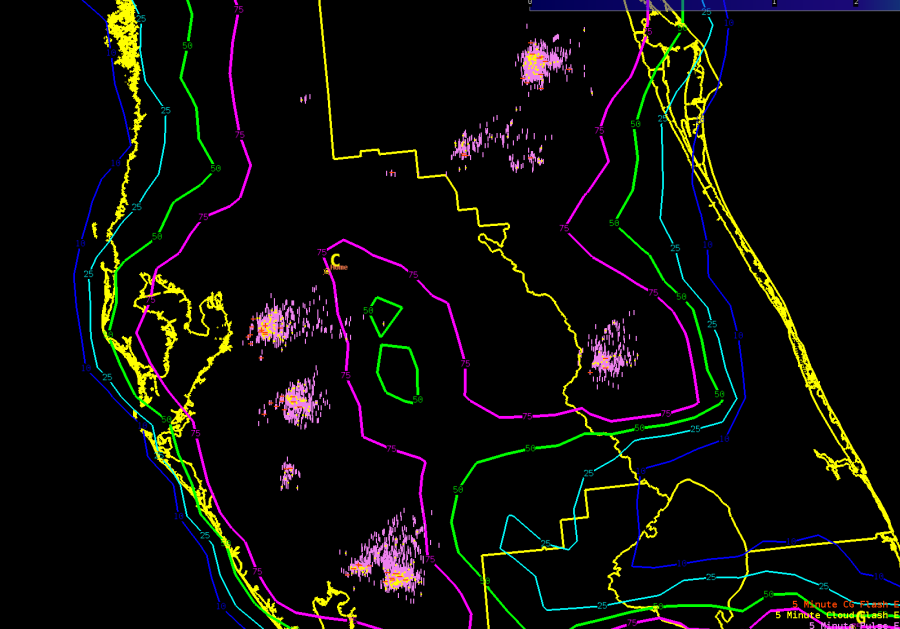
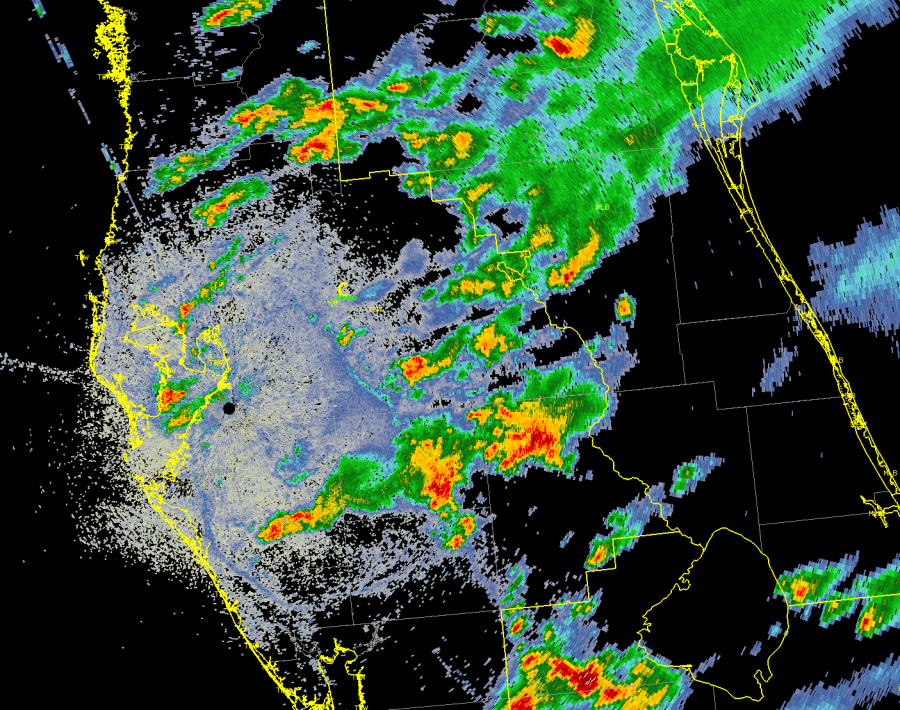
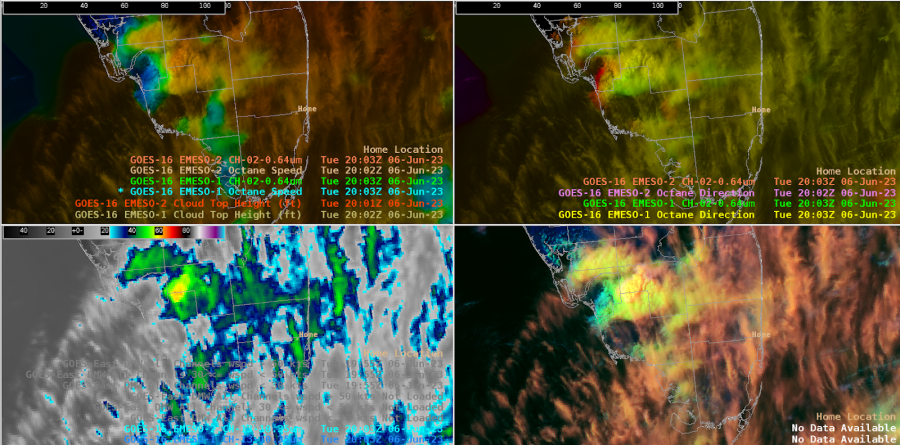
We’re closely monitoring for CI near the Miami Open Tennis Tournament (location noted by the Home marker). Thus far this afternoon, the deepest convection has been in the west, NE of Naples, where the Band 13 imagery shows high cloud tops with cool brightness temps (-66C), and Octane imagery shows a good divergent signal.
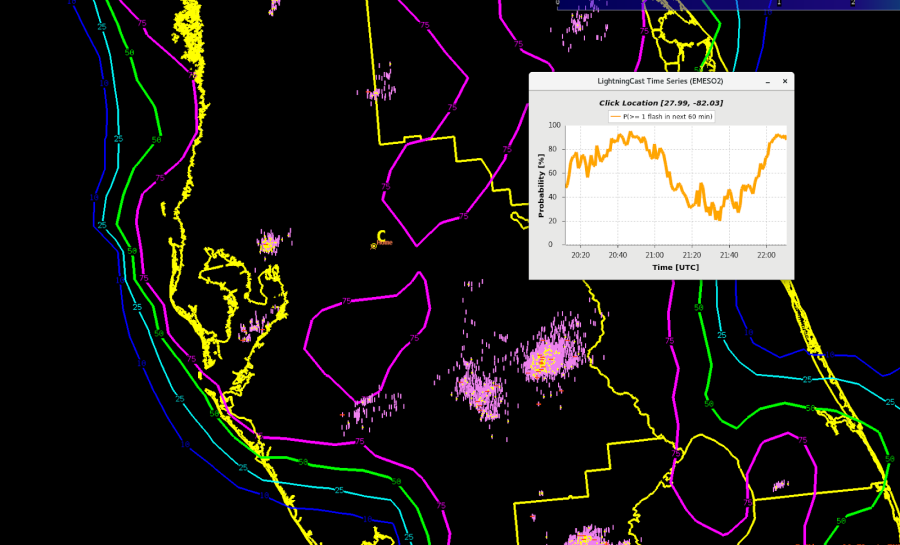
So far, LightningCast has focused on the convection in the western peninsula, with the maximum slowly translating inland and to the N along the inland-tracking sea breeze.
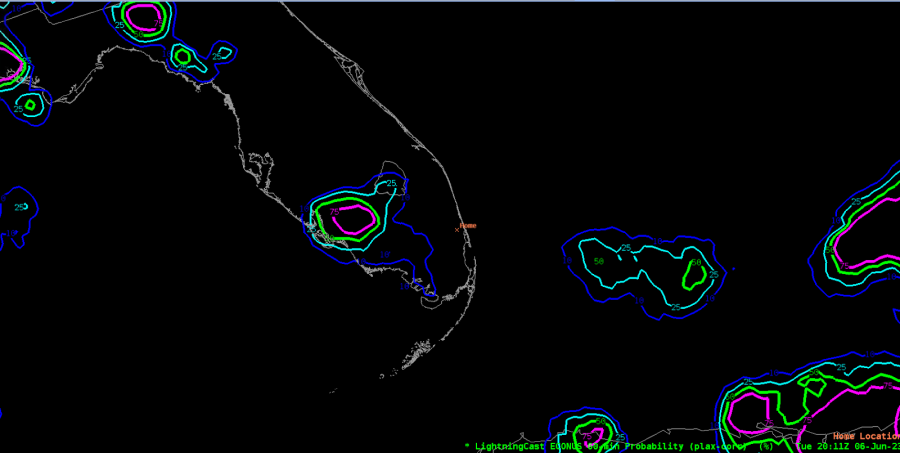
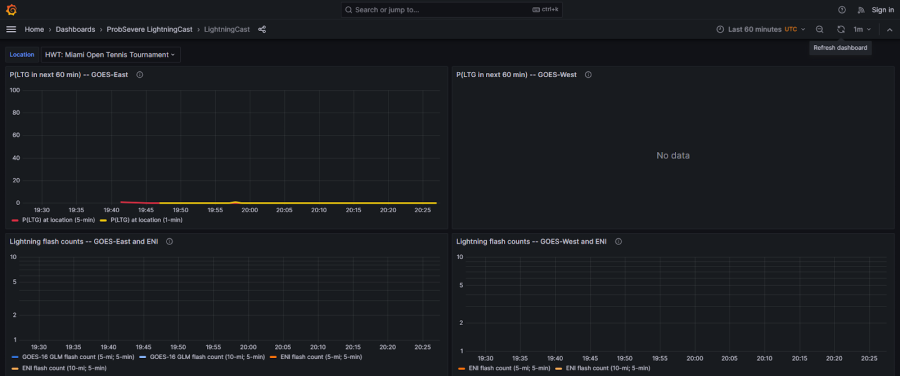
This is further confirmed by the lightning meteogram for the DSS site. Looks like they can keep playing tennis for a little bit longer!
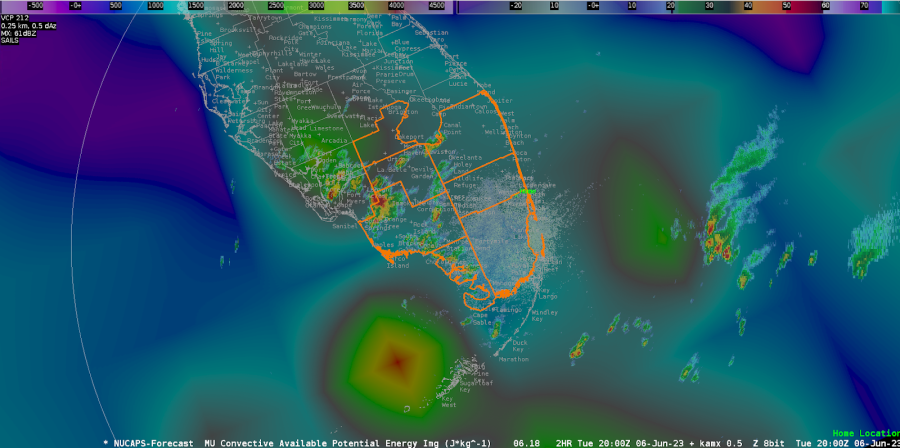
Looking at the storm clusters back west, a NUCAPS sounding near that cell shows plenty of CAPE.

The NUCAPS-Forecast MUCAPE confirms the high CAPE invof the storms.
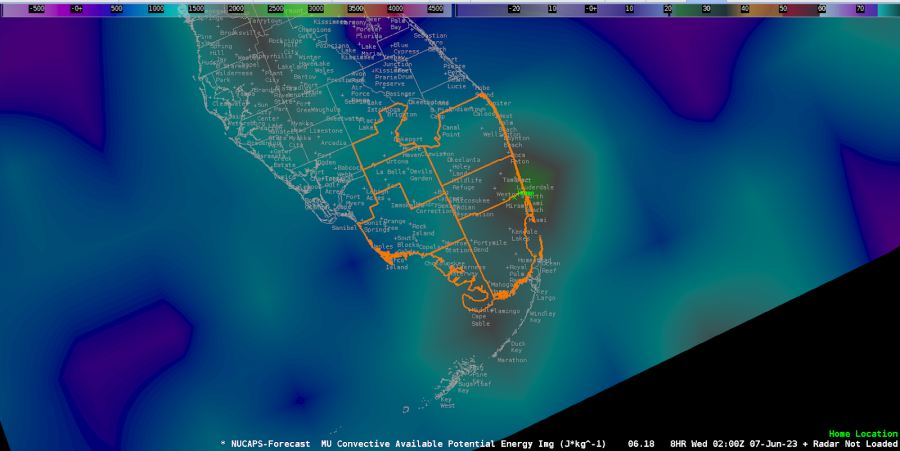
Let’s see what the forecast shows for our DSS event. By 02z this evening, it shows increasing CAPE invof the DSS event. They are not out of the woods yet!
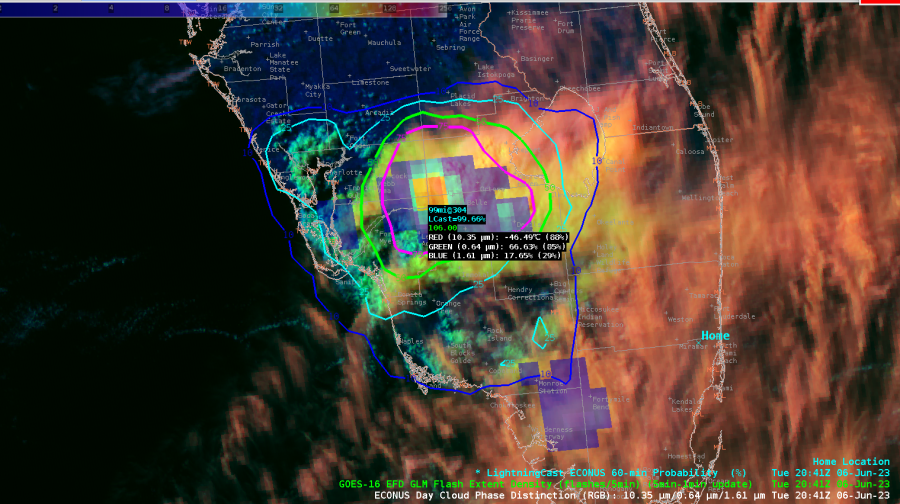
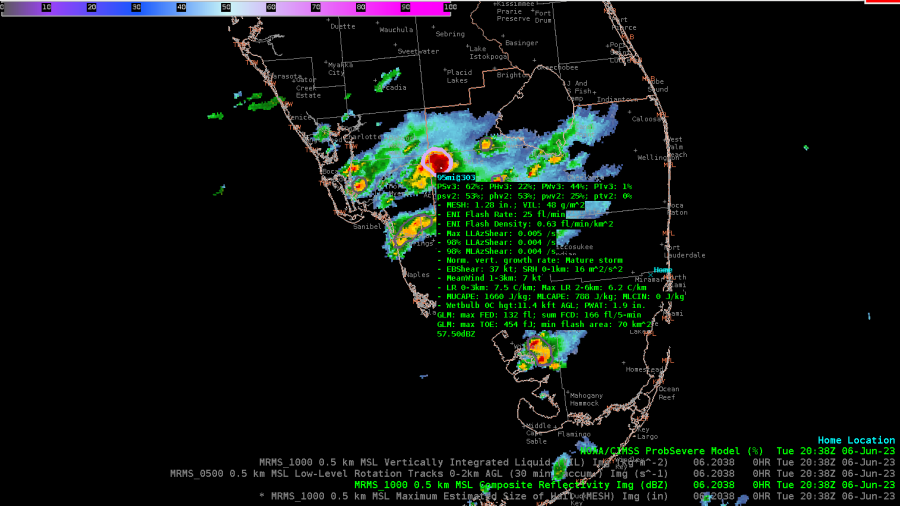
However, ProbSvr3 and LightningCast continue to provide a general idea that the strongest cell remains north and west of the Miami Open, limiting any impacts during the event.
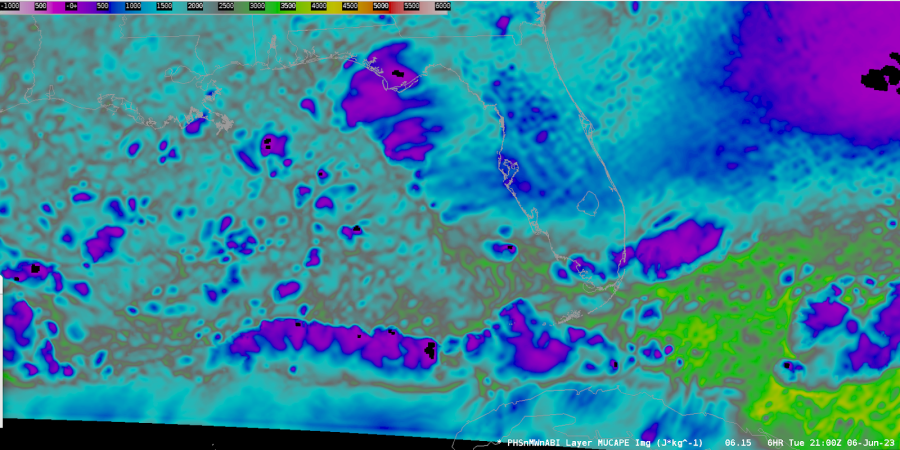
Looking at the PHS imagery, it shows continued moderate CAPE extending into SW FL invof the ongoing convection, with much lower CAPE near our DSS event.
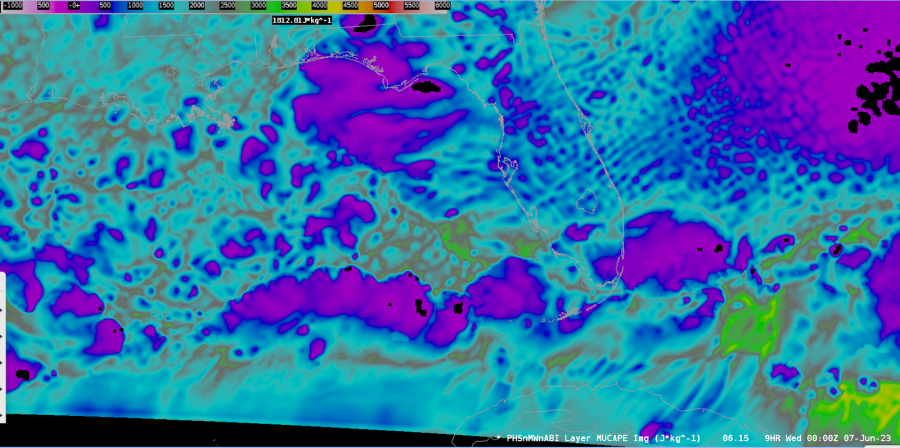
And the projections for 00z this evening show CAPE lowering further.
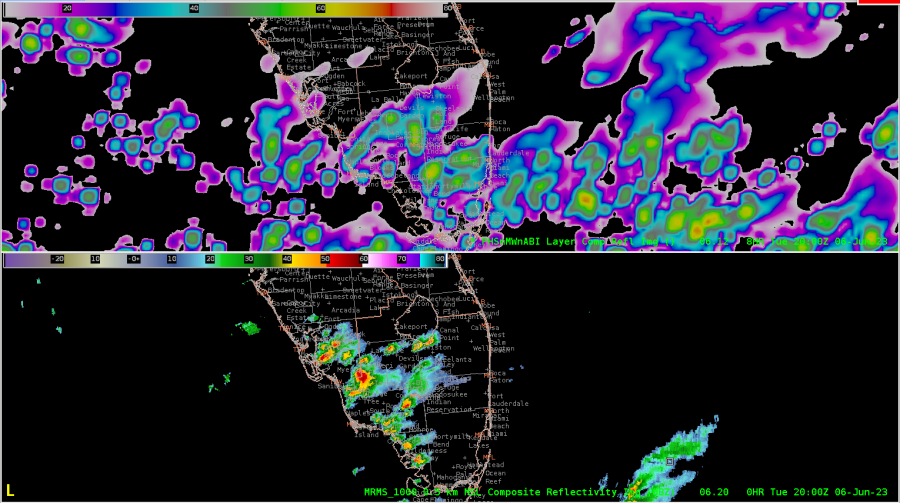
20z PHS Composite Reflectivity compared to MRMS Composite Reflectivity persistently highlights a lot of noise. Understanding from a forecaster’s perspective, this can be mentally filtered out, but at the same time, remains to be a distraction from the overall product’s use.
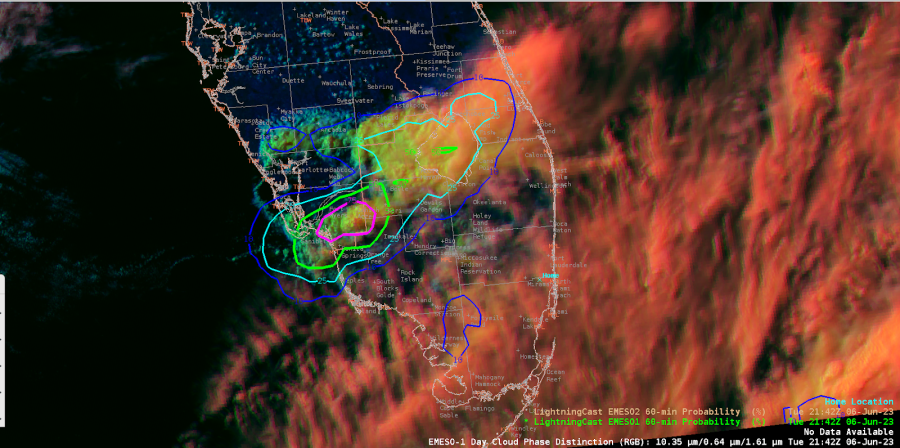
The warned cell over Glades county weakened and merged with other convection, and accordingly, the LightningCast probs declined. But we’re seeing new vigorous convection to the WSW just north of Bonita Springs.
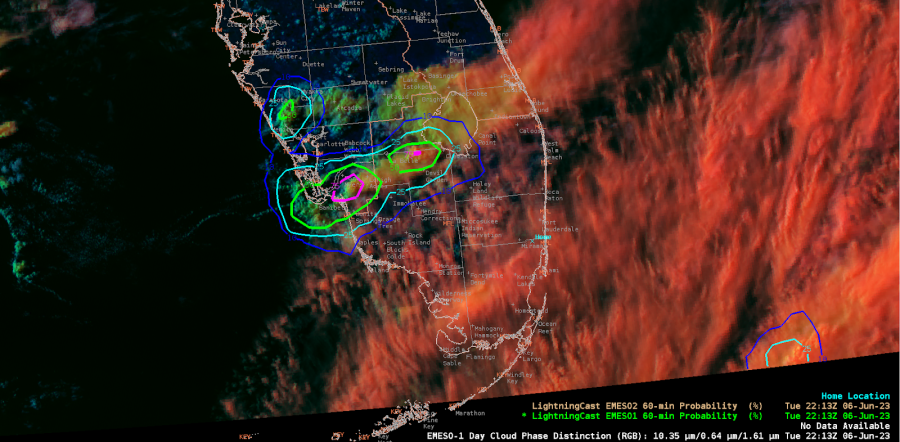
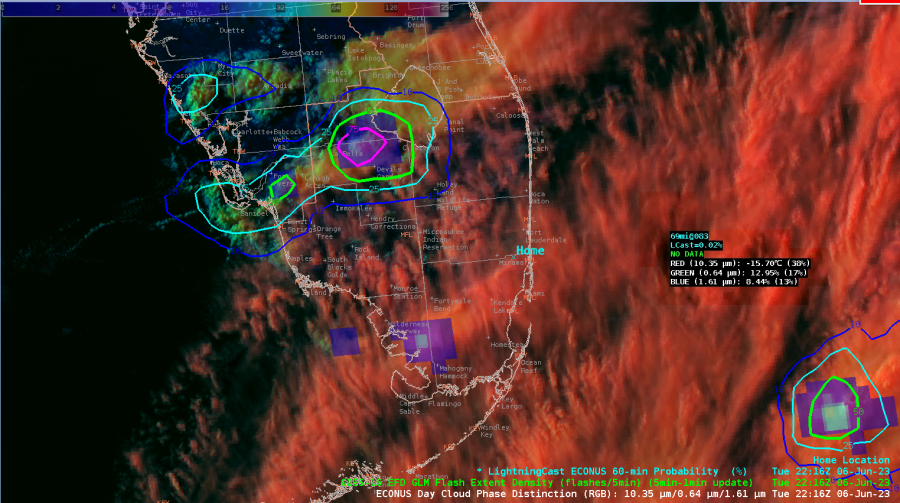
One interesting note. There are new cells developing in far SW FL with lightning noted on GLM, however the cirrus canopy there is too thick to allow LightningCast to detect this convection.
– Edgar and Harvey Specter

Tags: None

LKN LightningCast DSS Event Evaluation

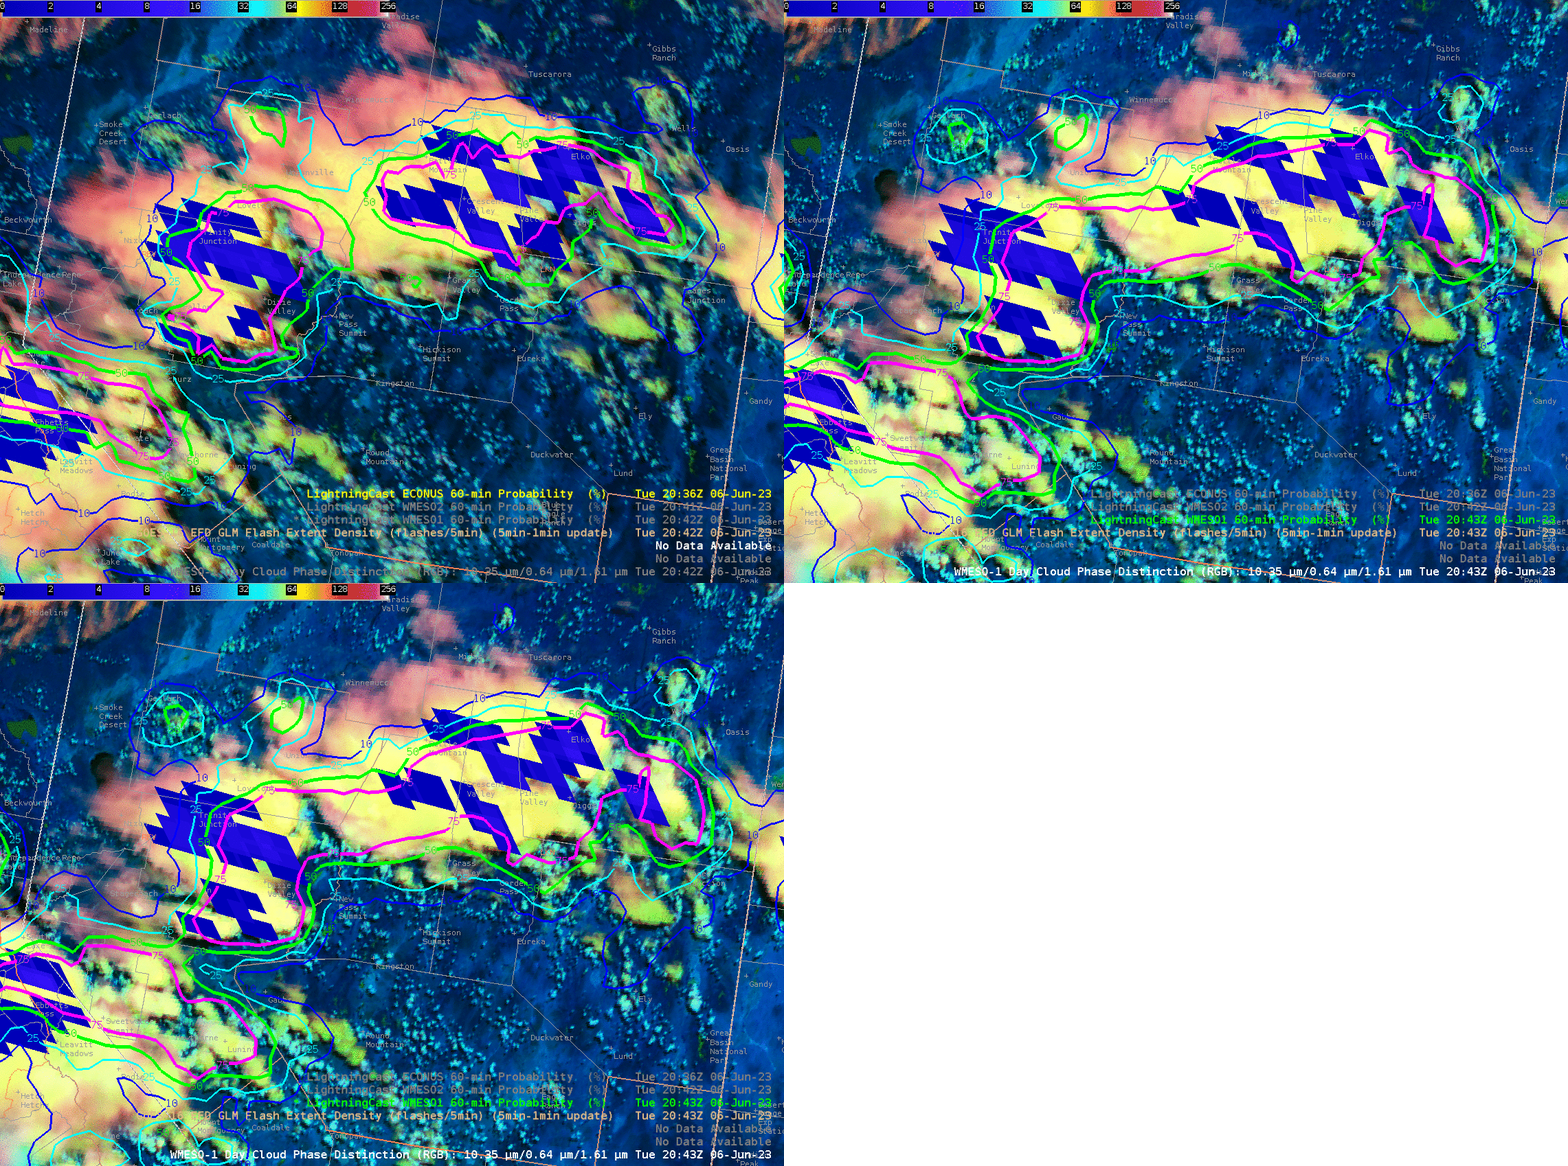
Several pop-up storms developed in the Elko forecast area Tuesday afternoon. To provide DSS for the Elko Airshow, we looked at lightning products, such as GLM and LightningCast (shown here). There were noticeable differences in northern Nevada between the GOES East CONUS and GOES West Meso Sector satellites. This provided a bit of a conundrum of which satellite would be best to use for our DSS event. However, we noticed the trends in lightning probabilities (time series shown below) were increasing for the Elko Airport area for both satellites, so we hedged on that and blended both to arrive at probabilities. In this case, Lightningcast proved to be a useful DSS tool, as lightning was observed within 5 miles of the DSS event by 2056Z.

GIF showing the difference between GOES East CONUS and GOES Meso West products over northern Nevada.

LightningCast time series trends for Elko Airport.

– Bolt and Burton Guster

Tags: None

Evolution of LightningCast Over Southern Montana/DSS Event In Billings

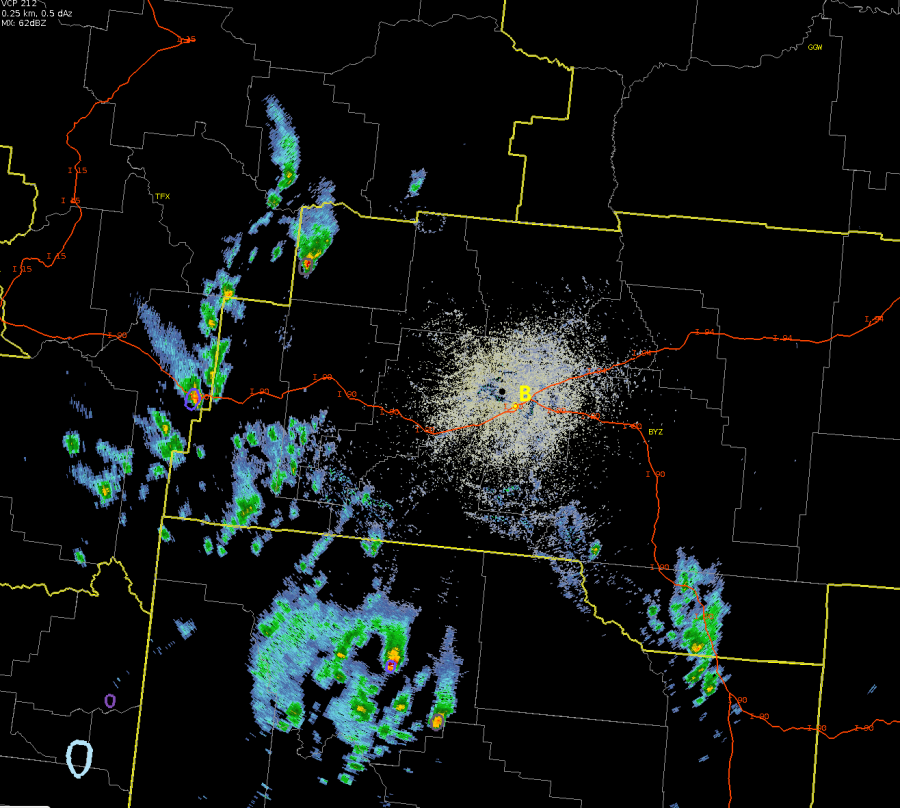
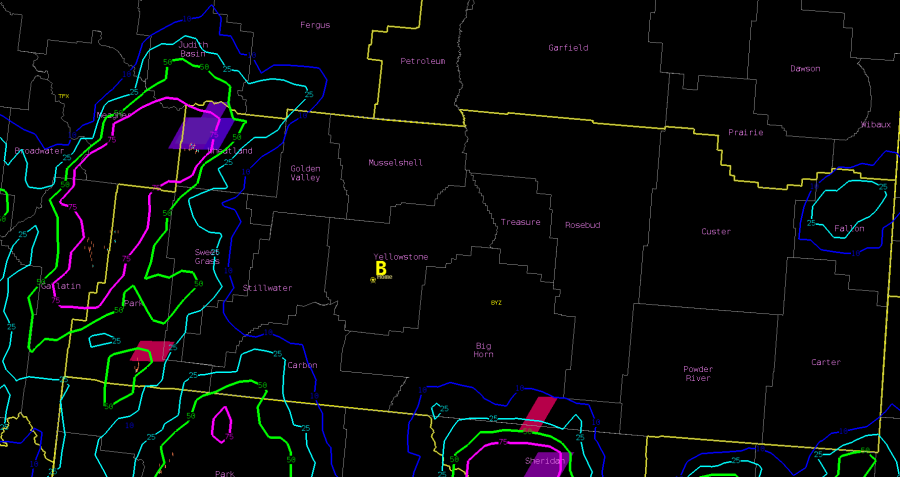
Upper level flow shows continued SSW flow aloft over the region, thanks to deep troughing remaining over the West Coast. Overall forcing through the afternoon is on the weaker side of things, but models show an upper level jet streak nosing into the area. Scattered thunderstorm activity has already developed (below) to the south of Billings in northern WY, and is expected to expand in coverage through the afternoon. The DSS event is noted by the large yellow “B” over Billings.

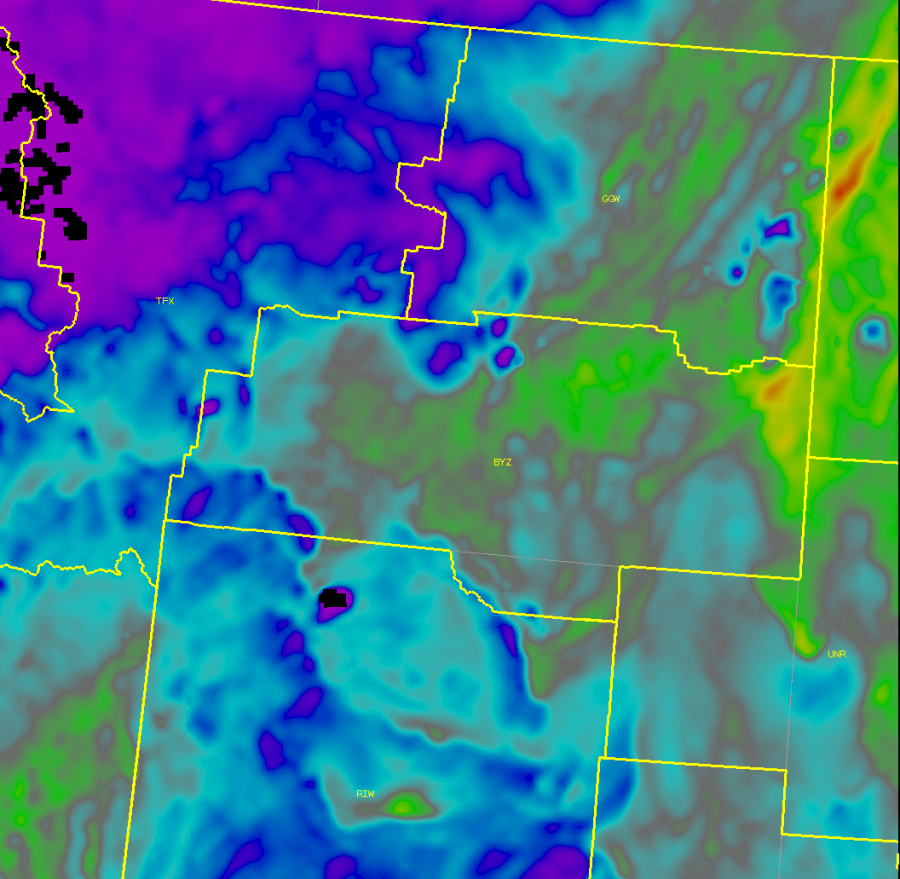
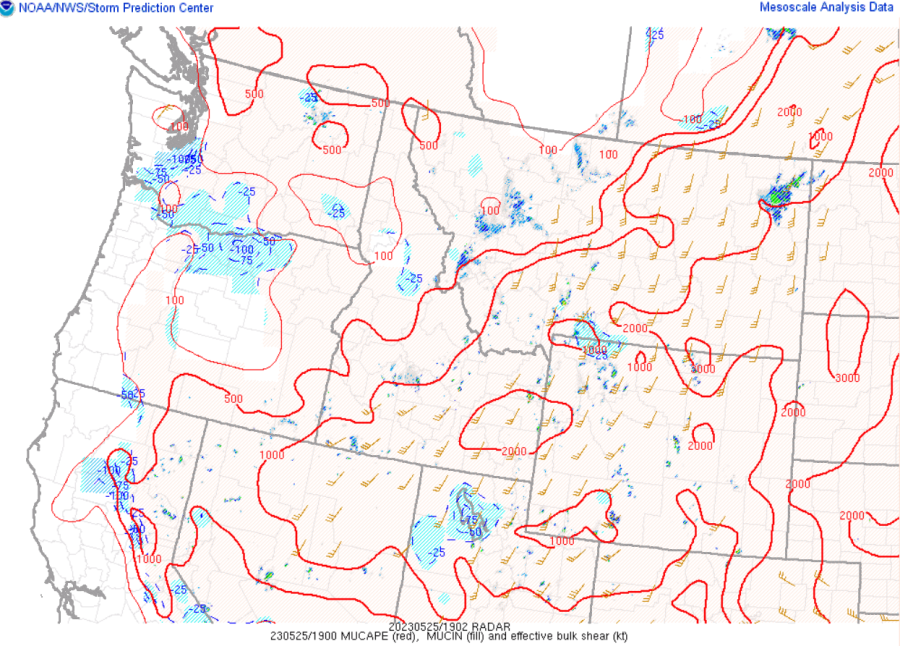
The 14Z PHS forecast output (below) showed 19Z MUCAPE values across the area ranging roughly from 1000-2500 j/kg (with highest values in the eastern areas). Looking further into the mid-afternoon hours, outside of MUCAPE values creeping closer to 3000 j/kg in far NE portions of the CWA, the PHS overall didn’t show any notable changes in values. PHS values of 0-6km shear also matched up fairly well with SPC Mesoanalysis at 19Z, and had values increasing to around 35-40 kts through the afternoon.

Below is the 19Z MUCAPE via the SPC Mesoanalysis page.

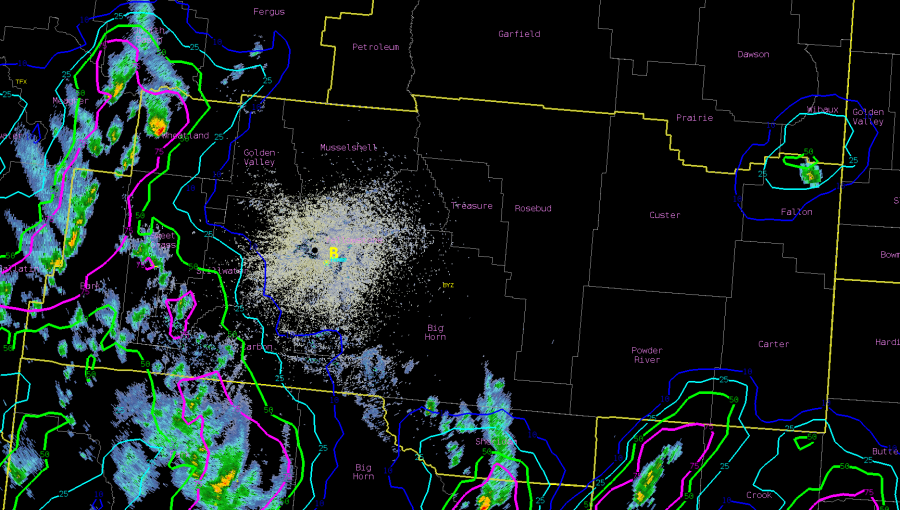
LightningCast right around 19Z showed the 10% probability contour still about 40 miles SSW of Billings at its closest point (below).

LightningCast right around 20Z showed the 10% probability contour still about 30-35 miles W-SW of Billings at its closest point (below).

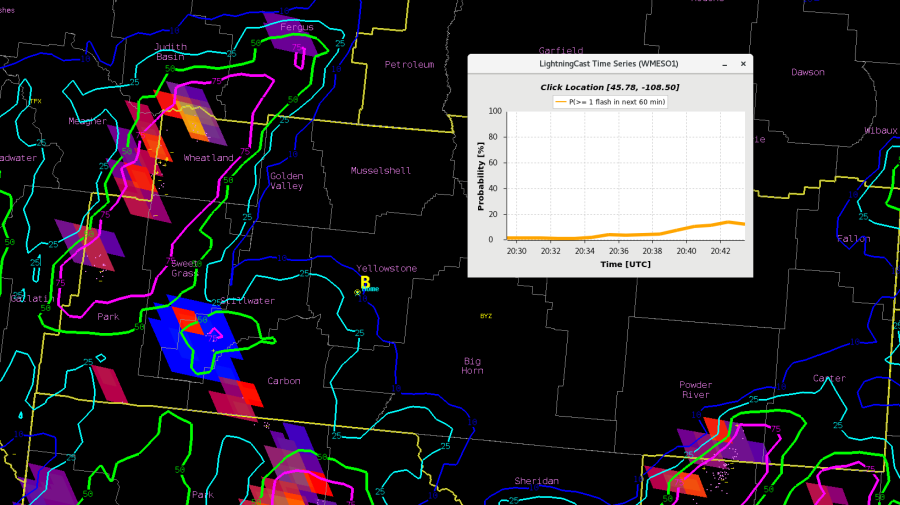
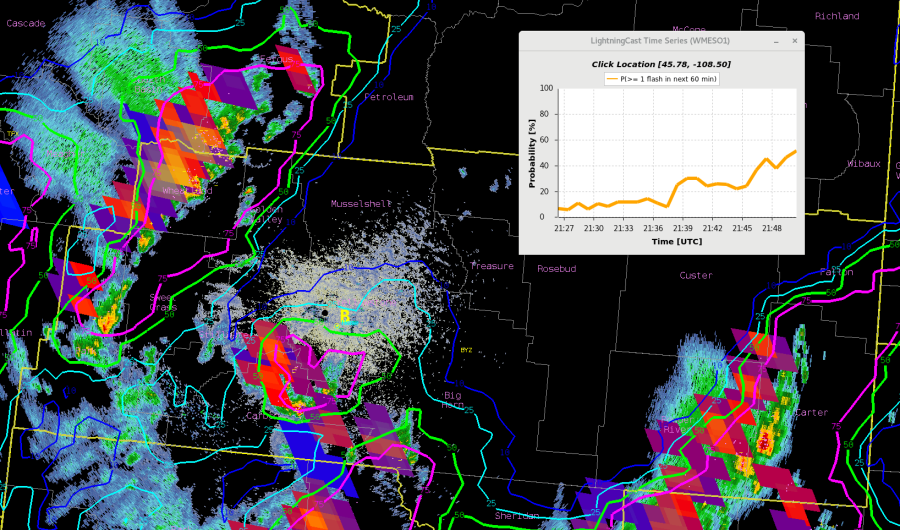
Around 2045Z, the 10% prob. contour reached the DSS event(below), but overall activity continues to be slow to push NNE. The LightningCast Time Series is included to show the trend up to this point.

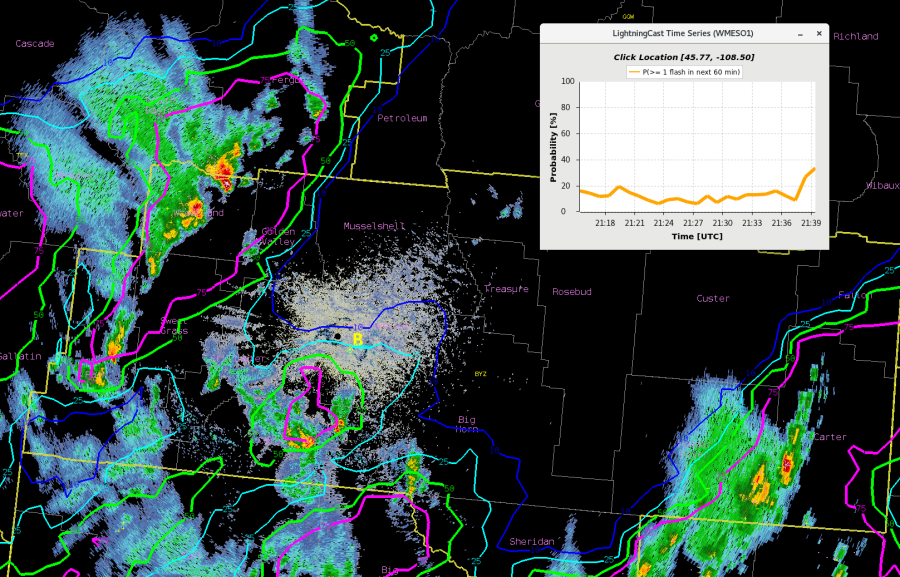
Fast forward to roughly an hour later (~2140Z), there’s been a bit of a jump in the LightningCast Probability/TimeSeries (below), with the DSS event now sitting with a roughly 35% probability of lightning in the next hour.

A few minutes later, another jump up in probability – up to around 50%. Below is an image that has the GLM FED (colored pixels) included with the radar, LightningCast, and ENI Total Lighting Plot.

You likely have already been talking with the DSS contact point, but this jump up in the last ~10 mins may warrant another update, conveying that there is an increasing probability of lightning occurring in the next 60 mins.

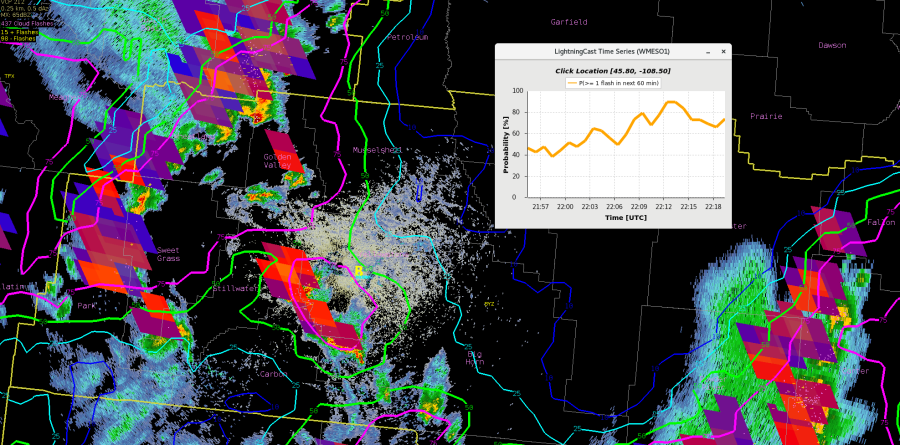
Not surprisingly, the LightningCast probabilities have continued to increase, also shown in the time series. Image is from 2220Z.

What’s the best way to pass along this information to the DSS contact point?

With this type of event, where it’s slow to move in (driven more by the upper forcing vs the somewhat random quicker-developing activity that can occur in high CAPE/low shear  and other types of environments) and no significant changes in the overall environment across the area, perhaps you could wait until it’s closer to 50% or more  before expressing greater concern for the threat of lightning.  In those instances where activity may be quicker to develop/strengthen, it’s not out of the question that values closer to the 25% contour would warrant greater concern. No matter the overall environment, I do believe the addition of a shorter-term probability (lightning within 30 mins)  would be beneficial.

– Bubbles


Tags: None

Using GLM to track thunderstorm life cycles

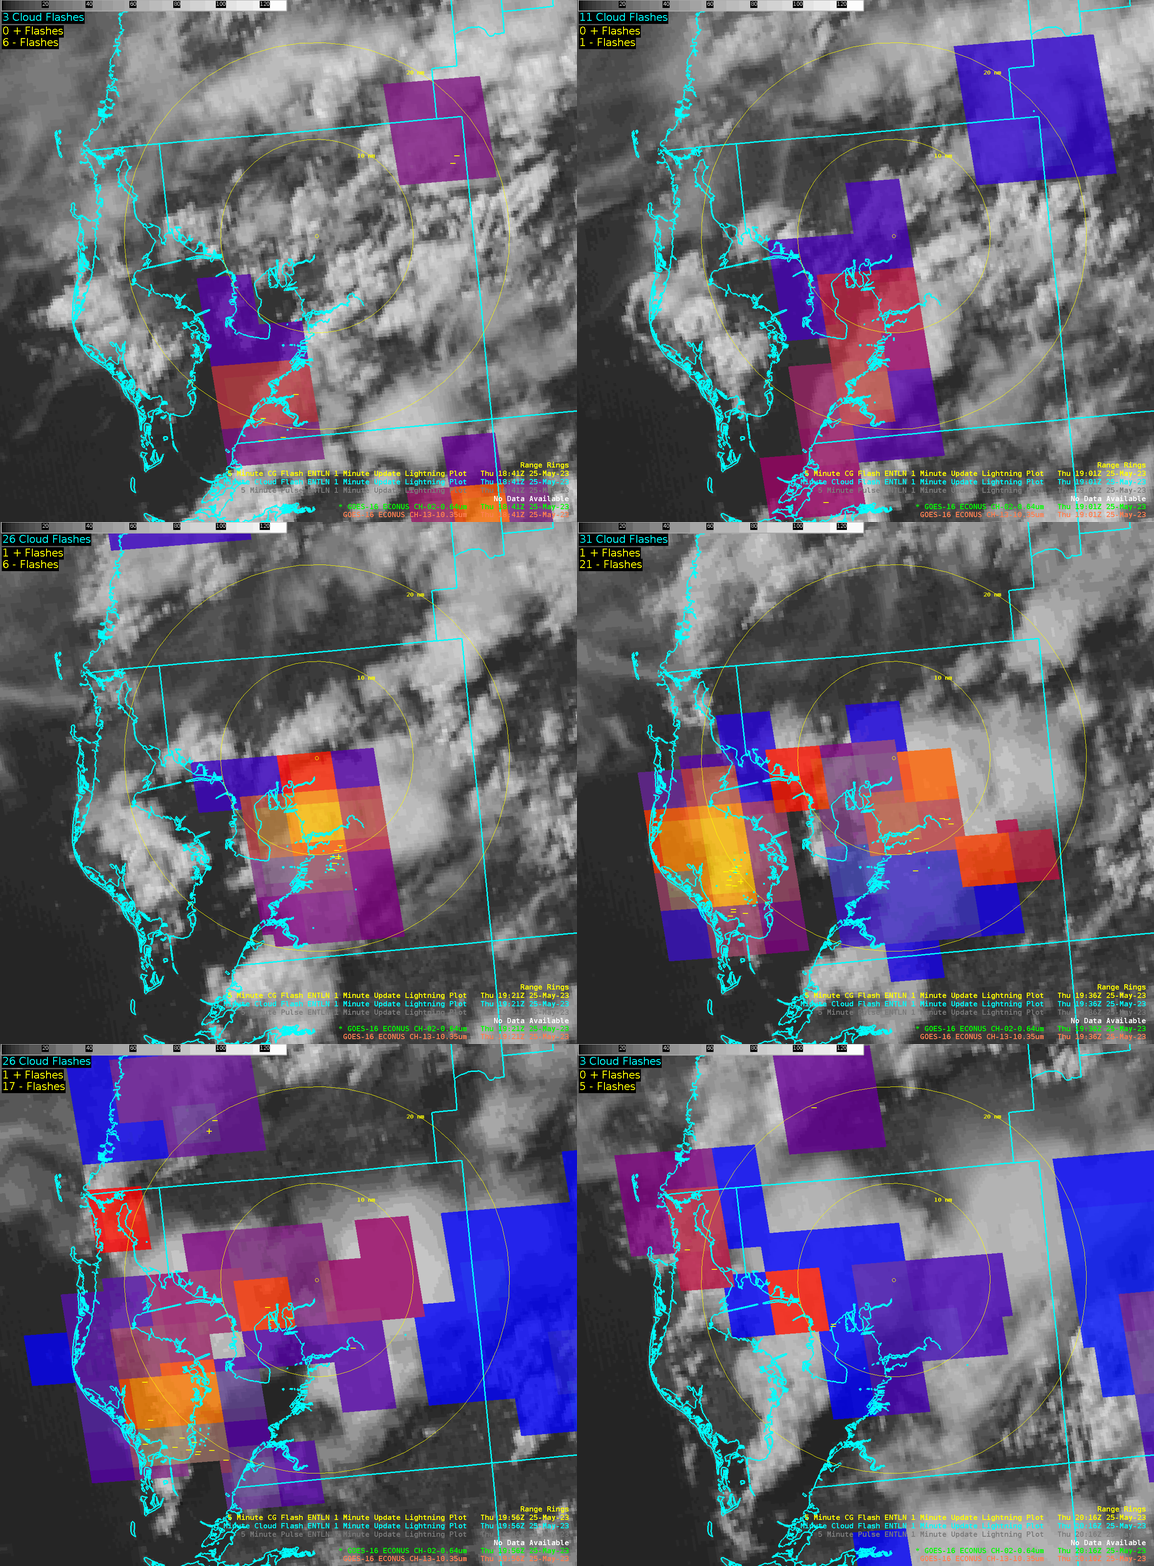
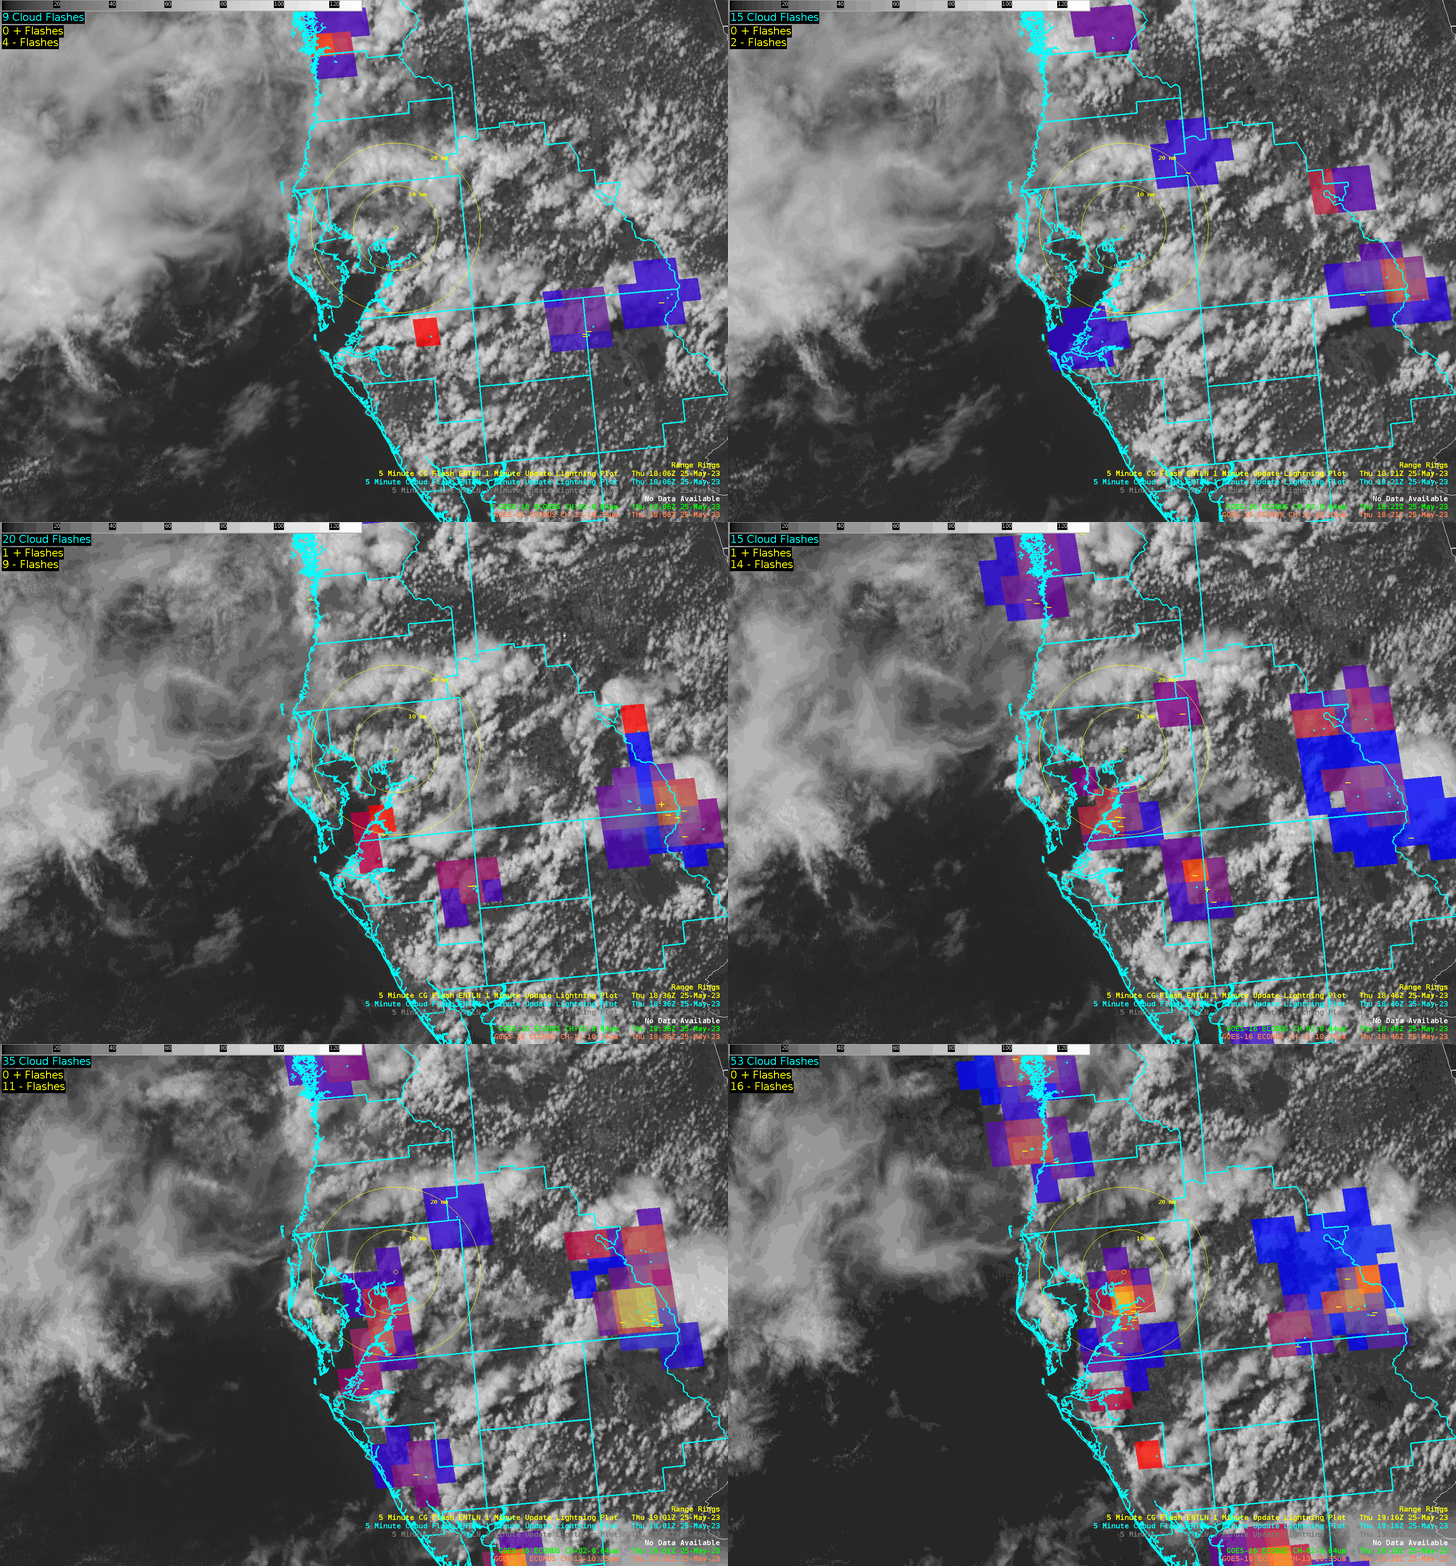
GLM FED/MFA RGB here shows the rapid thunderstorm life cycles in the weakly sheared but highly unstable Florida atmosphere, as reds to yellows (intensifying convection with lots of short cloud flashes) give way to blues and purples (weakening convection with fewer but longer flashes). The range rings circle today’s DSS event, which also highlights the difficult nature of producing storm by storm headlines or products for public safety as the life span of these thunderstorms are brief. The messaging for today highlights the consistently sporadic lightning threat for anyone on the coast or at the DSS site while storms build and collapse over a matter of minutes.

-Joaq

Tags: None

Using GLM to decide to issue an SPS

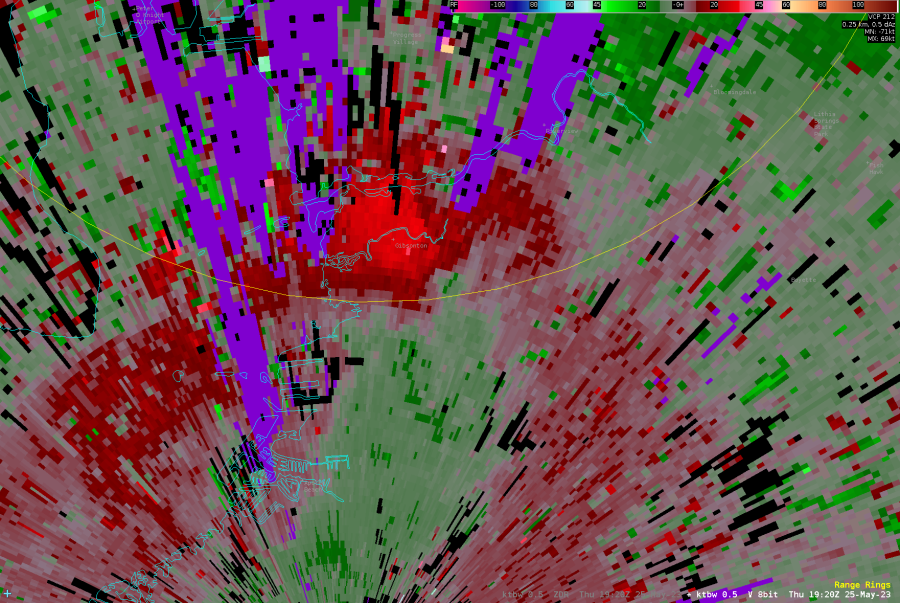
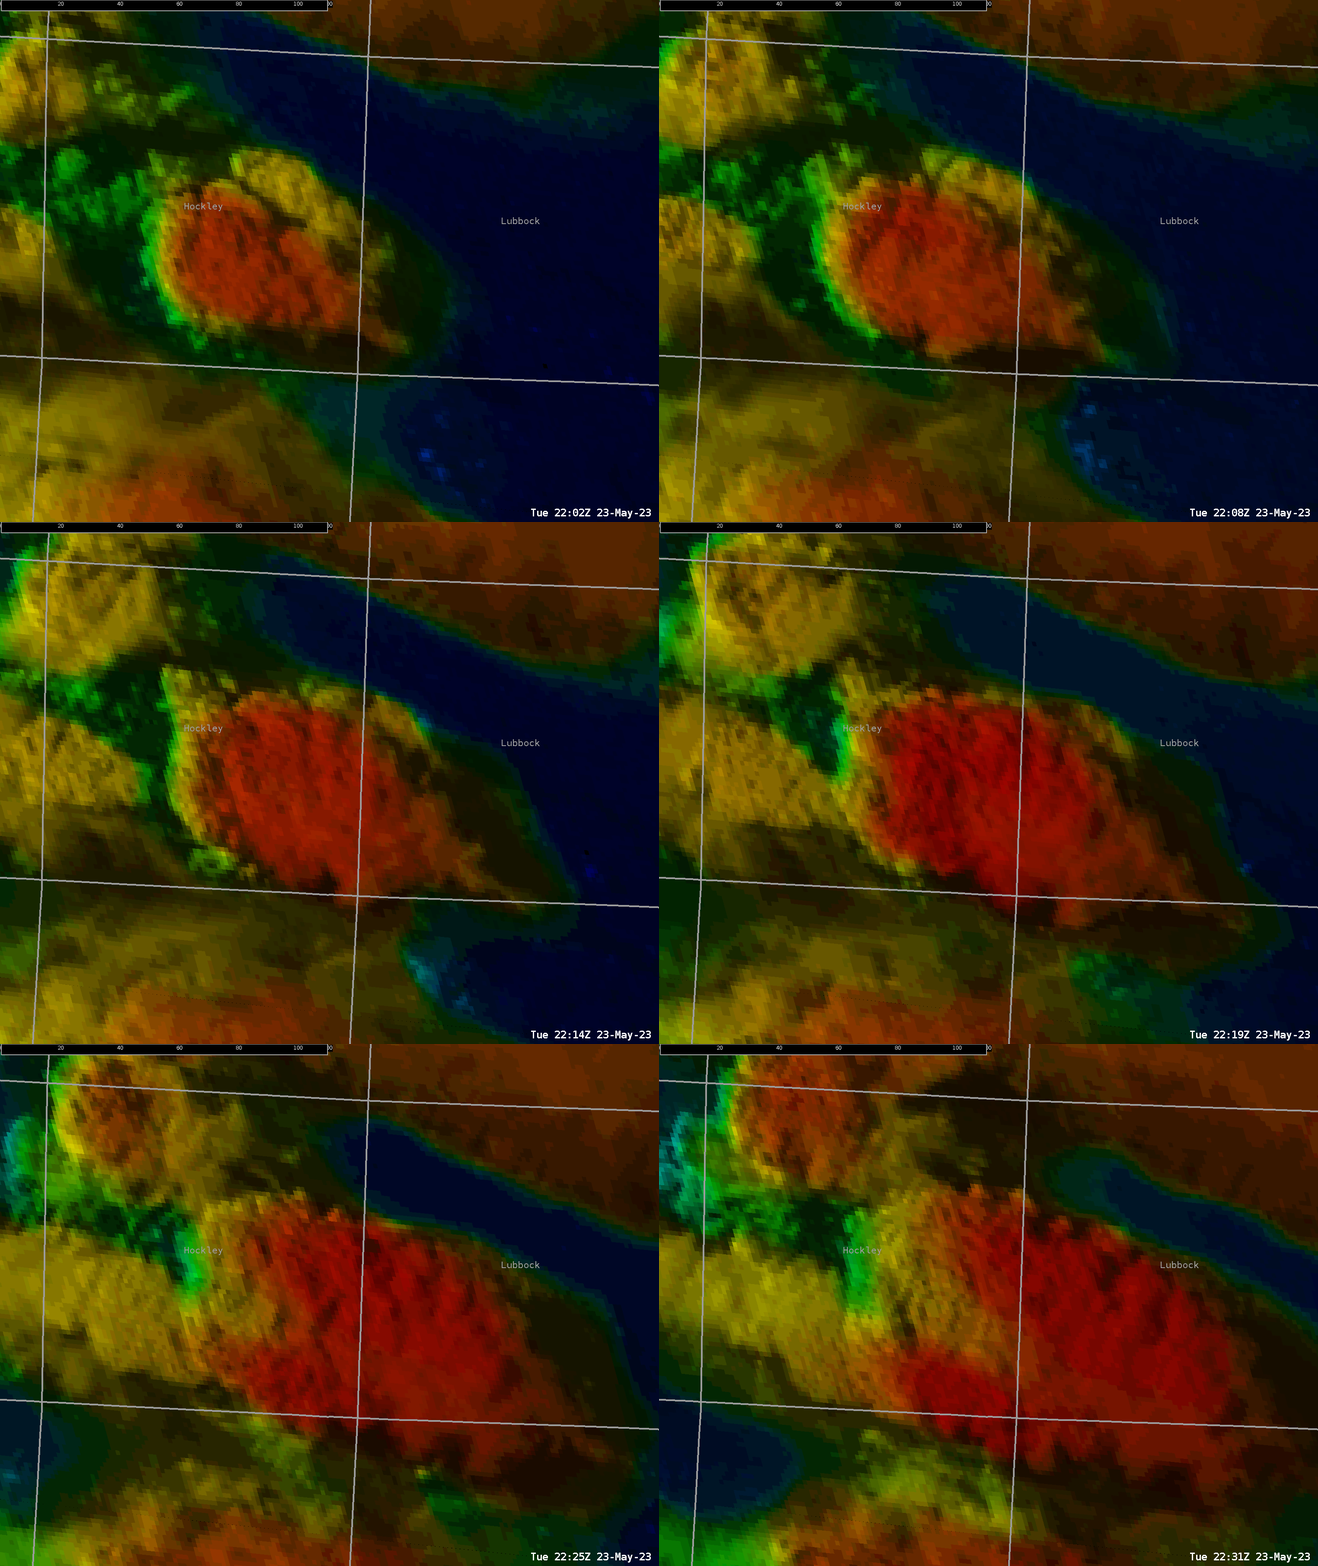
GLM RGB showed the progression of a developing storm near the TBW DSS site this afternoon. Not only was lightning a threat communicated to the DSS site, but KTBW radar depicted a downburst signature as shown below, which prompted us to issue an SPS for wind to around 40 mph, frequent lightning, and heavy rain.  track a developing storm near the Florida State Fair
-Joaq

Tags: None

LightningCast Gives Advance Notice for DSS Event

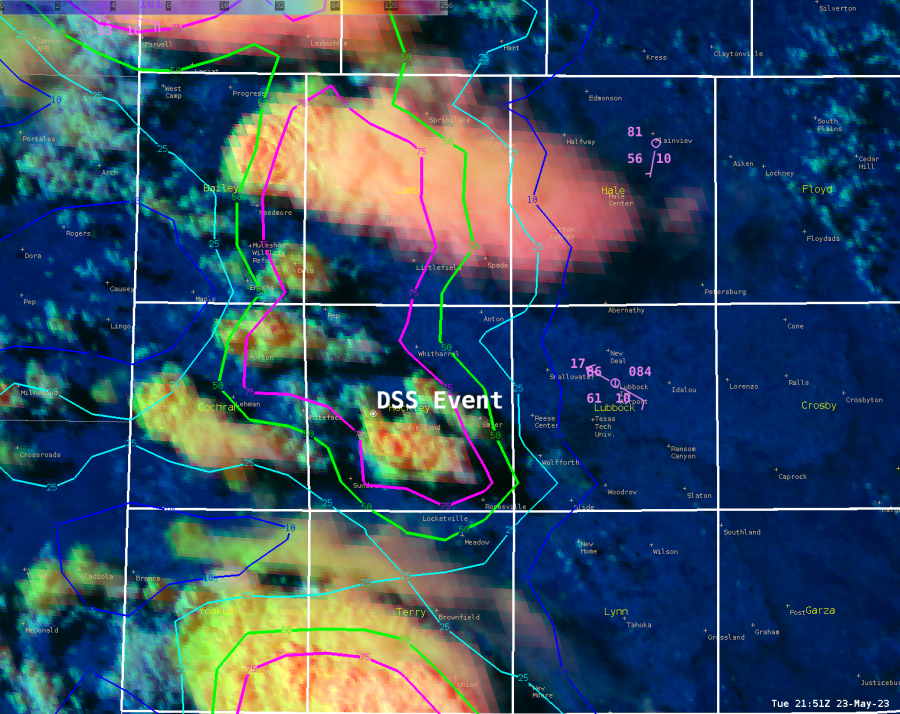
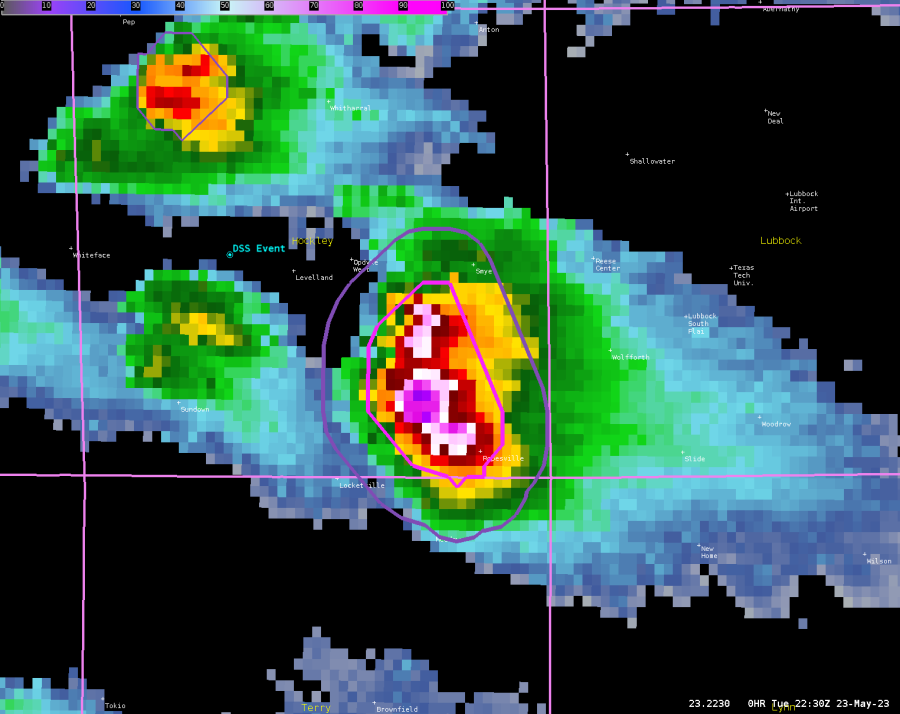
Lightning Cast (parallax corrected) had a 75% contour for lightning within the next hour (screenshot taken at 21:51Z) for our railroad DSS event. Notified the DSS event about the high lightning potential within the next hour. Went back to look at radar and lightning data for 22:50 to 22:54Z and there were CG and CC strikes just north of the Railroad DSS event in Levelland, TX. This allowed us to give them an hour to make any ground preparations regarding personnel.

-Dwight Schrute

Tags: None

Challenge With A DSS Event With Scattered Thunderstorm Development…focus on LightningCast.

Sea Breeze and outflow boundaries in place over the Florida Peninsula made for a tricky forecast during the afternoon hours, as thunderstorms could and would quickly develop just about anywhere along that boundary. Lightning up to this point by far was the main threat from these storms…as most storms were not strong long enough to cause notable hail to be a concern, but with storms having the potential to “die off” quickly as well, wind was more of a concern.

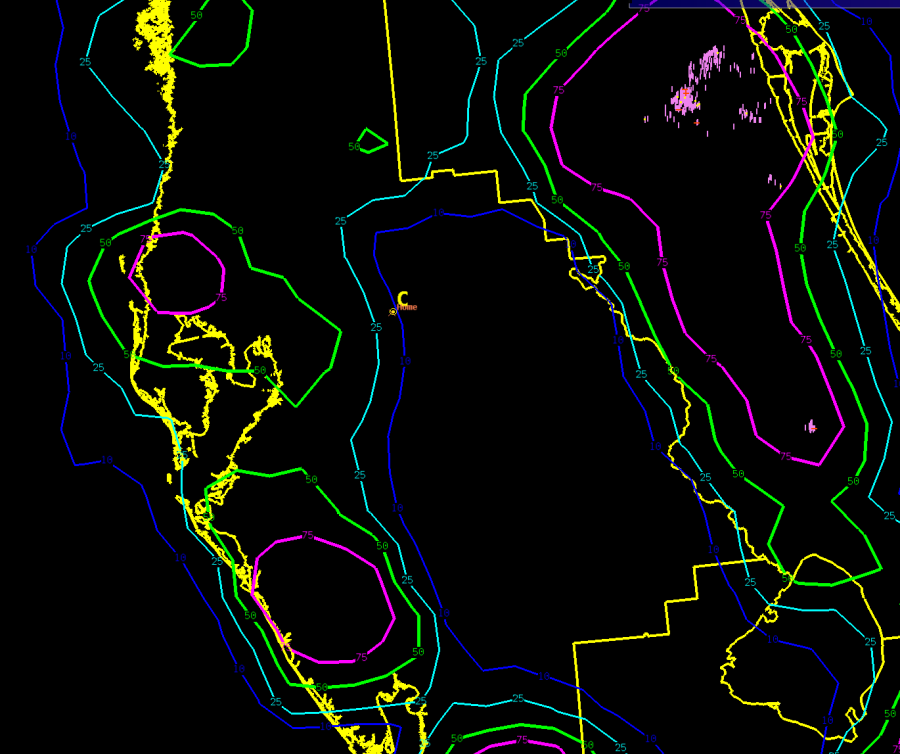
With the initial onset of early afternoon activity, providing DSS support and giving the local contact more detailed information was on the ‘easier’ side. LightningCast around 19Z was showing increasing probability contours of lightning within 60 mins at the DSS site (image below was at 1901Z. The DSS event is noted by the yellow “C”.

By around 2035Z, activity had increased in coverage and drifted northeast, closer to the DSS event, shown below by the increased coverage of ENTLN lightning plots and the 75% probability contour in the area.

The challenge since then is that more scattered/widespread activity has developed (and died off), in what seems at times to be in fairly random areas…but are for the most part tied to the moving outflow boundaries from previous storms (seen in radar image below at 2203Z).

Not surprisingly, as a result of all of this activity, LightningCast over this entire area has been remaining mostly around-above 50%, with many spots at/above 75%.

The challenge is what is the best way to convey this information to the DSS point of contact? Below is an image showing the LightningCast probability contours at 2212Z, along with the LightningCast Time Series for the DSS site (noted with the yellow “C”).

There is an overall lull roughly between 2110Z-2150Z (probability is closer to/lower to 50%)…but it never drops below 20%.  

Personally, looking at this time series and given the environment/set up and evolution of storms so far, I would have a difficult time calling the DSS point of contact and saying the threat of lightning is low…as another storm could develop as soon as I hang up. You don’t want to totally shut an event down, or be constantly calling the point of contact with updates (unless you know the contact likes that much communication). I don’t claim to have the answers, just thinking out loud, but it’s something to think about if using this product to communicate with DDS contacts.

-Bubbles

Tags: None

Observations from BUF on Thursday June 16th

Optical Flow Wind Storm Top Divergence Can Aid in Warning Operations

The storm of the day produced a 2.5” hail stone near Cato, NY.
Strong storm top divergence signals an intense or intensifying thunderstorm. Matched with upper level radar scans, satellite interrogation (clean IR), and ProbSevere, optical flow wind products may be another tool to aid the warning forecaster and/or storm scale mesoanalysis,  Below are the corresponding optical flow wind storm top divergence images approaching 4 PM EDT (3 PM CDT) when the sig severe hail was reported. The thunderstorm of interest is centered just south of eastern Lake Ontario.

LightningCast as Graphical Messaging/IDSS Tool

As the DSS and graphics person for BUF, I took the opportunity to highlight the utility of LightningCast for Graphical NowCasts and DSS graphics. The fairly broad brushed nature of the lightning probability contours at the timesteps utilized for graphics I think is a positive for a few reasons: they show actionable probabilities (10+, 25+, 50+, 75+) that users can understand; the contours are akin to annotations on a radar graphic, so would be a time saver; and finally, broad brushed is a way to prompt users and partners to seek out more information, like real time zoomed in radar data, perhaps calling or sending us a chat on NWSChat, or even simply keeping an eye on the sky and listening for thunder. The parallax corrected product in the images below I feel would be more useful for graphics of the nature shown below. Ultimately, for operational use, there would probably need to be some work done to ensure they are not confusing to the user and aesthetically pleasing.
Graphical NowCasts for our websites and social media
Graphic for IDSS Event

A Case for the Sharpened GLM FED Color Scale Used this Week

Over the course of satellite product interrogation this week, the GLM FED stood out as one of the most useful products.  Below are examples from in/near the BUF CWA at 2043z and 2047z. Note that the top of the color scale was set to 128 flashes/5 min over the grid point vs. the default 256 flashes/5 min in AWIPS. The FED also paired well with the MFA and TOE on this 4-pane procedure.
The color curve used this week really popped and correlated well with frequent ENTLN detections. Another example below from shortly after 6 PM EDT (2202 and 2207z)  shows that there will be instances where perhaps an even small color bar range would be useful.
While the strongest storm at this time still showed up well on the AWIPS default color bar range, the 128 flashes/5 min top end of the range (top right) helped it pop even more and corresponded well conceptually with the ENTLN cloud flash detections. Furthermore, the thunderstorms to the north of the strongest thunderstorm showed up better from an SA perspective, if you have been focusing on the strongest storm for warning ops. The smallest color bar range on the bottom left further enhances the above described effect.

Addendum: GLM Flashes and a more smoothed FED

The excellent COD NexLab Satellite and Radar page added within the past year the GLM flash centroids to their GOES derived overlays. From an apples to apples perspective with respect to the ground based lightning detection network displays, this may be a useful product to add into AWIPS.
\

Addendum 2: Would a more smoothed FED be preferable?

Below are a few web based examples of FED displays.
A case can be made that these smoothed FED examples would be somewhat less obtrusive than the default AWIPS FED display, especially for storm scale interrogation by the warning operator or storm scale mesoanalyst.
– Hurricane84