
Lots of products to look at and test. It’s a daunting task to know if you are looking at everything enough and in the correct way.
Appreciate the interaction with the developers and the openness to questions.
Below is a quick screen capture of the 6/12 19z 0hr NUCAPS MUCAPE (image) with the 19z 0 hour RAP40 MUCAPE contours. The developer mentioned that NUCAPS was good at depicting gradients but in this instance the gradient in the image is more smoothed than the RAP data while also being much less value than the RAP data. This raises questions on which analysis is best? Why? Is that same reasoning valid across the entire domain?
I would like to see observational data used as check point against model initialization. Where could larger errors in the model initialization raise questions about future forecasts. Asking the operational forecaster to quality control initial conditions has been a common ‘task’ assigned to maintaining situational awareness. I would like to see computers help with that task.

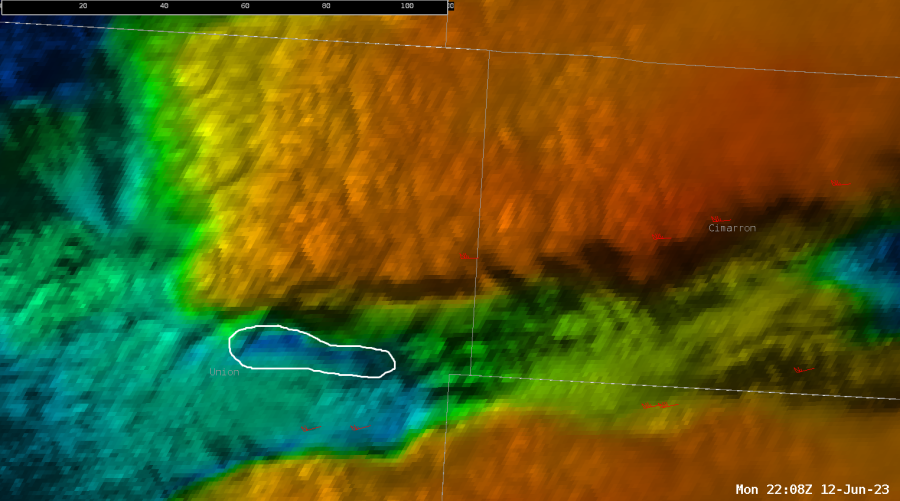
Quick update. Captured this image in the OCTANE data of an ongoing storm (likely supercell) in far NE New Mexico. The narrow corridor of light wind speeds (circled in white) matches my conceptual model of where the forward flank outflow boundary would be located. If this is the correct interpretation I think it would be very useful application in warning operations.
-jbm