
The first day was slightly overwhelming with all the different products to test out this week. I decided to focus on one of the products I was unfamiliar with and that was PHS data. I compared PHS SBCAPE/MUCAPE values from the 12.14z model run to the latest SPC Mesoscale Analysis data. At first glance, the PHS SBCAPE/MUCAPE values depicted were generally higher over southern Colorado and northern New Mexico than the SPC data. However, I did notice a small bullseye of CAPE minimums in south-central Colorado and was curious about why that was depicted (See Figure 1). The SPC data was not as detailed with the gradients and had no mention of the minimum in south-central Colorado (See Figure 2). Thankfully, one of the developers was in the room and mentioned that the model might be depicting storms in that location. I loaded up the composite reflectivity from PHS (See Figure 3) and sure enough, PHS was suggesting storms in south-central Colorado.
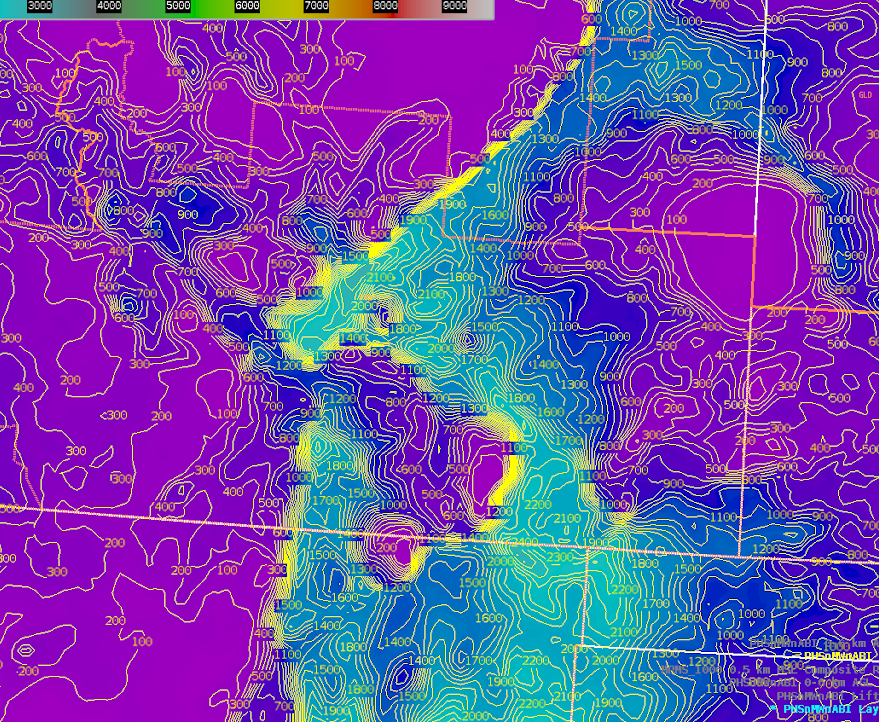
Figure 1: Top image shows PHS SBCAPE at 20z with a minimum in south-central Colorado.
Figure 2: The bottom image is the SPC Mesoscale Analysis at 20z.
The composite reflectivity had the right idea with convection near that location compared to MRMS data. It was slightly further north with the maximum dBz values, but for an 8-9 hour forecast, it depicted the convection fairly well IMO. The PHS did much better with the convection over the northern portions of PUB CWA as it showed a decent line of storms at 22z which matched up well with MRMS. For obvious reasons, this model could certainly be helpful in providing higher confidence in convective storms for various NWS partners and DSS events.
Figure 3: top loop showing the PHS layer composite reflectivity. This is the 12.14z model initialization.
Figure 4: MRMS loop of the composite reflectivity for the hour of 20:00z to 21:00z.
– Podium