SCP and SHIP from PHS is struggling in AWIPS

Not sure if something is going wrong with SHiP and SCP today, and it’s not a one off. Several cycles of  the PHS are behaving strangely. Although STP and MUCAPE appear to be ingested fine.


The values on the website also appear a bit strange with strange jumping behaviors with lack of gradients. An example of the SCP is shown first, and then SHiP second.


Here are the values on the RAP Mesoanalysis.

So not entirely sure what has gotten into the PHS model.

Kadic.

PHS Environmental Parameters vs RAP and Radar for Warning Ops

For this case, we have a data outage for radar, so the closest radar we have to use is KMAF for WFO SJT (no MRMS data either). Was looking at the tornado probability for the storm moving out of Runnels County since the midlevel meso was strengthening. So, I took a look at the environmental parameters from PHS (namely, the SRH). It looked like the storm was ingesting 800-900 m2/s2 SRH, which is a bit high, but the idea that the storm was ingesting more SRH/modifying the environment to possibly increase the tornado potential was useful. Interestingly, the RAP from the SPC Mesoanalysis page shows an area of enhanced 0-3 km SRH (just to the NW of the storm).

PHS environment parameters at 1947Z


SPC Mesoanalysis 0-3 km SRH
KMAF 0.9 deg tilt indicating a very strong midlevel meso

Another thought – Perhaps having either 30 minute data or intervals (30 minute, 1 hour, 2 hour, etc.) might help from a mesoanalysis standpoint.

Forecaster Cumulus

Comparing PHS Reflectivity with the HRRR and MRMS Reflectivity


In this animation we track the progression of MRMS composite reflectivity (right) hourly over the previous three hours compared to the PHS (left) and HRRR (center) reflectivity. This morning convection allowing models were slow to initiate convection compared to reality and it seems that trend is continuing this afternoon with the southeastern progression of ongoing convection. The PHS has been slowest today with the southeastern movement, while the HRRR is a bit closer to reality but still behind (especially in the in the northeastern portion of the CWA.

-Joaq

Speed of Incoming Surface Boundary

One of the things that we noticed was that it appears that model guidance is too slow dropping a weak surface boundary to the south. As a result the convection in model guidance is likely being developed too far to the north of what is likely to actually occur.

Below is the surface winds from the PHS model forecast from the 17z run for 20z. It has a boundary that is near or north of the Texas-Oklahoma border.

In reality, the boundary has been a bit further south. However, this has been the theme of the day, with convection generally advancing east faster than most high-resolution model guidance. Below are the surface observations across Texas showing how much further south the boundary is, in addition to the fact that the wind field is stronger than what PHS is indicating.


The image below has the forecast model composite reflectivity (top right) nearly a degree longitude to the west of MRMS radar reflectivity (bottom right).

This raises additional concerns, as out ahead of the convection, the PHS forecasts an increase in SRH. If this is unchanged considering the current placement of convection, it may indicate a greater probability of storms rotating. The fact that we’re also seeing a sharper boundary present in the wind field suggests we could also see stronger convergence along the band of developing convection than may be indicated within the PHS forecast.

Kadic

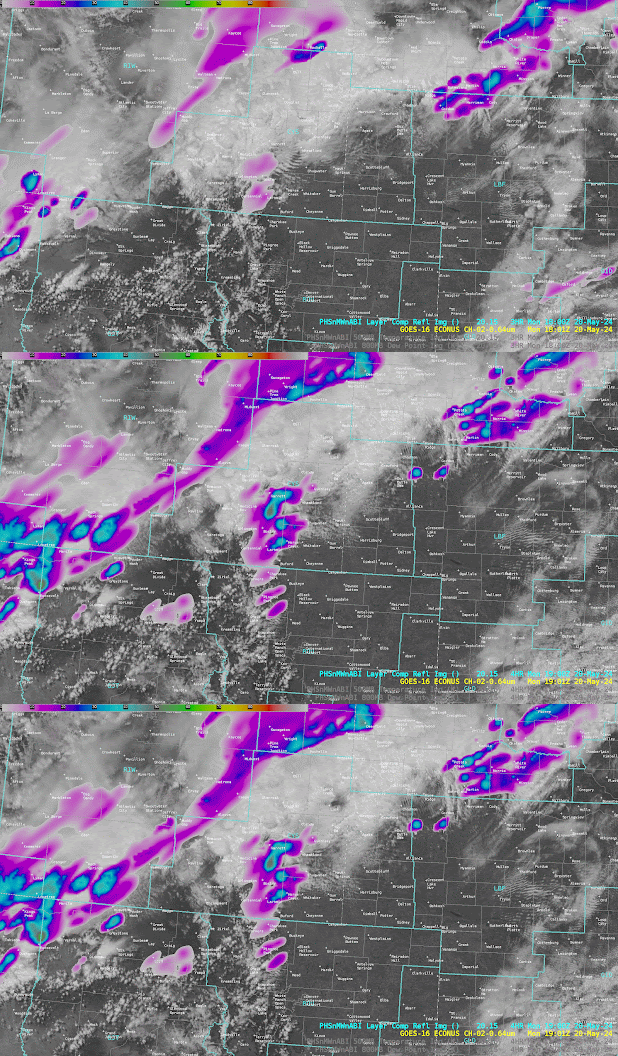
PHS vs Visible Satellite and Radar

PHS was a bit slower with the convection entering the DMX CWA compared to visible satellite initially. However, by 22Z it looks like it caught up!

PHS Composite Reflectivity overlayed on Visible Satellite (right) vs only Visible Satellite (left)

Looking at 22Z (once the timing was better aligned), I was curious how the reflectivity in PHS looked compared to the radar. The overall shape and look of the broken line of storms lines up fairly well (even with the model smoothing things out). The intensity didn’t look like it matched up at first because I was looking for “red”. But, when using the sampling tool and seeing the values, the yellow-green colors in PHS indicated 63-67 dBZ (where the label DMX is in the image).


PHS Composite Reflectivity (right) versus KDMX radar reflectivity (left)


Overall, I think PHS is proving to be valuable with CI (as seen in Day 1) as well as adjusting as storms evolve (such as timing in this case).

Forecaster Cumulus

Collection of Day Two Thoughts

Day 2 has featured more convection, and has been a helpful day testing these products and how they help in warning operations. Although I might not feel confident making warning decisions solely based on any of these tools, I think that each tool provides a valuable piece of information.

Pre-Storm

To keep things short here with all the observations, PHS was very helpful today in showing how the QLCS situation would evolved with several areas of embedded rotation. Having CAPE with SRH together showed how these came together, and in conjunction with velocity highlighted rotation updrafts within PHS. This proved to be a helpful pre-storm evaluation. A few storms began rotating, and then everything began rotating as the PHS model indicated.


Observations Related To Warning

The developing squall had a linear appearance at first. As time progressed with more embedded areas of rotation, this became a lot less neatly organized.

Here is a look pre-warning for a tornado warned cell with ProbTor increasing up to almost 40 before moving off the point.


A zoom in on an impressive overshooting top. Sorry for the reverse loop.


Here is a V-notch like structure. Though it doesn’t correspond with a radar V-notch, it does indicate how strong an updraft this was.


And here’s the radar look of that, which appears to somewhat match the configuration seen aloft.
Interesting Signals


One thing to note early was that the PHS forecast had a lot of convective debris lingering in Iowa that was not present in reality. This does not appear to have impacted the instability parameters very much.

We’d mentioned looking at the dewpoints for the tendency for aggressive convection. But it only seemed slightly high compared to reality.

We did have a blob near Sioux City on Gremlin that didn’t really correspond with any signal on radar, and it didn’t seem to have satellite signal to go with it. Not sure where it came from, but we were able to see it was erroneous.


Here’s a look at GREMLIN with waves and wobbles following the GLM lightning.


Here’s another fun look at where it seemed the convection on the northern flank may have affected GLM quality with values decreasing on the north side. Note the reversed image loops.
Here’s an instance where GREMLIN’s max intensity happened before a lightning jump. Unfortunately this is reversed, but GREMLIN struggled to resolve an intensifying storm in the middle of the line.
Here is an example of GREMLIN losing a cell in 3 surrounding cells.

Kadic

Terraced SBCIN PHS Product in SW Kansas

At 22Z (5hr forecast) the PHS SBCIN product was showing a terraced appearance in SW Kansas. Maximum values were above 350, dropping to around 100 (blue/purple) a couple counties to the north. Between the two, there is the appearance that SBCIN decreases then increases again. Wanted to document this to see if there is a known cause for this appearance in the PHS data.


–Insolation

End of Day 1 Thoughts

Thoughts at the end of Day 1…

The LightningCast product I think would be VERY useful for DSS. Overall, when seeing it perform in real-time, the increasing LC probabilities seem to eventually correlate well with GLM flash density. I look forward to using the DSS form this week and seeing how that works for specific sites.

The GREMLIN product seems to be a great way to see the overall picture of precipitation (say, for a region). I think it struggles with precipitation intensity a bit (>45 dbZ) both for storm cells and for heavy stratiform precipitation. At the “storm” level, I have seen instances of the model not following the evolution well (either too intense or not enough).

For OCTANE, it was easier to pick out an example of CI and divergence with the IR versus the Visible products. I could use the direction product on its own in operations, but I really like having the speed, direction, and cloud top divergence all together in a 3 panel to identify convection.

PHS did a great job today identifying convective initiation when overlayed on visible satellite imagery. I look forward to seeing how this performs in other areas of the country this week.

Still learning how best to utilize the GLM DQP; but, when looking over Cuba, I was able to better understand how it locates areas where the data might not be the best. I hope to learn more about this product through the week and see more examples of its application.

Forecaster Cumulus

PHS Forecast For Supercell in Northeast Colorado

Have been looking at PHS data and forecasts in northeastern Colorado. In simulated composite reflectivity (bottom right), there is an indication of a supercell (perhaps right-moving) tracking eastward toward the CO/NE/KS triple point. PHS indicates that this supercell will be tracking into an increasingly favorable environment, and by 02Z, it will be entering an area with much larger CAPE and a nearby local maxima in STP.


Using more traditional mesoscale analysis (such as SPC) there are indications that this forecast is sound. For example, the 6hr SPC mesoanalysis forecast (valid 04Z) shows a supercell riding the northern gradient of an STP bullseye. Knowing that it’s often not the bullseye of a parameter to be concerned about, but rather the northern gradient, this has raised my interest as a forecaster.


To me, the PHS data provides additional confidence in the potential for this storm to become quite strong a few hours from now. Based on mesoanalysis, this storm could be capable of producing all hazards, with hodographs (SPC meso) and STP (both SPC meso and PHS) suggesting a tornado threat is absolutely there. I would probably use this information to start adjusting messaging, in sort of that in-between watch-and-warning paradigm.

–Insolation