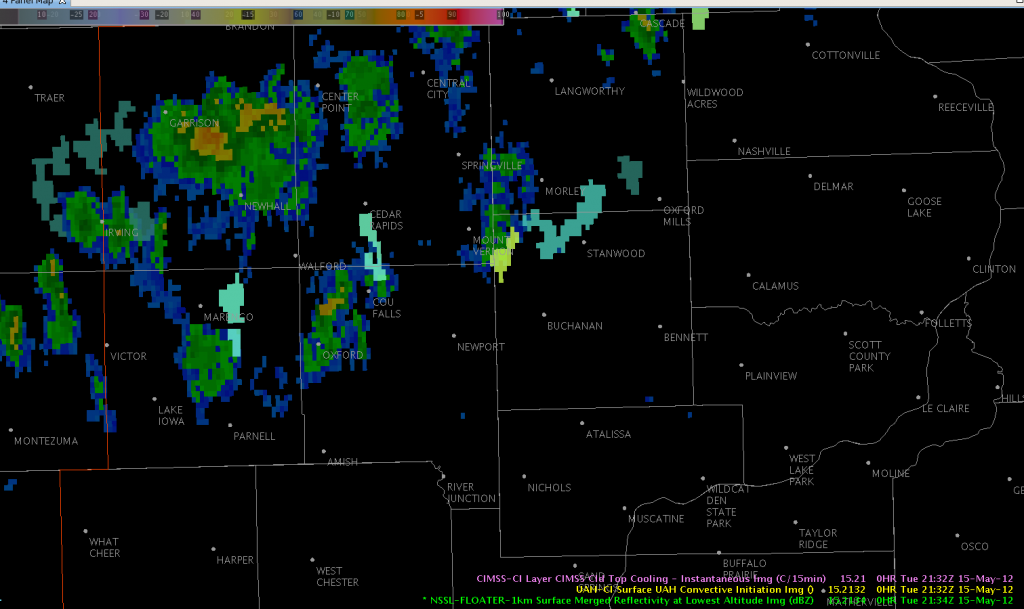
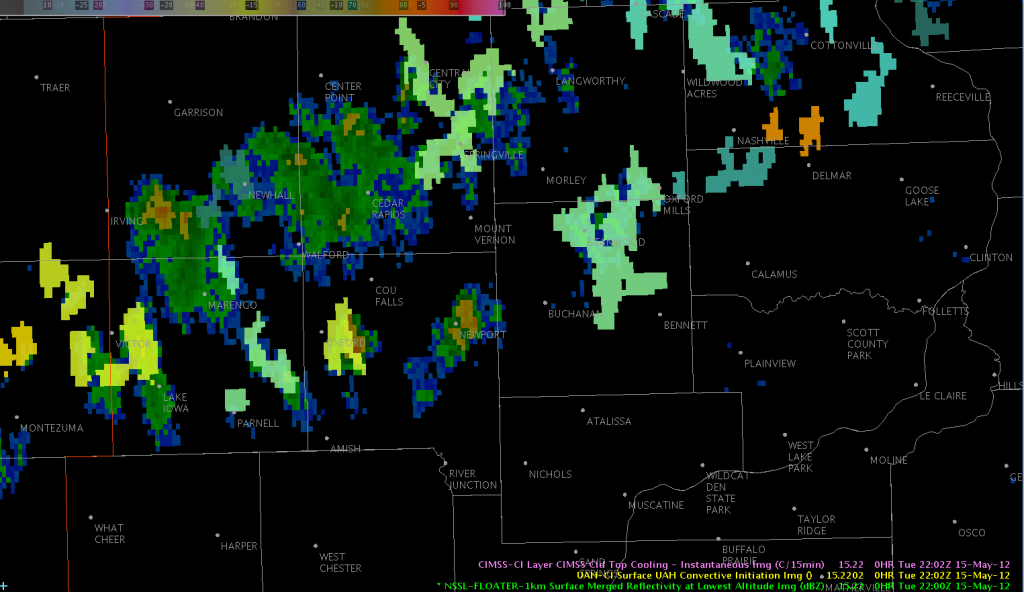
While thunderstorms have not been as impressive over Iowa, Illinois, and Wisconsin, the UAH convective initiation and UW cloud-top cooling algorithms have been increasingly active over the last hour. To track their effectiveness compared to radar, I overlaid the MRMS merged reflectivity at lowest altitude product with the UAH CI and UW CTC all on the same image (something that wasn’t available with AWIPS 1). There was an interesting evolution with the UAH CI starting with the 2132 UTC satellite image, when it flagged an area of CI near West Amana, IA (south of Blairstown) with a 28 on the new Strength of Signal scale.

By 2144 UTC, a 20 dBZ shower had developed with that CI object. By 2200 UTC, CI was up to 44, and the radar reflectivity was up to 48 dBZ.

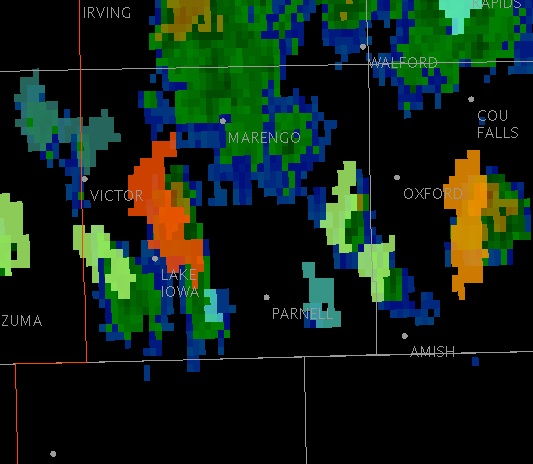
Shortly thereafter it maxed out at 63 CI SOS; the cell’s reflectivity maxed out between 2226-2234 UTC at 52 dBZ.
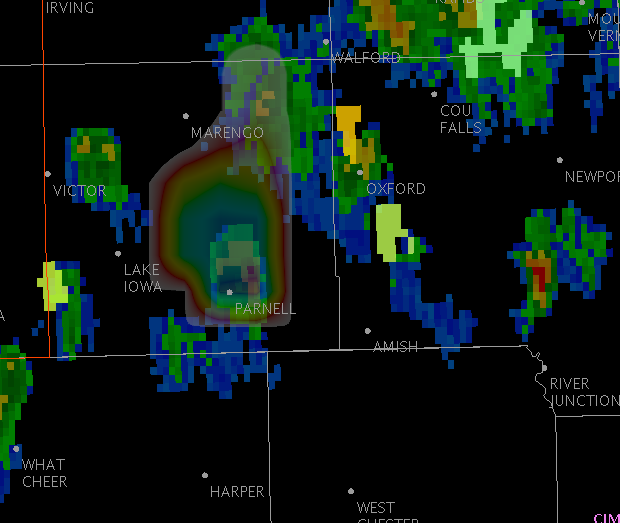
A neighboring storm near Lake Iowa triggered both the UAH (74) and UW (-13 C/15 min) algorithms; it too maxed out around 50 dBZ but was shorter-lived.


Viewing the CI and CTC data simultaneously with radar imagery allows forecasters to make direct comparisons to their most frequently-used warning tool.
