MLB: tornado warnings north of Cape Kennedy

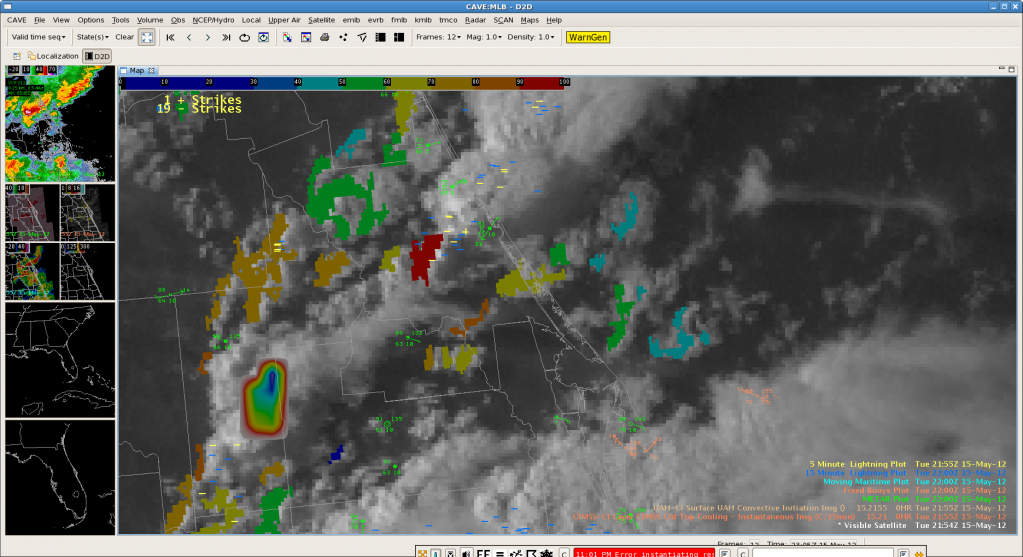
A storm cell over Volusia County, Florida apparently ran over a sea-breeze front and developed a lot of rotation.  A hook echo on the reflectivity and strong gate to gate shear was quite evident on Melbourne’s radar.  We had been monitoring MRMS data including reflectivities at -10C and -20C.  Looking back at Convective Initiation, there was a strong signal at 2154z.

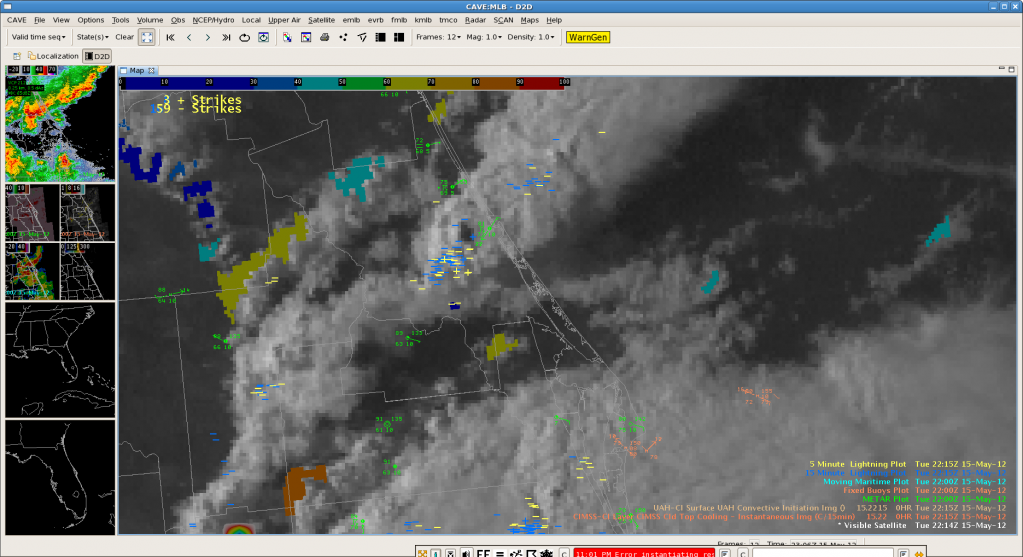
Twenty minutes later the satellite picture and NLDN lightning data looked like this:

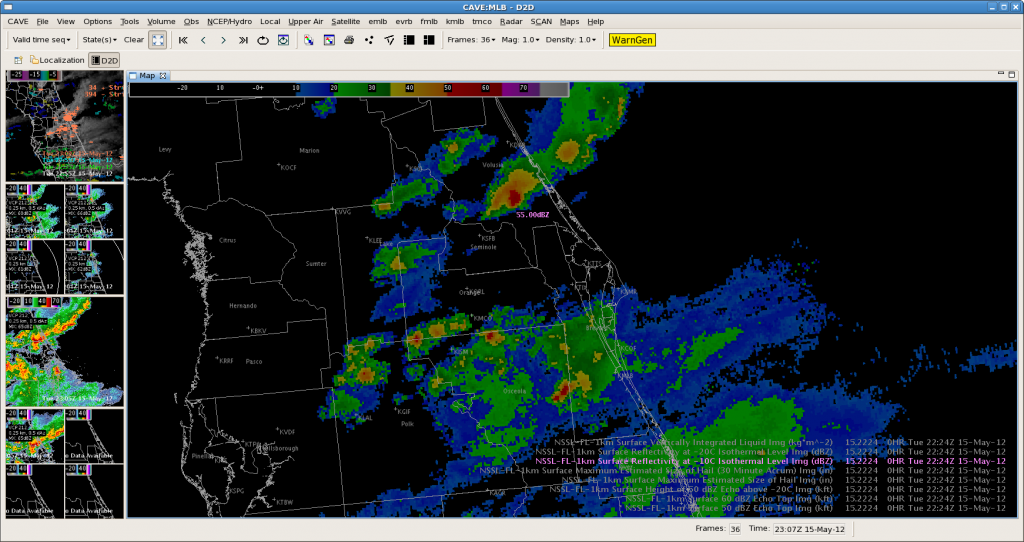
MRMS data at 2224z showed 57 dbz echoes at the -10C level.

By 2225z, velocity data from Melbourne’s radar compelled us to issue a tornado warning.  Time from the first Convective Initiation signal to issuing the warning was 30 minutes.

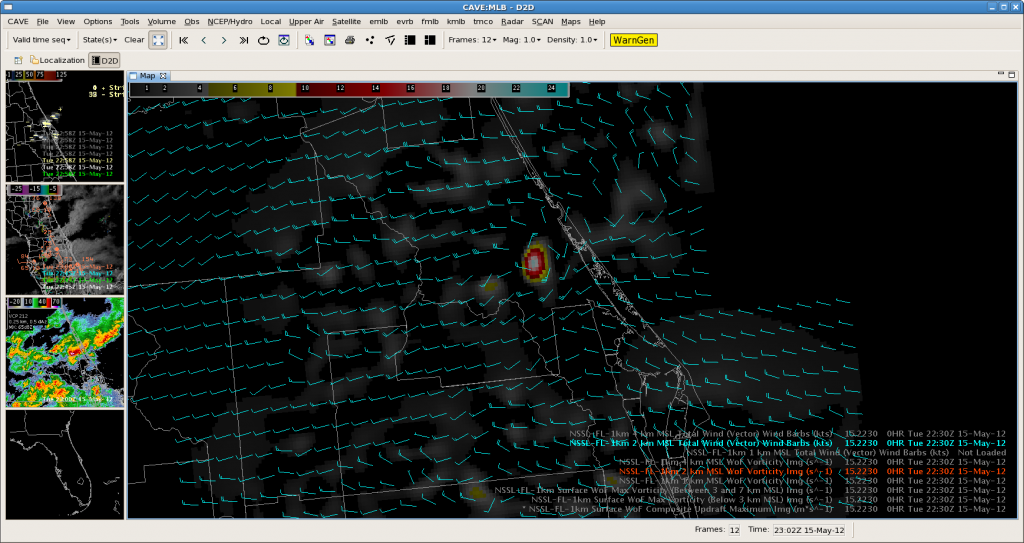
After issuing the warning, we got the 3DVAR domains set up properly and here is a screen capture of the 2km vorticity and winds for the storm of interest.

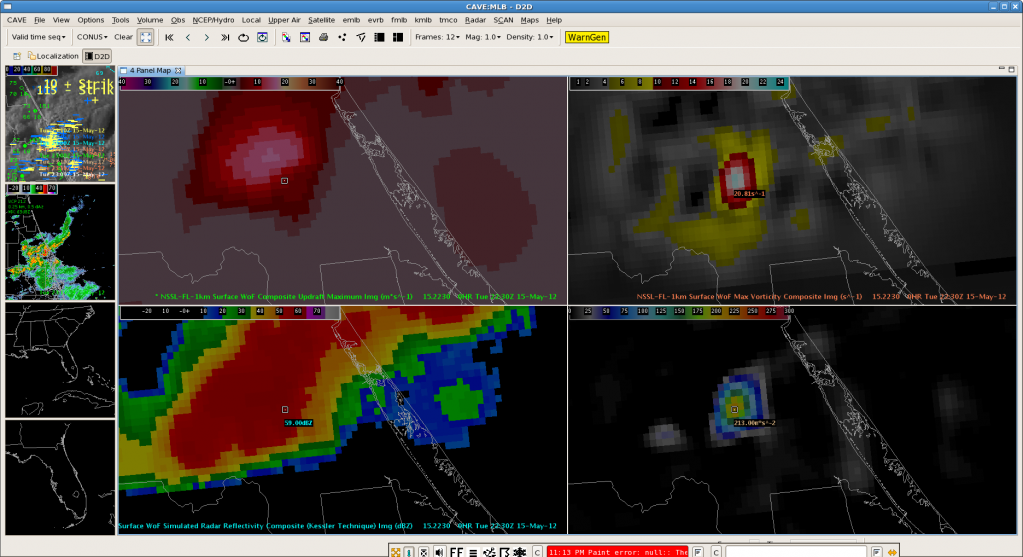
Here is a four panel of various 3DVAR data for the storm at 2230z.

At the top of the hour, the storm was still quite organized, and a second tornado warning was issued.

Dankers/Ruthford

Moved to MLB

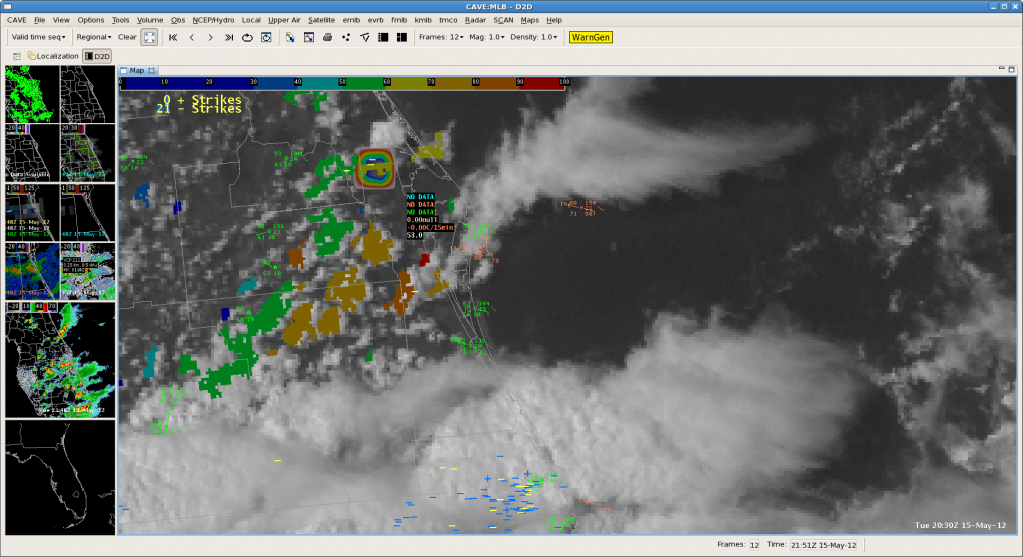
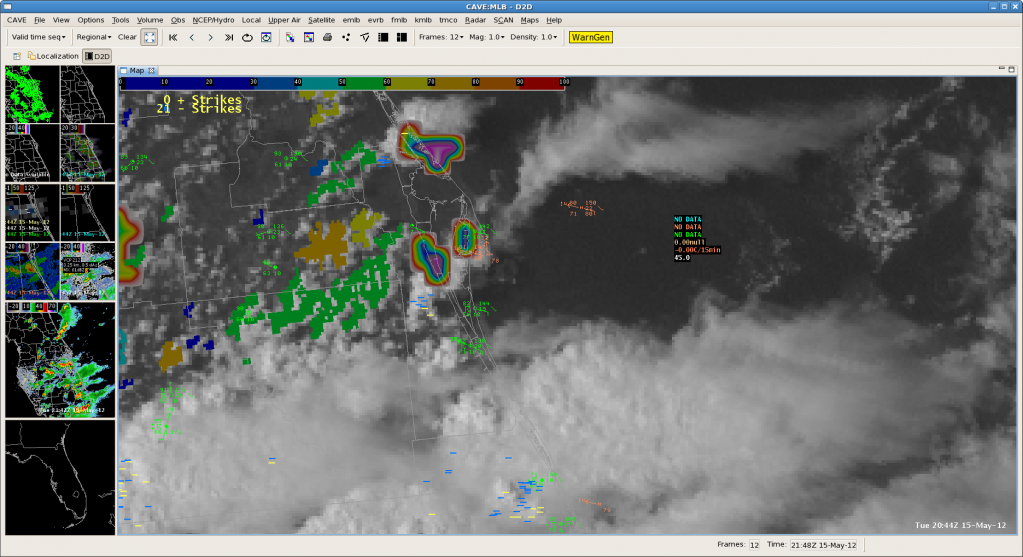
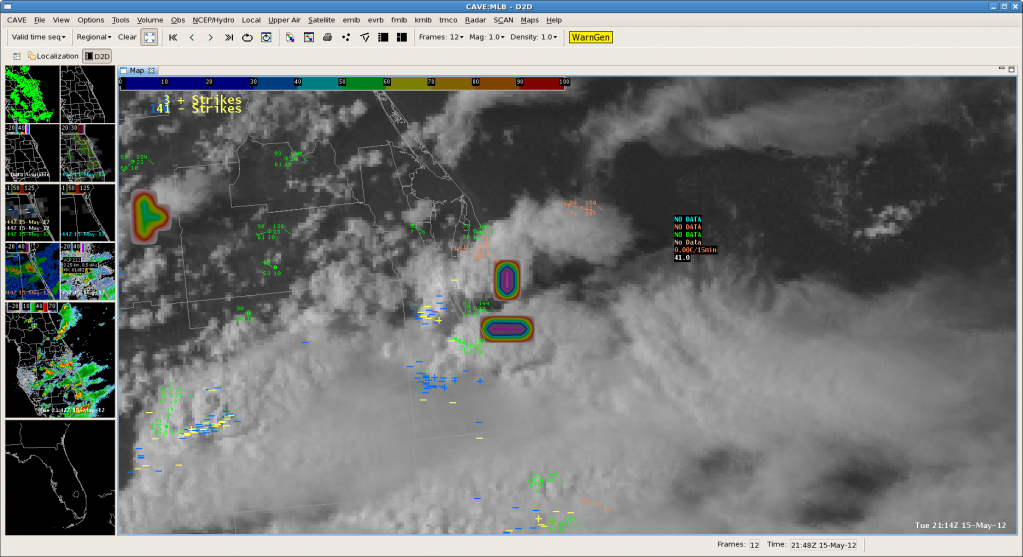
Here is a nice example of the two CI products and a healthy storm that formed in Florida.  We had just changed CWAs so it was more a matter of going back and seeing what they said rather than using in real time but they do show indications of a rapidly developing storm. See the red 95% blob (UAH CI product) on first image, the UW cloud top cooling on 2nd and storm getting big on third.

NSSL-WRF SimuSat Prompts Move to DVN

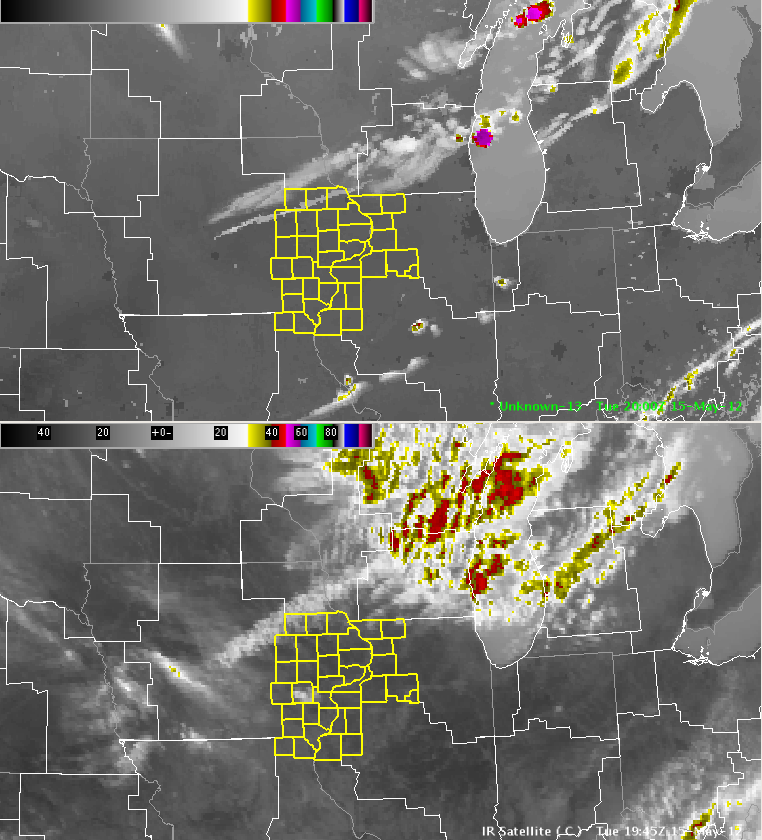
The simulated satellite imagery based off the NSSL WRF is handling a cold frontal passage in the Midwest quite well this afternoon.  The 2000 UTC comparison between the WRF “SimuSat” and observed IR image:

NSSL-WRF Simulated GOES-R IR Satellite (top) vs. Observed IR Satellite (bottom) at 2000 UTC 2012-05-15

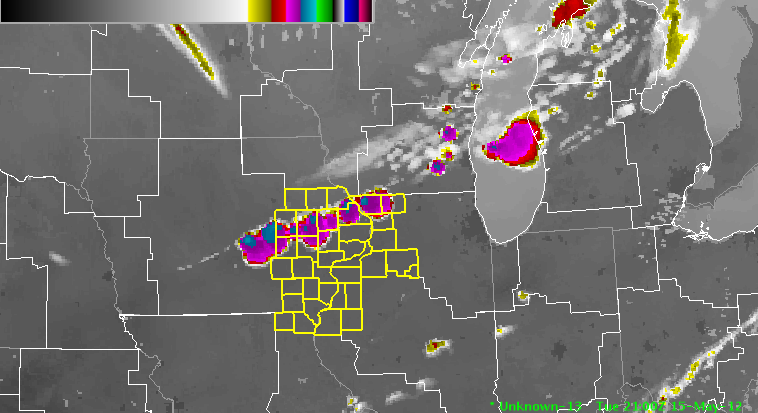
The NSSL-WRF simulated satellite imagery suggests that storms will erupt over the next hour:

NSSL-WRF Simulated GOES-R IR Satellite (top) vs. Observed IR Satellite (bottom) at 2100 UTC 2012-05-15

This model output, combined with hits from the UAH Convective Initiation product in the Cu field along the front, has prompted the RNK group to shift domains to DVN for the rest of the afternoon.

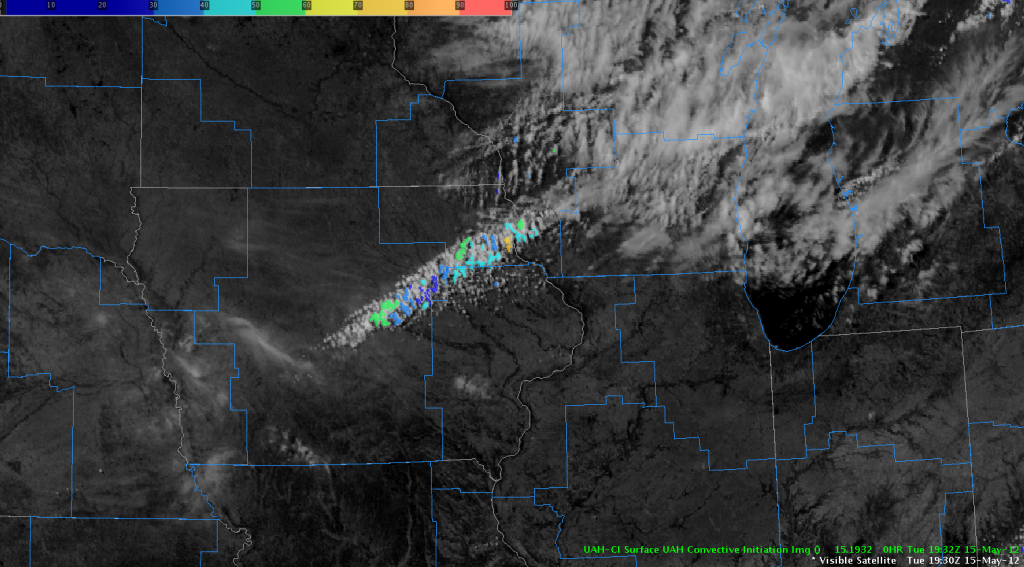
Visible Satellite and UAH CI Product, 1932/1930 UTC 2012-05-15

RNK 19:15UTC

Although this was outside of our CWA, the CI product did a nice job of detecting a developing storm along the sea breeze front on the Carolina coast.  At 18:15UTC, CI indicated a 90% (red) area.

45 minutes later, at 19:00, the visible image showed a full-blown storm with a wide anvil.

Weak Convection in the RNK CWA

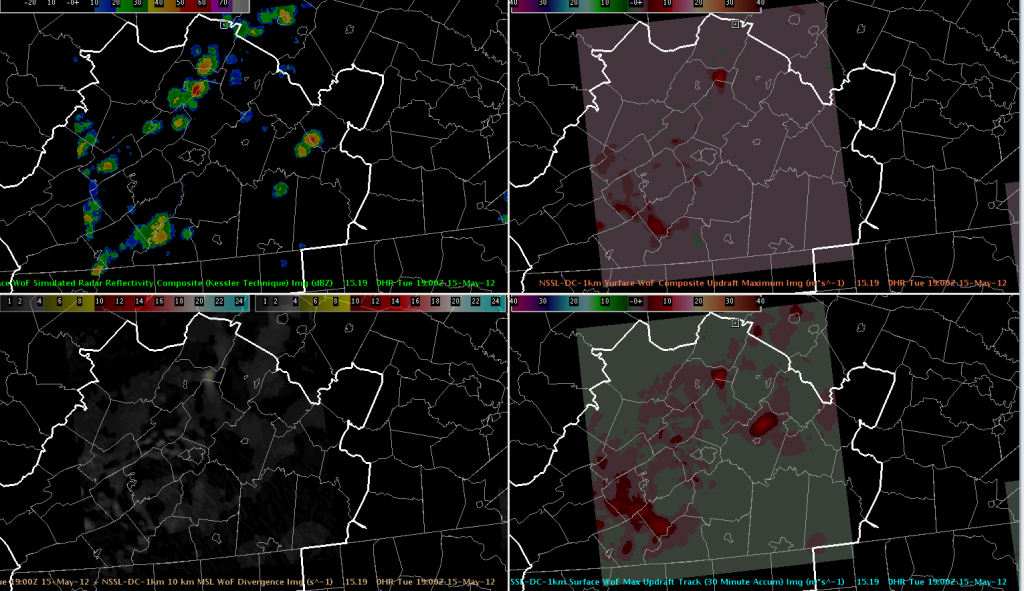
We are monitoring convection in the RNK (Blacksburg, VA) CWA this afternoon, but so far the development has been rather weak.

The 3D-VAR analysis has been useful for monitoring updraft intensity and anticipating possible stronger updrafts (top-right indicates instantaneous updrafts, bottom-right indicates 30-minute updraft history).  However, none of the strong updrafts have maintained themselves beyond one “scan”.

RNK 3D-VAR valid 1900 UTC 2012-05-15

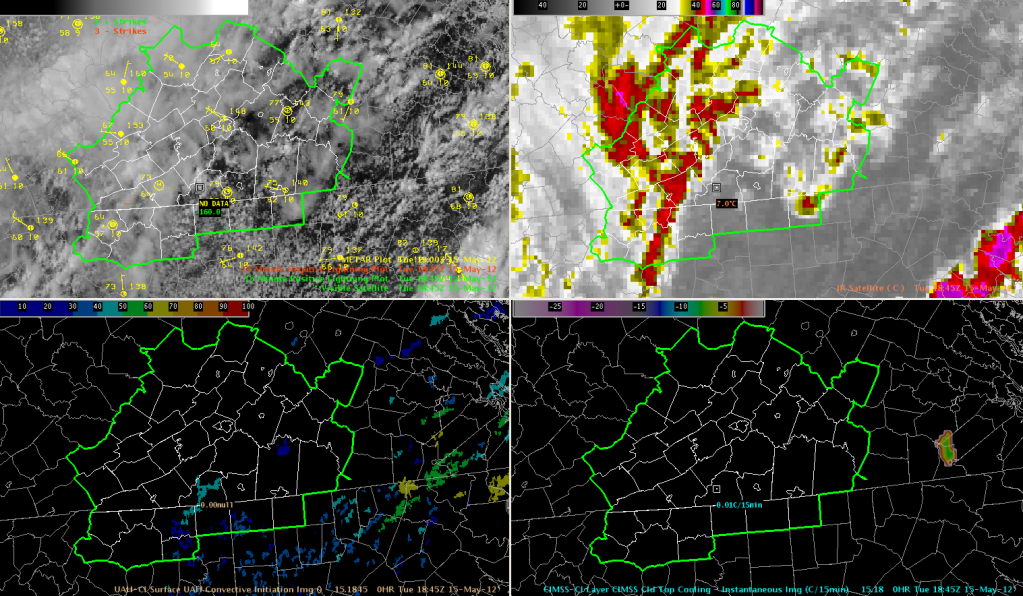
The convective initiation algorithms have struggled due to all of the cirrus blanketing the northwestern half of the RNK CWA, but some clearing in the southeast has produced some CI from the UAH algorithm.  Using the new Strength of Signal output, nothing has gotten above ~50 (the included sample is just 46 in the south-central portion of the CWA), and indeed there has been little significant development in those areas.  Nothing has triggered the UW Cloud Top Cooling algorithm yet in our area as of 1902 UTC.

Convective Initiation Algorithms valid 1845 UTC 2012-05-15

MLB: 2100_05142012…CI and CTC

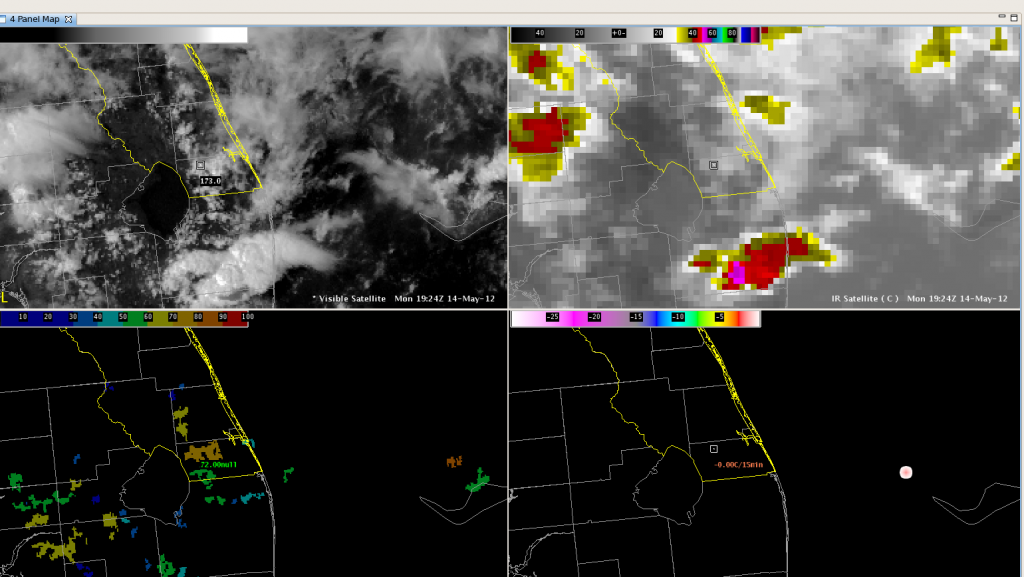
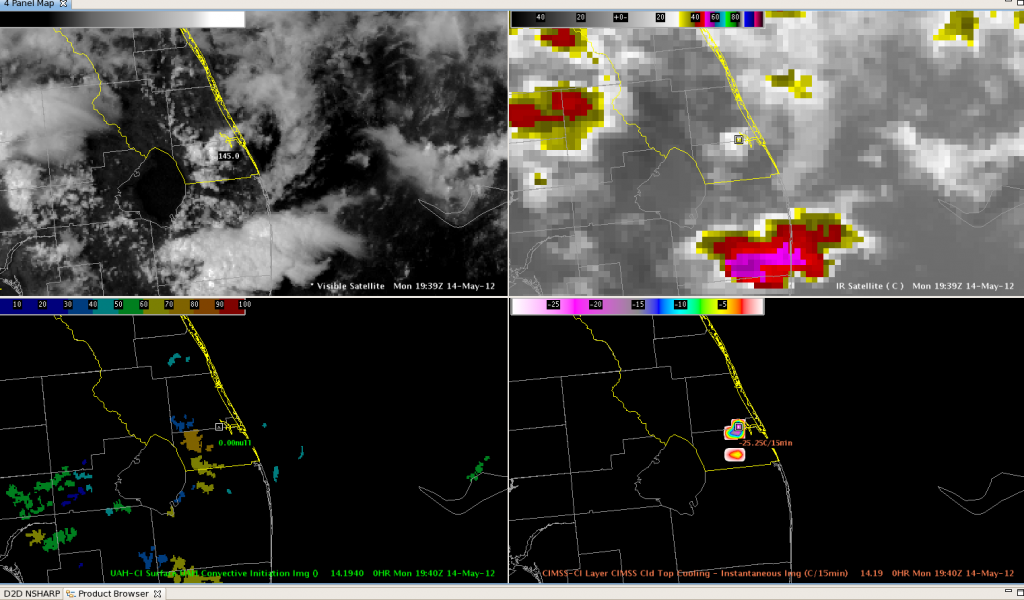
As we were getting started looking at weather in Florida, a good case for the Convective Initiation and Cloud Top Cooling algorithms took place over the southern county of MLB’s CWA.  Convective Initiation gave first indication of developing convection at 1925z.

Cloud Top Cooling gave a strong signal at 1940z and 1945z.

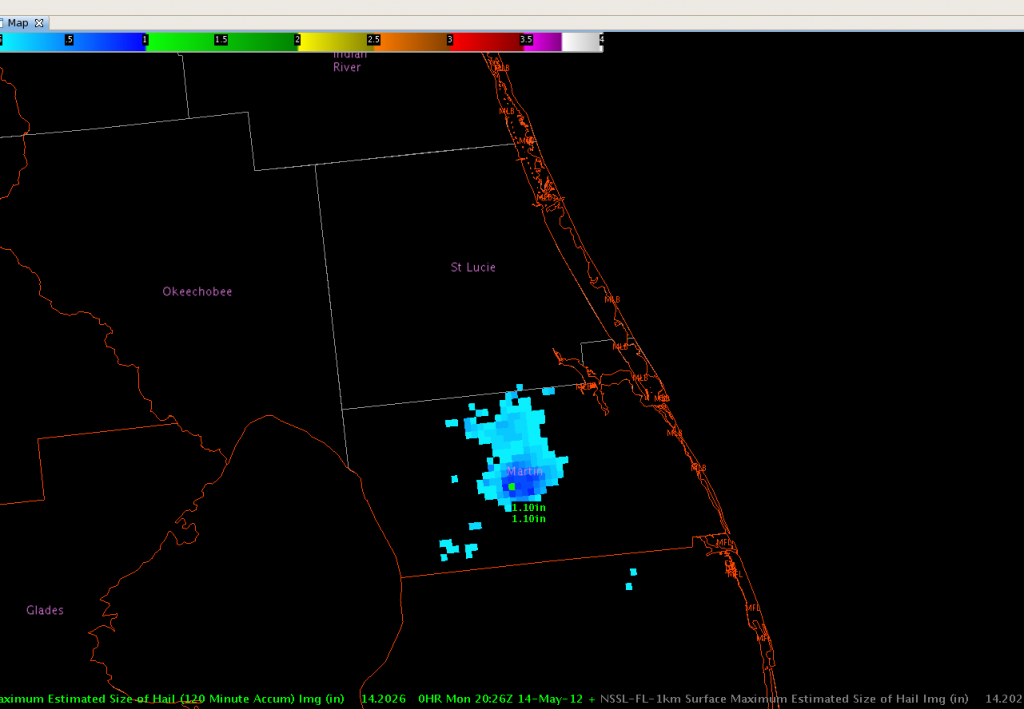
Max Estimated Hail Size (MESH) indicated Hail at 1.1 inch at 2026z.

A combination of the Convective Initiation and Cloud Top Cooling used together could have raised awareness of a possibly severe storm up to 45 minutes ahead of time.  TCD/BC