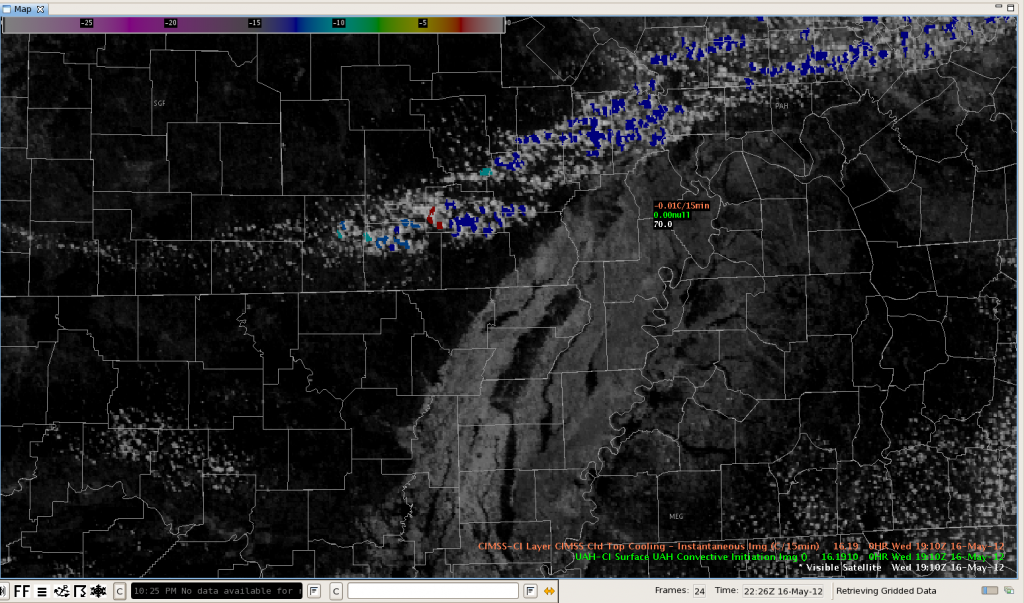
This series of images shows an ideal case of the CI product detecting a rapid development of storms along a cold front in northeast Arkansas. The first image shows a strong CI signal (red) at 19:10.
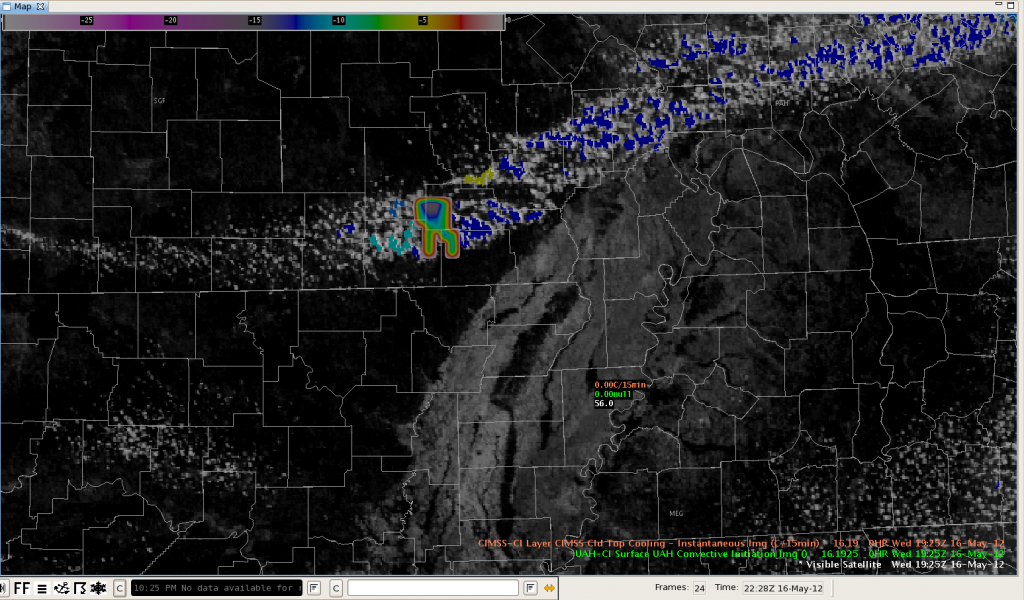
The second image shows the same area about 10 minutes later at 19:25. The weird tooth-shaped object is the Cloud Top Cooling rate and this indicated -16 deg/15 min.
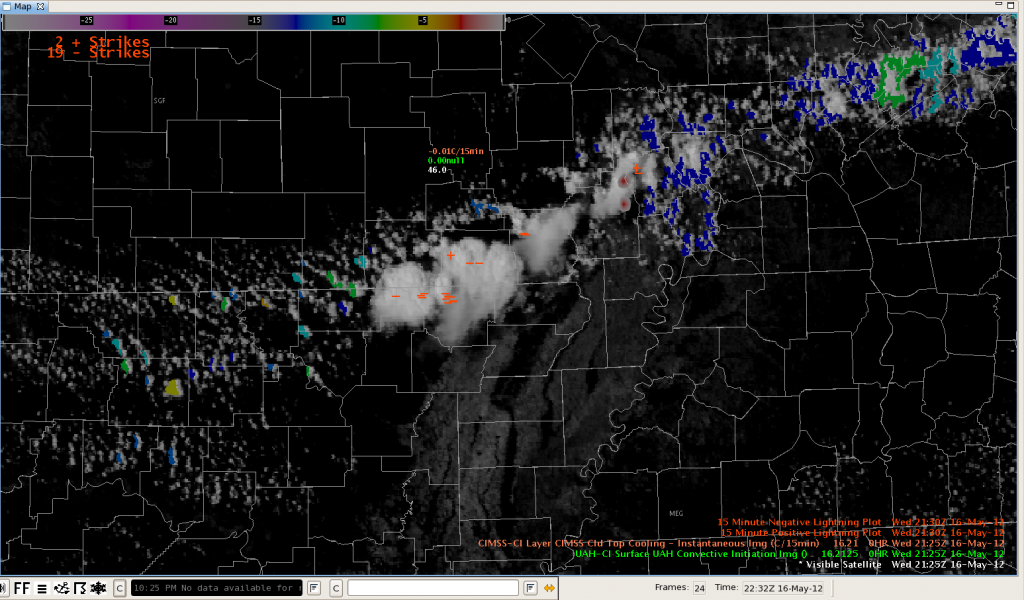
Finally, at 21:25, about two hours later, the visible imagery showed a developing storm with an overshooting top.


