Where AllSky says LI is -8, new development on IR.
Official websites use .gov
A
.gov website belongs to an official government
organization in the United States.
Secure .gov websites use HTTPS
A
lock (
) or https:// means you’ve safely connected to
the .gov website. Share sensitive information only on official,
secure websites.

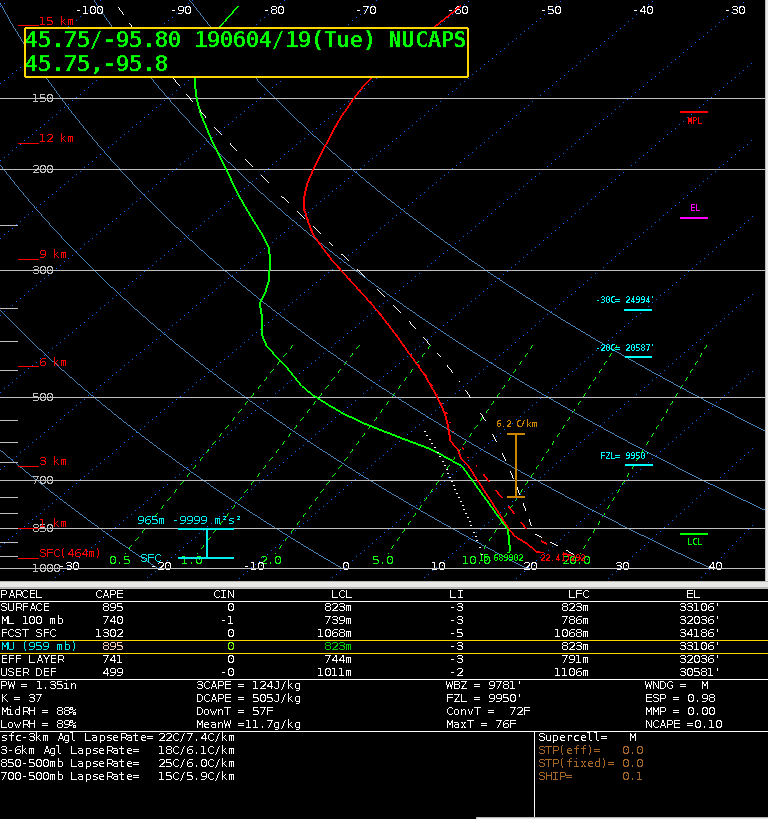
Where AllSky says LI is -8, new development on IR.
A modified NUCAPS sounding depicted a LI of -3 in the wake of the convection in the NW corner of the MPX CWA. This is within an area of more cloudiness and the All Sky LAP derived product is using GFS in this area, and shows a more unstable environment with a LI of -7.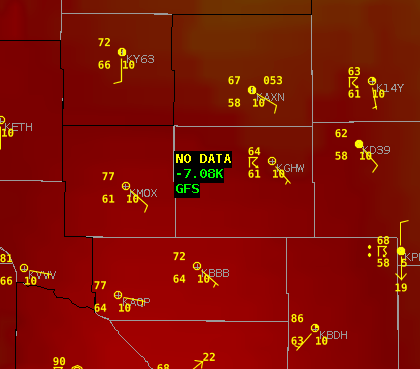
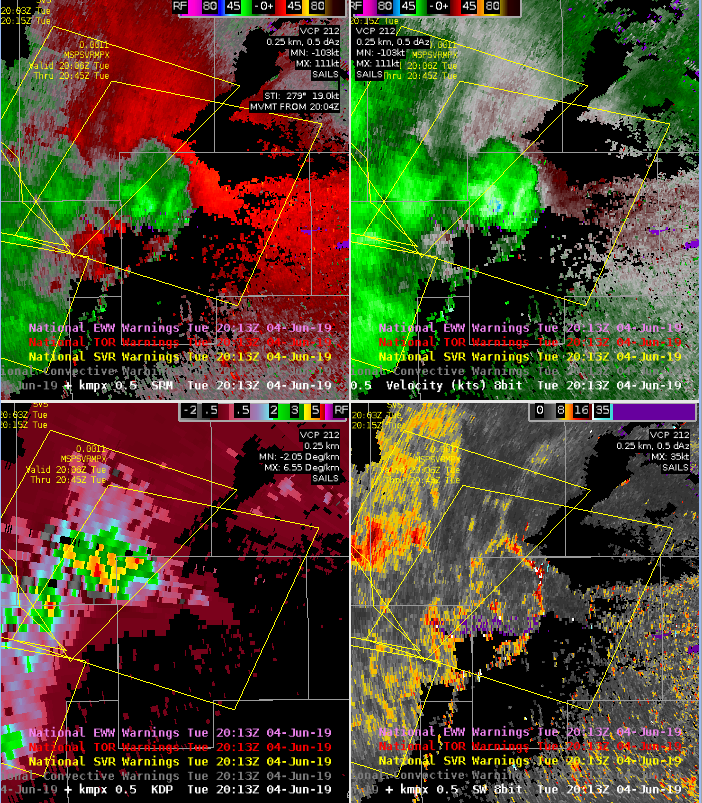
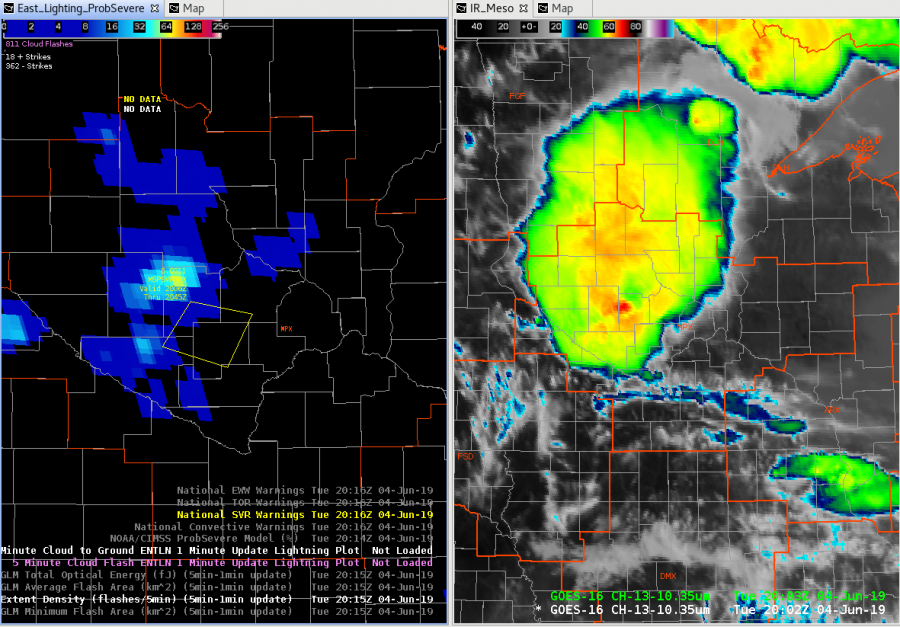
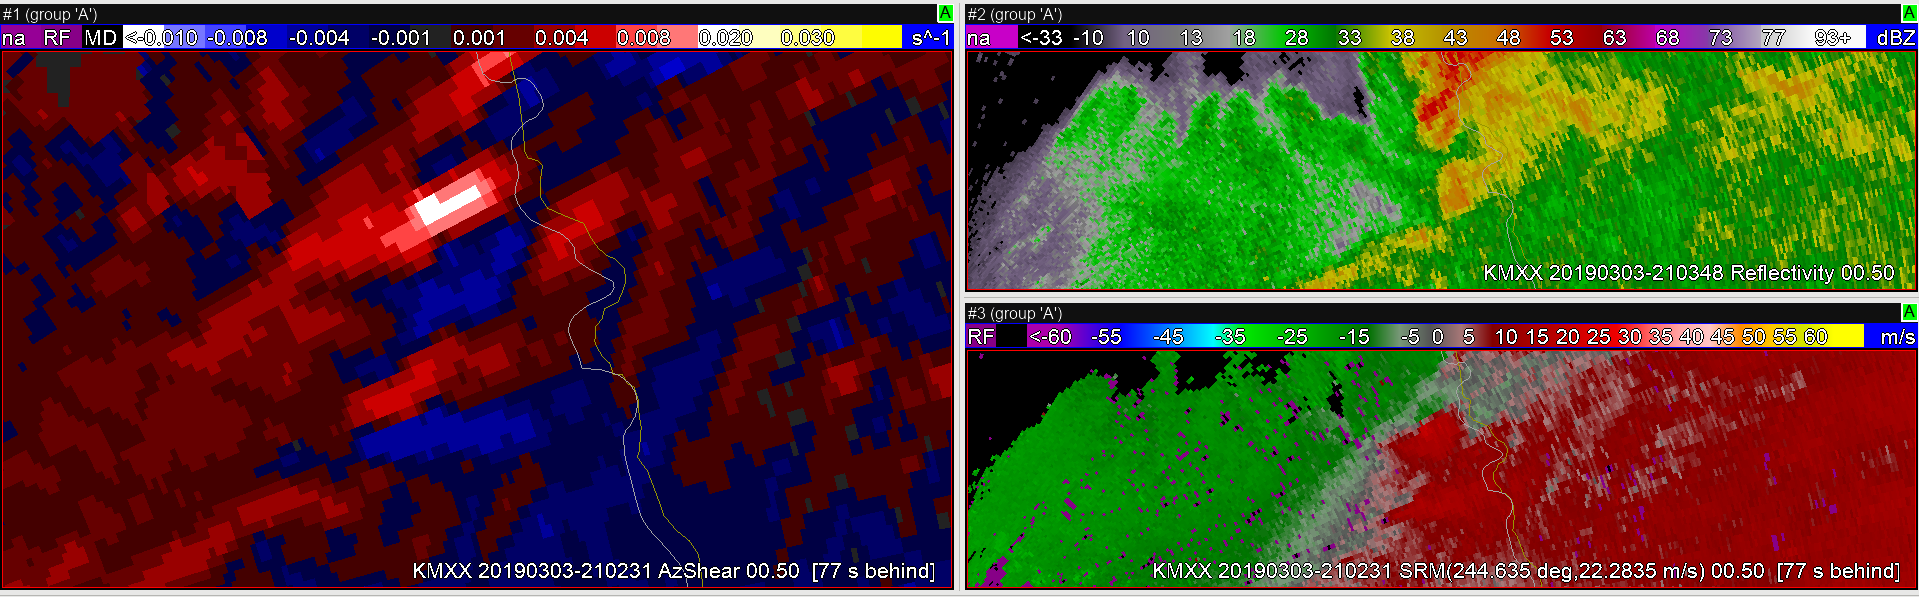
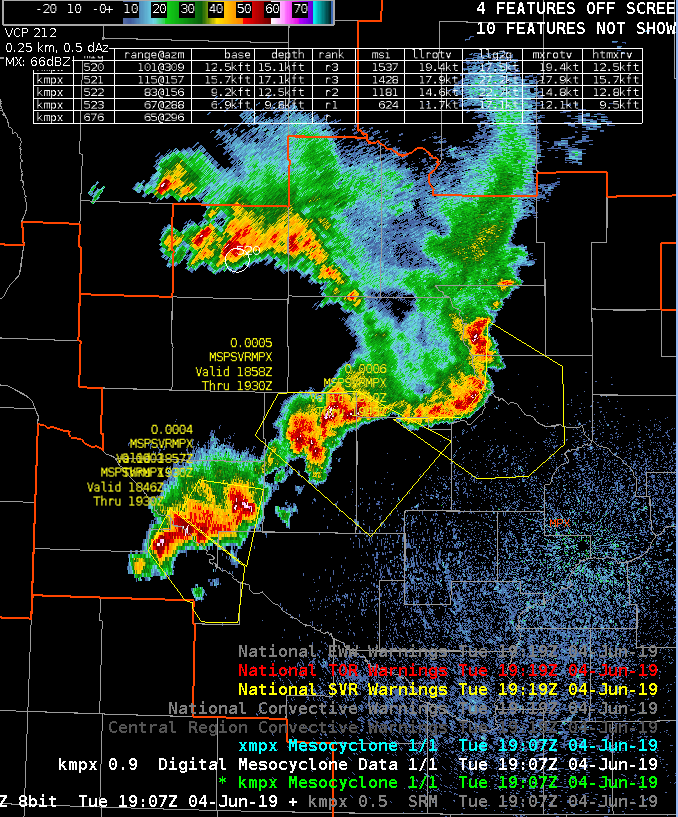
Lightning on FED starting to go up again, right as cell with rotation starts to meet up with east-west oriented boundary to the east of that cell (see bottom right spectrum width product).
AzShear product following that rotation over time well…watching for increase in intensity there.
As you’re debating issuing a tornado or severe warning, it is good to see the lightning changes over time as well as cloud tops. Both are trending more severe in the image above.
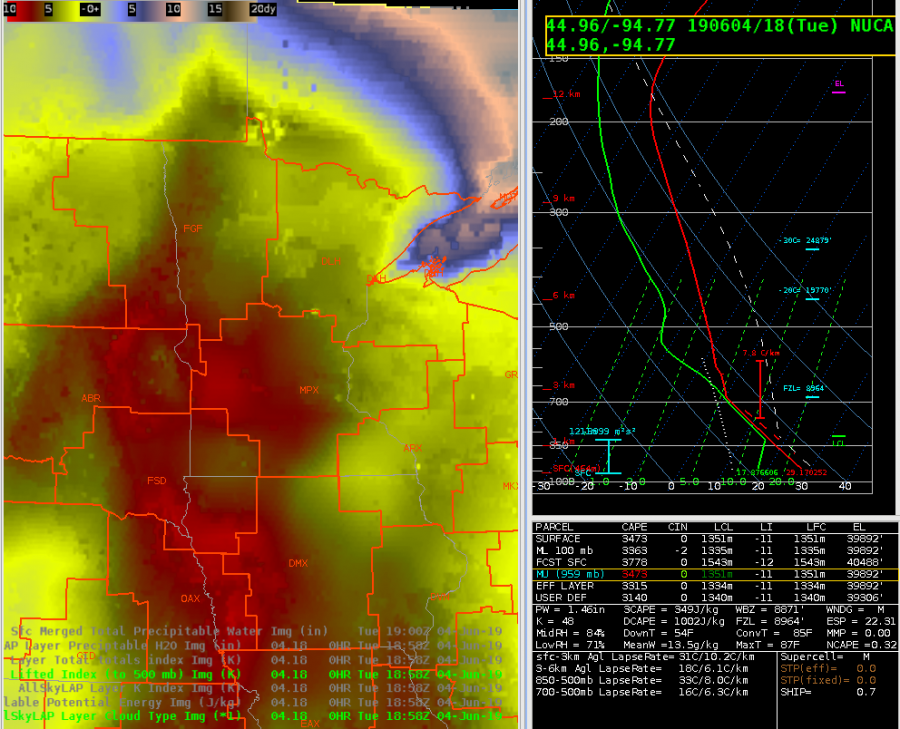
AllSky LI is dropping over time…with the peak red color above being around -8. Modified NUCAPS sounding came up with -11…whereas non-modified was -6. CAPE also is more unstable in new sounding…whereas AllSky is in the mid 2000s, NUCAPS was mid 3000s…non-modified in the mid 1000s.
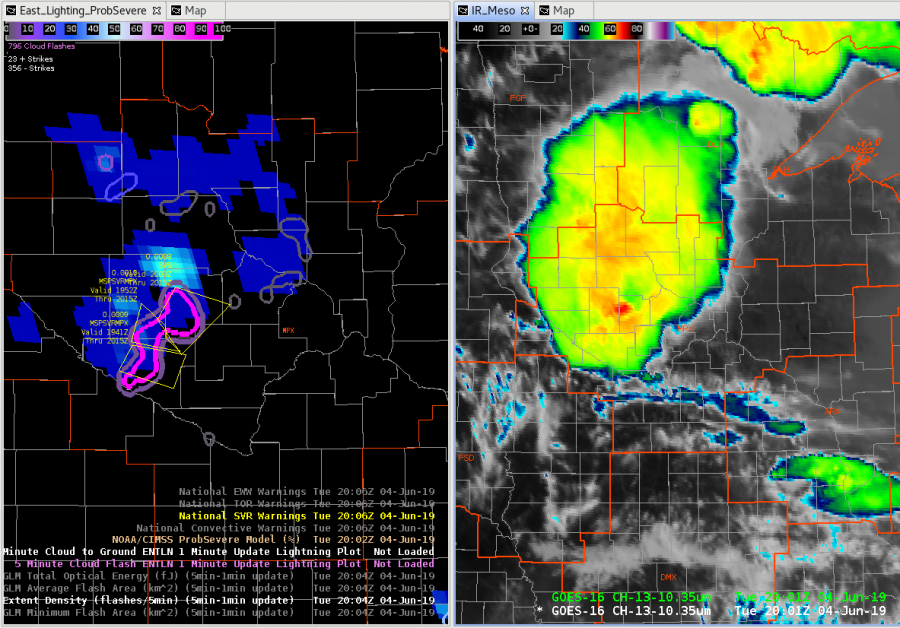
Southern warning now gusting out, and getting a rotation on the north side of that gusting.
Today’s case focuses on the March 3rd Eastern AL/Western GA AzShear Case, with the goal of evaluating the use of single radar AzShear and two merged AzShear products (i.e. 0-2km and 3 0 6km AGL).
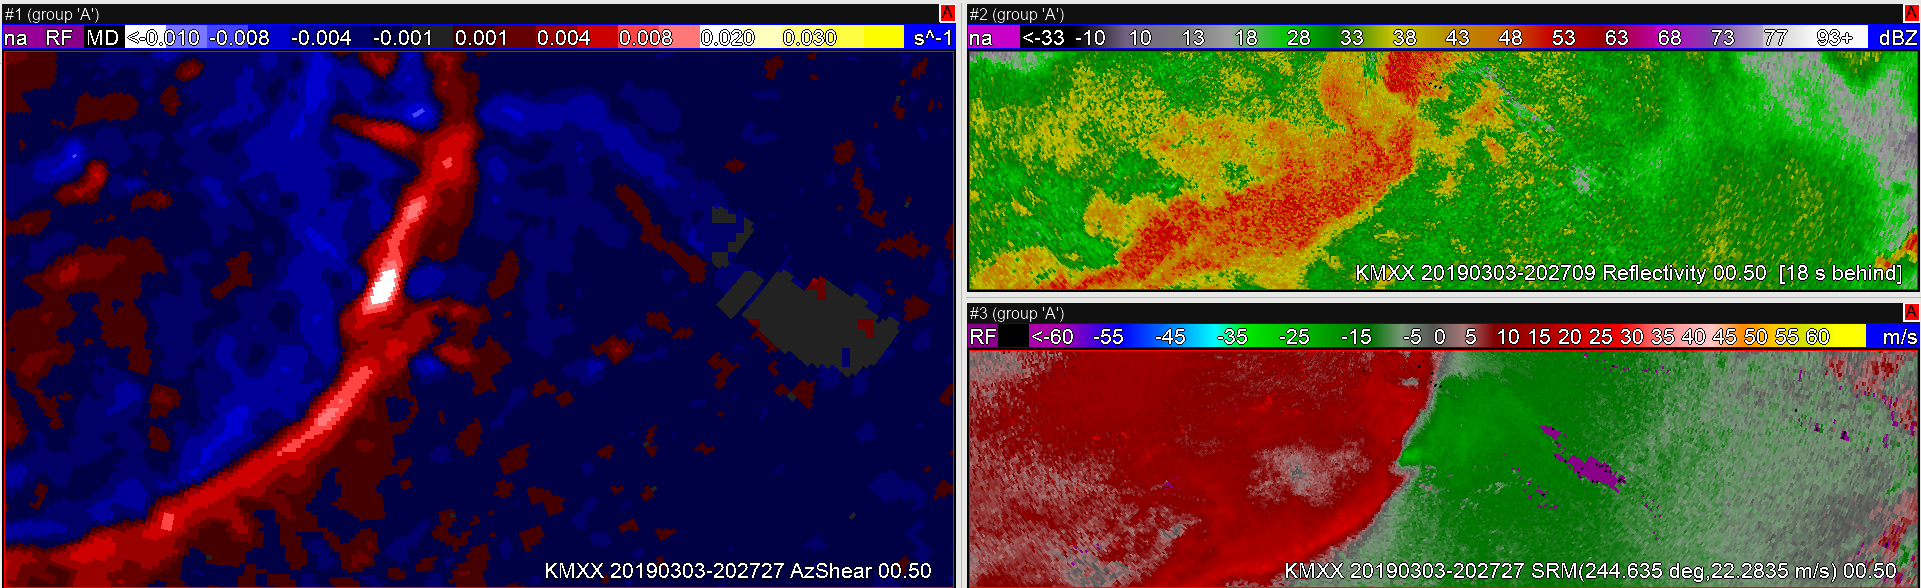
The first, more discrete cell, in the event was very noticeable in the single-radar AzShear product, with pretty persistence high values (0.02 to 0.035 S^-1) evident throughout the eventual life-span of the tornado once overlaying the post-event analysis track. It did seem to become slightly more muted as the storm progressed further east (85km from the radar site), although, to its credit, the AzShear product looked more pronounced than the BV product at said magnitude from the radar site. From a warning forecasters point of view, if just using BV, this would become a benefit of the product, however, a quick conversion and/or use of SRM fixed this issue quickly on my end. More on distance…The product, similar to it’s ingested data, did seem to get displaced a bit once the feature progressed over 100km downstream of the radar beam, no longer matching up with the post-event analyzed damage survey track (example below).
There does seem to be some utility in utilizing the single-radar AzShear product when monitoring for embedded rotation in QLCS style events. In this case, a clear in-flow notch is not clearly evident via reflectivity, which can act as an identifier and/or precursor to a QLCS style tornadic event. Thus, using the AzShear product to monitor the entire bowing line segment became a valuable situational awareness tour, highlighting potential areas of interest ahead of time. It still, however, did not replace velocity’s utility, and I’d still prefer to use BV/SRM to draw any type of warning polygons in order to minimize unnecessary FAR within the eventual warned area.
Interestingly, through the analysis process, the AzShear product picked picked up on some weaker rotation from a semi-discrete cell further North of the line, which caused me to investigate the feature further. If just monitoring BV/SRM, this feature likely would have gone unnoticed due to reflectivity/velocity cluttering around the feature. Thus reinforcing the suggestion of utilizing AzShear (All-Tilts) as a situational awareness tool to help trigger areas of interest for the weather radar operator on-shift.
Looking at features further from the radar, AzShear seemed to struggle at depicting some of the weaker features (likely due to the reliance on good velocity data input which also struggled about the same in these scenarios). It did, however, continue to pick up some of the stronger rotational couplets, doing a good job at highlighting those.
Taking a look at both the 0-2km and 0-6km merged products, I am still a bit frustrated by the SAILS induced “skipping” which is apparent. My suggestion here would be to somehow ignore the Sails slices, only producing a new product when all of the 0-2km and/or 0-6km scans are available to do so. This would make for a much cleaner picture… Yes, it would also induce latency issues, but I think the accuracy of what is being displayed would be more useful. The 0-2km and 0-6km merged products also seemed to run a little “hotter,” especially when analyzing the QLCS structure, likely picking up some significant mid-level shear associated with the linear storm-mode of convection/cold pool interaction.
Rapping up a few thoughts…
I think that single-radar AzShear is an excellent product and overall is fairly easy to read as a forecaster (although, not 100% sure of how to fully process the blue/negative colors within operations at this point) . I feel like its best utility lies with situational awareness in operations and in post-storm analysis (i.e. picking out potential damage swaths). Even with some resolution degradation in the 0-2km and 3-6km merged AzShear products, I feel they could also be useful, especially at a regional/national scale where the finer details may not be required/needed. The 0-2km may also be useful in HSLC or Tropical Tornado type environments, where the low to mid-level rotation may be a valuable pre-cursor to short-lived spinups.
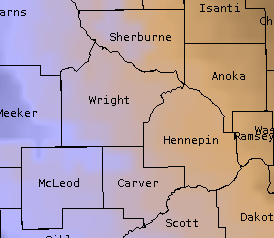
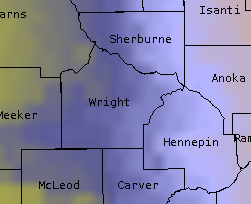
A bowing segment heading toward Wright Co., MN initially showed diminishing convective trends. However, some drying in the wake of the line combined with strong wind speeds within the lowest tilts of the radar depicted some concern for severe wind gusts, and after a diminishing trend ProbSevere did begin to increase again. Looking at the All Sky LAP CAPE, instability increased from ~960 J/kg at 1627z to ~1650 J/kg at 1828z, so the All Sky CAPE product showed some utility of assessing the downstream convective environment.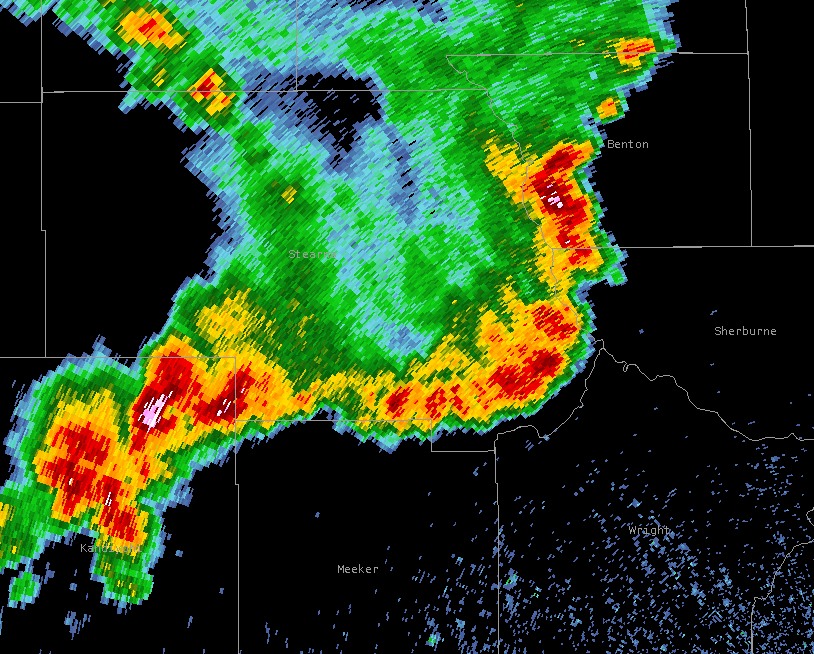
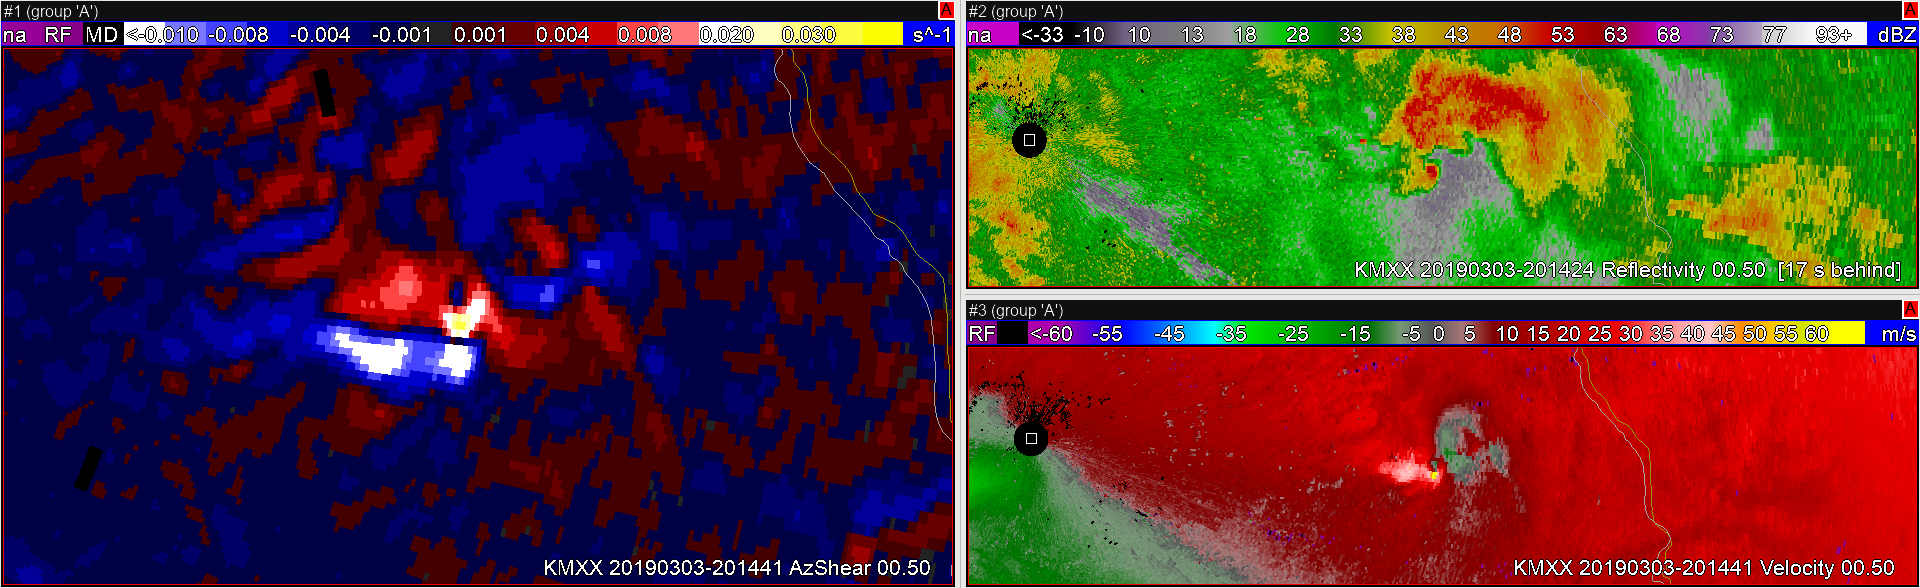
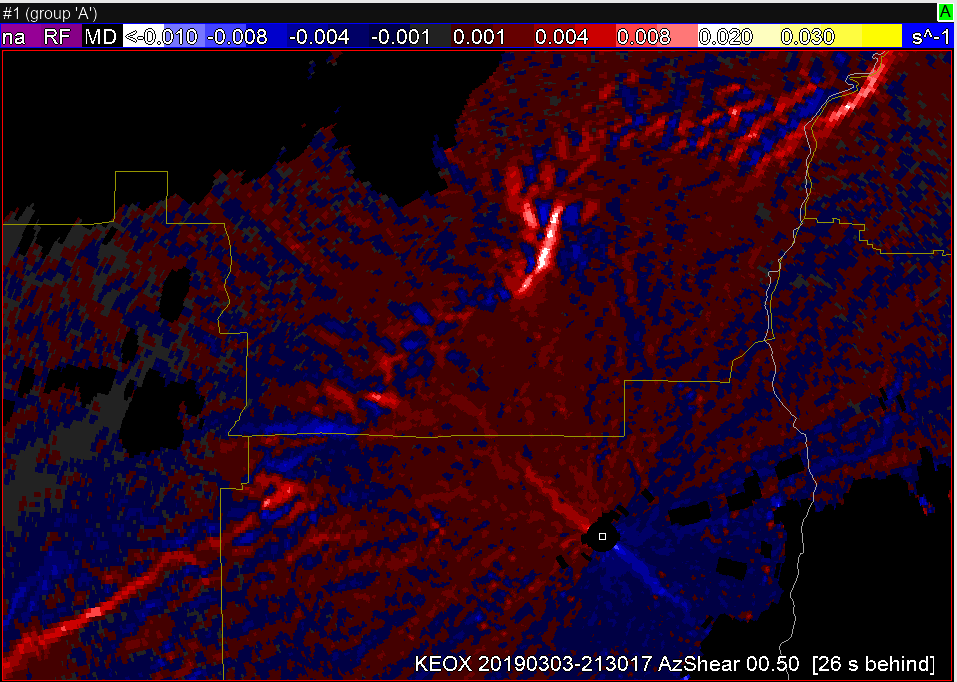
Now that convection has continued to move to the east, I’ve switched to the KEOX radar and, while reflectivity and velocity data show some interesting areas to look at, the AzShear product is guiding my attention to 3 areas, to the west, northwest and north-northwest of radar.
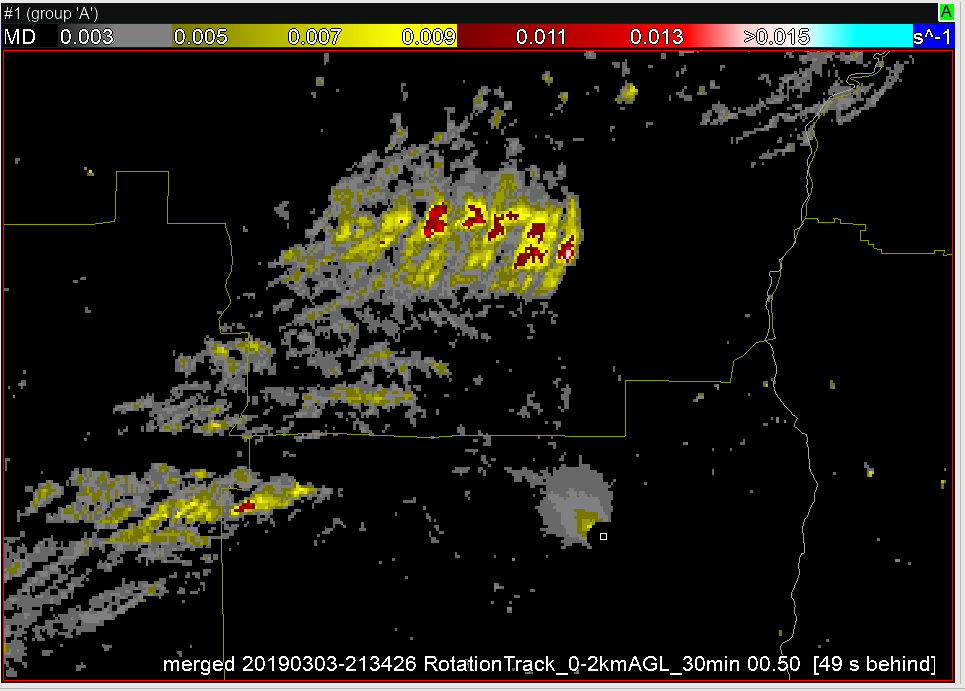
 SRM shows a couple areas of possible rotation, but nothing substantial, at least yet. The more notable area is just east of the red/white marker.
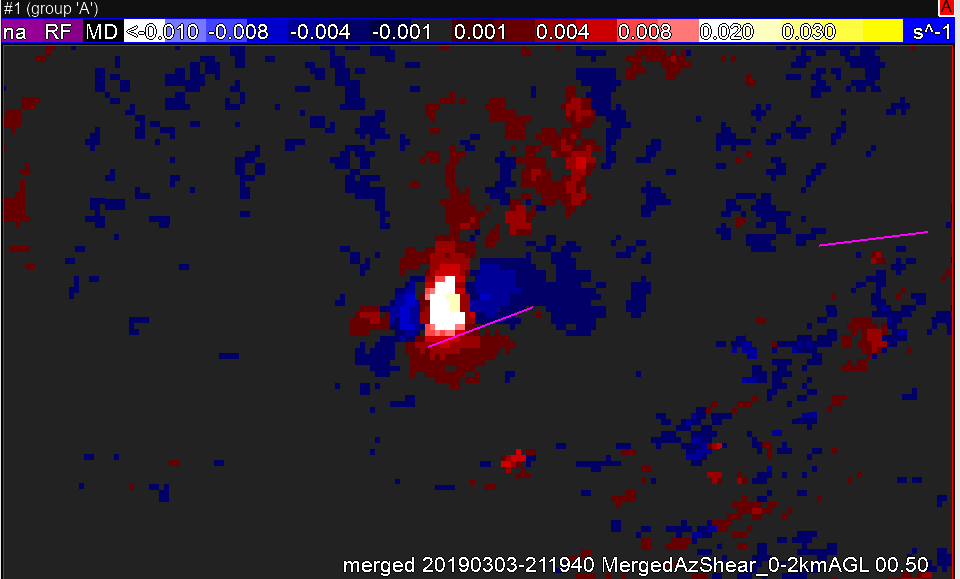
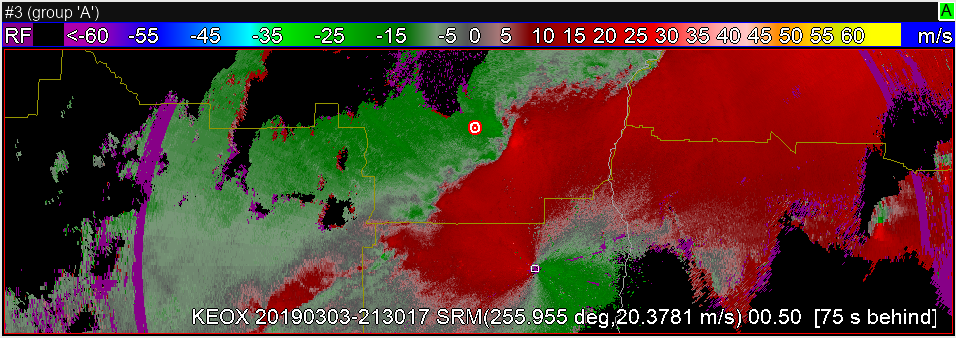 The 30-min 0-2km Rotation Track shows the recent AzShear history of the 3 cells. My most immediate concern for a developing tornado is the northern-most cell, about to pass north of the radar.